Q1 2020 INVESTOR PRESENTATION - Drive Shack Inc.
←
→
Page content transcription
If your browser does not render page correctly, please read the page content below
Q1 2020 INVESTOR PRESENTATION
Cautionary Note on Forward-Looking Statements
This disclaimer applies to this document and the verbal or written comments of any person presenting it. This document, taken
                    together with any such verbal or written comments, is referred to as the “presentation.”

This presentation contains forward-looking statements, within the meaning of the Private Securities Litigation Reform Act of
1995, which are subject to known and unknown risks, uncertainties and other important factors that may cause actual results
to be materially different.
All statements other than statements of historical fact included in this presentation are forward-looking statements, including,
but not limited to, expected financial outlook for fiscal 2020, expected operating performance, expected construction and
openings, expected sales and trends in Drive Shack Inc.’s (the "Company's") operations including statements relating to the
effects of COVID-19 and the Company’s mitigationefforts.
Forward-looking statements discuss the Company's current expectations and projections relating to its financial position,
results of operations, plans, objectives, future performance and business. You can identify forward-looking statements bythe
fact that they do not relate strictly to historical or current facts. These statements may include words such as "aim,"
"anticipate," "believe," "estimate," "expect," "forecast," "outlook," "potential," "project," "projection," "plan," "intend," "seek,"
"may," "could," "would," "will," "should," "can," "can have," "likely," the negatives thereof and other similar expressions.
Without limiting the generality of the foregoing, targeted returns and growth, including with respect to the number and timing
of new venue openings, are forward-looking statements, represent management’s view and are estimated based on current
and projected future operating performance of our locations, comparable companies in our industry and a variety of other
assumptions, many of which are beyond our control, that could prove incorrect. As a result, actual results may vary materially
with changes in our liquidity or ability to obtain financing, changes in market conditions and additional factors described in
our reports filed with the SEC, which we encourage you to review. We undertake no obligation to update these estimates.
For a discussion of some of the risks and important factors that could cause actual results to differ materially from such
forward-looking statements, see the sections entitled “Risk Factors” and “Management’s Discussion and Analysis of Financial
Condition and Results of Operations” in the Company’s periodic reports filed with the Securities and Exchange Commission
(“SEC”), which are available on the Company’s website (www.http://ir.driveshack.com). Forward-looking statements speak
only as of the date of this Presentation. We expressly disclaim any obligation to release publicly any updates or revisions to
any forward-looking statements contained herein to reflect any change in expectations with regard thereto or change in
events, conditions or circumstances on which any statement is based.

                                                                                                                                        2
1. Executive Summary
2. Operations & Development
3. Financials
4. Appendix
Executive Summary
                                       FIRST QUARTER HIGHLIGHTS

•   First two months of Q1 yielded strong financial results
       • Total Company Revenue in the quarter of $61M, +$7.2M or 13% from prior year

•   COVID-19 forced closures of venues beginning March 17
     • We worked quickly, taking immediate measures to preserve liquidity

    1
•   We are poised to reopen our venues over the next several weeks

•   We have a relatively unlevered balance sheet which provides us with a solid financial footing
    to pursue growth once the situation normalizes(1)

•   Urban Box development has continued internally and we believe can generate significant
    growth

                                                                                                                                                                  4
               1) The Company has only $51M of Junior subordinated notes due 2034 and $18M of finance leases as debt on the balance sheet as of March 31, 2020.
Executive Summary
                         COVID-19 RESPONSE & INITIATIVES

                 Critical steps were taken early in order to protect liquidity

Current unrestricted cash of $14M(1)

•   We have significantly reduced spending:
     o Furloughed over 4000 employees
     o Deferred payment of 2019 annual employee bonuses
     o Elected not to pay Q1 2020 preferred equity dividends
     o Negotiating rent abatements or deferrals on leased properties

•   We have deferred all discretionary capital projects:
     o All construction on Drive Shack venues
     o Capital projects on AGC golf courses

o   We have developed a safe and responsible reopening plan

                  1) As of April 30, 2020.
                  Based on management’s current views and estimates. See “Disclaimers” at the beginning of this Presentation for more information on forward-looking statements.   5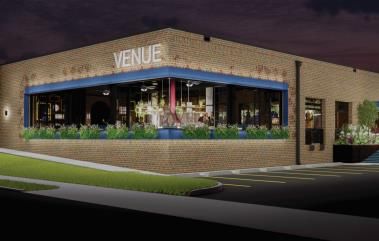
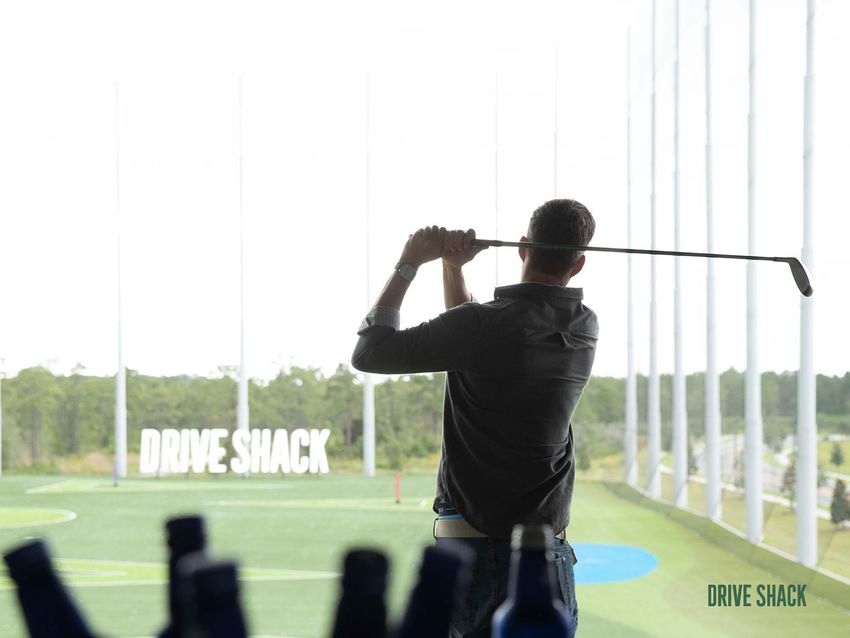
OUR FOCUS AT DRIVE SHACK IS SIMPLE…
•   We will safely and successfully reopen our venues

•   We will continue to focus on the “eatertainment” industry, building 1-2 “core” big box venues per year

•   We will successfully launch the Urban Box venues, having our first 2 venues fully operational in 2021

                                                                                                                             CHICAGO, IL

                                                                                                                                                             MANHATTAN, NY

                                                                                                                                                       RICHMOND, VA

                                                                                                                                                    CHARLOTTE, NC

                                                                                                                                                    RALEIGH, NC
                   NEWPORT BEACH, CA

                                                                                                                                                  ORLANDO, FL

                                                                                                                                                    WEST PALM BEACH, FL
                                                                                                         NEW ORLEANS, LA
          Core Drive Shack                                                                         DALLAS, TX
          (Open venues in black)

           Urban Box

          Potential Markets

                            Based on management’s current views and estimates. See “Disclaimers” at the beginning of this Presentation for more information on forward-looking statements.   6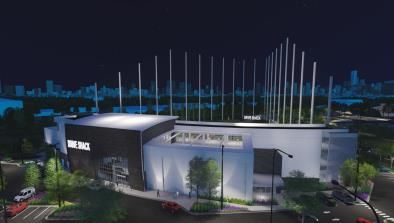
Executive Summary
                                                      OUR VENUES
                                           Drive Shack Core Venues
     Venues In Operation                                                                                 Committed Venues
                                  Raleigh, NC                                                  New Orleans                                Chicago
                                   Q3 2019
                                                                                                  2021                                     2021
Orlando, FL
                                Richmond, VA
 Beta Site                                                                                         Newport                              Manhattan
   2018                            Q3 2019
                                                                                                    2022                                  2022

                          West Palm Beach, FL
                                Q4 2019

                                                    Urban Box Venues

     Committed Venues                                                                                                  Active Pipeline
            2021 openings
                                                                                                    Total Identified Sites                                               60+
  Dallas, TX                      Charlotte, NC
   36-hole                          18-hole

                                                                                                                                                                               7
        Based on management’s current views and estimates. See “Disclaimers” at the beginning of this Presentation for more information on forward-looking statements.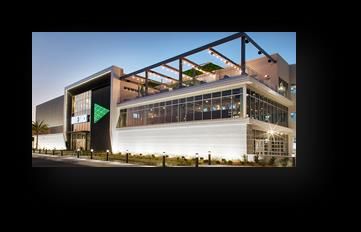
1. Executive Summary
2. Operations & Development
3. Financials
4. Appendix
Operations & Development
                                                     CURRENT VENUES

                                        Gen 2.0 Venues                                                                                                          Beta Site

          Raleigh                            Richmond                                            West Palm                                                   Orlando

     Opened Aug. 19, 2019               Opened Sep. 16, 2019                               Opened Oct. 14, 2019                                        Opened Apr. 2018

              COVID-19 Closure Mar. 17, 2020                                                                          COVID-19 Closure Mar. 19, 2020

•   In Q1 2020 venues generated total revenue of ~$10M, which is ~10% below internal projections,
    due to the disruption in business caused by COVID-19

     Early indications from some state governments across the United States suggest that some
                                    locations could be open as early as May 2020.

                     Based on management’s current views and estimates. See “Disclaimers” at the beginning of this Presentation for more information on forward-looking statements.
                                                                                                                                                                                      9
Operations & Development
CLOSURE INITIATIVES
• Promote cost efficiencies
• Further streamline operations
• Reduce overhead by creating synergies
• Develop operation strategy for post COVID-19
• Employee antibody testing
• Rigorous sanitation standards
• Mandated capacity restrictions
• Enforced social distancing
• Smaller group sizes
• Maintain focus on driving growth post COVID-19
• Development of reservations platform
• Mobile ordering from bay
• Games geared towards a focus on smaller groups
• Urban Box development
10
Based on management’s current views and estimates. See “Disclaimers” at the beginning of this Presentation for more information on forward-looking statements.Operations & The Path Forward
SAFELY REOPENING
Our #1 priority is the safety of our Guests and Employees
Employees
• Drive Shack will administer antibody testing, which will be required for all employees to
return to work
• Employees will undergo daily temperature screening prior to being permitted to work
• All Employees will be required to wear PPE (gloves, masks, face shields) for the duration of
their shifts
• Additional training will be provided to reinforce all CDC guidelines and to ensure the
proper use of PPE
• Any Employee who feels unwell will be required to stay home
Guests
• Drive Shack will enforce local laws regarding wearing masks and social distancing where
applicable
• All Guests will undergo a quick temperature screen prior to being permitted into the
venue
11
Based on management’s current views and estimates. See “Disclaimers” at the beginning of this Presentation for more information on forward-looking statements.Operations & Development
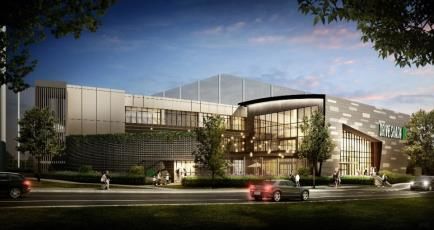
FUTURE VENUES
“CORE” DRIVE SHACK
In Development In Development
New Orleans Chicago Newport Beach Manhattan
DELAYED UNTIL 2021 2021 2022 2022
72-bay
URBAN BOX
Dallas Charlotte
DELAYED UNTIL 2021 DELAYED UNTIL 2021
Based on management’s current views and estimates. See “Disclaimers” at the beginning of this Presentation for more information on forward-looking statements. 12Operations & Development
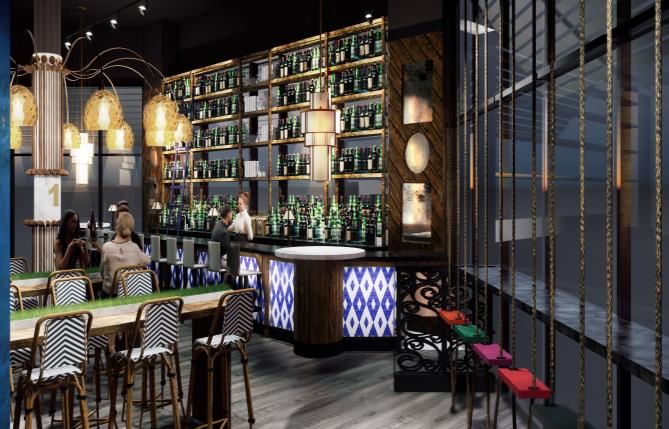
THE PUTTERY
• Using state-of-the-art mini golf as the anchor, The Puttery
will combine competitive socializing, F&B and
technology to create one remarkable experience,
featuring:
o An adult-focused, modern spin on the classic game of mini
golf, using innovative auto-scoring tech
o A high energy atmosphere centered around a lively
cocktail bar with rotating DJs
o Curated, chef-inspired culinary offerings alongside
inventive craft cocktails
• The design process for this new format has been
ongoing and is on track
• We plan to begin construction on our new Urban Box
venues in fall 2020
13
Based on management’s current views and estimates. See “Disclaimers” at the beginning of this Presentation for more information on forward-looking statements.Operations & Development
THE MATH
• Core Venue EBITDA is between $4 to $6 million and Urban Box of $2 to $3 million
• Our goal is to build 4+ additional Core Drive Shack venues & 50+ Urban Box venues by the end
of 2024
Drive Shack Core Venues Urban Box Venues
$ in millions $ in millions
Development Cost(1) $25 - $40 Development Cost(1) $7 - $11
Total Revenue $15 - $25 Total Revenue $7 - $11
Site-level EBITDA $4 - $6 Site-level EBITDA $2 - $3
Development Yields 10 – 20% Development Yields 25 – 35%
Total Core EBITDA(2): $32-$48M Total Urban Box EBITDA(3): $100-$150M
We believe that as we continue to open additional Urban Box venues, yields will be
even higher due to learned efficiencies in construction and operations
(1) Development cost target is inclusive of all construction costs, soft costs, and pre-opening expenses.
(2)
(3)
Total “Core” EBITDA is based on 8 Core Venue sites at Site-level EBITDA of $4 to $6 million per site.
Total Urban Box EBITDA is based on 50 Urban Box Venues at Site-level EBITDA of $2 to $3 million per site. 14
Based on management’s current views and estimates. See “Disclaimers” at the beginning of this Presentation for more information on forward-looking statements.1. Executive Summary 2. Operations & Development 3. Financials 4. Appendix
Financials
                  FIRST QUARTER FINANCIAL RESULTS

                             Total Company Revenue of $61M, +$7.2M or 13% from prior year
Total Company                • Revenue of $48M after adjusting for management fee reimbursement of $13M,
                               increased $3.6M or 8% from the prior year

                           Total Drive Shack Revenue of $10M, -10% vs. same-period projection
Drive Shack
                           • Drive Shack Gen 2.0 venues generated $9M of Revenue, -10% vs. same period
  (4 Sites)                  projection

                           Total AGC Revenue of $38M, +$3.9M or 11% on a same store, same
    AGC                    period basis
(61 Courses)               • Rounds Played +14%, Total Members +4%

              1) Same period reforecast adjusted for venue closure in March                                16
1. COVID-19 Response 2. Operations & Development 3. Financials 4. Appendix
GAAP FINANCIAL RESULTS

▪ Q1 2020 GAAP Loss of $19 million, or $0.28/share vs. GAAP Loss of $0.24/share in Q1 2019

                                                              GAAP Financial Results

                                                                              Q1 2020                                                             Q1 2019

                                                               ($ in millions)               (basic share)                         ($ in millions)               (basic share)

        GAAP Loss                                                  ($19)                        ($0.28)                                ($16)                        ($0.24)

                                                                                                                                                                                 18
                    Note: Per share represents per weighted average basic share unless otherwise noted. All per share amounts are represented on a weighted average basis.
CONSOLIDATED STATEMENT OF OPERATIONS
($ in thousands, except per share data) Three Months Ended March 31,
2020 2019
Revenues
Golf operations $48,625 $44,706
Sales of food and beverages $12,510 $9,246
Total revenues $61,135 $53,952
Operating costs
Operating expenses $54,367 $47,723
Cost of sales – food and beverages $3,655 $2,698
General and administrative expense $9,818 $11,619
Depreciation and amortization $6,794 $4,924
Pre-opening costs $552 $1,179
Impairment and other losses $792 $4,088
Total operating costs $75,978 $72,231
Operating Loss ($14,843) ($18,279)
Other income (expenses)
Interest and investment income $130 $344
Interest expense, net ($2,745) ($2,153)
Other income (loss) $367 $5,488
Total other income (expenses) ($2,248) $3,679
Loss before income tax ($17,091) ($14,600)
Income tax expense $271 —
Net loss ($17,362) ($14,600)
Preferred dividends ($1,395) ($1,395)
Loss Applicable to Common Stockholders ($18,757) ($15,995)
Per WA Basic Share ($0.28) ($0.24)
19CONSOLIDATED BALANCE SHEET (CONDENSED)
($ in thousands except per share data As of 3/31/2020 As of 12/31/2019
Assets
Current Assets:
Cash and cash equivalents $16,785 $28,423
Restricted cash $3,041 $3,103
Accounts receivable, net $4,190 $5,249
Real estate assets, held-for-sale, net $16,970 $16,948
Real estate securities, available-for-sale $3,103 $3,052
Other current assets $13,966 $17,521
Total Current Assets $58,055 $74,296
Restricted cash, noncurrent $513 $438
Property and equipment, net of accumulated depreciation $184,219 $179,641
Operating lease right-of-use assets $212,246 $215,308
Intangibles, net of accumulated amortization $16,780 $17,565
Other investments $24,365 $24,020
Other assets $5,245 $4,723
Total Assets $501,423 $515,991
Liabilities
Current Liabilities:
Obligations under finance leases $6,004 $6,154
Membership deposit liabilities $10,784 $10,791
Accounts payable and accrued expenses $31,242 $25,877
Deferred revenue $25,118 $26,268
Real estate liabilities, held-for-sale $4 $4
Other current liabilities $23,367 $23,964
Total Current Liabilities $96,519 $93,058
Credit facilities and obligations under finance leases - noncurrent $12,468 $13,125
Operating lease liabilities - noncurrent $185,802 $187,675
Junior subordinated notes payable $51,190 $51,192
Membership deposit liabilities, noncurrent $97,648 $95,805
Deferred revenue, noncurrent $6,389 $6,283
Other liabilities $3,496 $3,278
Total Liabilities $453,512 $450,416
Stockholders' Equity
Preferred Stock $61,583 $61,583
Common Equity ($13,672) $3,992
Total Stockholders' Equity $47,911 $65,575
Total Liabilities & Stockholders' Equity $501,423 $515,991
20You can also read