Quantitative Detection of Phenobarbitol Injection with SERS - This is title
←
→
Page content transcription
If your browser does not render page correctly, please read the page content below
®

October 2018 Volume 33 Number 10             www.spectroscopyonline.com

                              Quantitative Detection
                                   of Phenobarbitol
                                Injection with SERS
                              The Role of Atomic Spectroscopy
                                in Understanding Lead Toxicity
                                                 Dealing with Outliers

                   2018 Emerging Leader in Molecular Spectroscopy
                   Award Winner Megan Thielges
High-Power UV-NIR LEDs
    New LSM Series LEDs for Fluorescence Excitation and More

X Choose from discrete and broadband
  UV-NIR wavelength options

X Operate LEDs using smart controller
  with LCD touch screen

X Use continuous or modulation
  modes and optional triggering

X Experiment with various waveforms
  and frequencies

                                                                              NEW

                              w w w. o c e a n o p t i c s . c o m
   info@oceanoptics.com • US +1 727-733-2447 • EUROPE +31 26-3190500 • ASIA +86 21-6295-6600
publish faster

      discover

       advance
       research                                                               +?9_P9HTHU0THNPUN
                                                                                  4PJYVZJVWL

                                         reveal
                                       chemistry                                                                         evolve
                                                                                                                        materials

What did you do today?
Whether you’re discovering new materials, solving analytical problems or assuring
WYVK\J[X\HSP[``V\YZWLJ[YVTL[LYULLKZ[VKLSP]LY[OLKLÄUP[P]LHUZ^LYZ`V\»YL
SVVRPUNMVY·MHZ[;OLYTV-PZOLY:JPLU[PÄJNVLZIL`VUK`V\YL_WLJ[H[PVUZ^P[O
a full line of FTIR, NIR and Raman spectroscopy systems to help you move from
sample to answer, faster than ever before.

>P[O[OL;OLYTV:JPLU[PÄJ™ DXR™_P9HTHU0THNPUN4PJYVZJVWL`V\NL[HU
easy-to-use system that rapidly delivers accurate data – so you spend less time
JVUJLU[YH[PUNVUTLHZ\YLTLU[HUKTVYL[PTLVUZJPLU[PÄJKPZJV]LY`

Discover. Solve. Assure. [OLYTVÄZOLYJVTKPZJV]LYK_Y

-VY9LZLHYJO
4 Spectroscopy 33(10) Oc tober 2018 w w w. s p e c t r o s c o p y o n l i n e . c o m
®
MANUSCRIPTS: To discuss possible article topics or obtain manuscript preparation 485F US Highway One South, Suite 210
guidelines, contact the editorial director at: (732) 346-3020, e-mail: Laura.Bush@ Iselin, NJ 08830
ubm.com. Publishers assume no responsibility for safety of artwork, photographs, or (732) 596-0276
Fax: (732) 647-1235
manuscripts. Every caution is taken to ensure accuracy, but publishers cannot accept
responsibility for the information supplied herein or for any opinion expressed. Michael J. Tessalone
Vice President/Group Publisher
SUBSCRIPTIONS: For subscription information: Spectroscopy, P.O. Box 6196, Duluth, MN
Michael.Tessalone@ubm.com
55806-6196; (888) 527-7008, 7:00 a.m. to 6:00 p.m. CST. Outside the U.S., +1-218-740-6477.
Delivery of Spectroscopy outside the U.S. is 3–14 days after printing. Single-copy price: Stephanie Shaffer
Publisher
U.S., $10.00 + $7.00 postage and handling ($17.00 total); Canada and
Stephanie.Shaffer@ubm.com
Mexico, $12.00 + $7.00 postage and handling ($19.00 total); Other
international, $15.00 + $7.00 postage and handling ($22.00 total).
Edward Fantuzzi
Associate Publisher
CHANGE OF ADDRESS: Send change of address to Spectroscopy, P.O. Box 6196, Edward.Fantuzzi@ubm.com
Duluth, MN 55806-6196; provide old mailing label as well as new address; include ZIP
or postal code. Allow 4–6 weeks for change. Alternately, go to the following URL for
Michael Kushner
Senior Director, Digital Media
address changes or subscription renewal: http://ubmsubs.ubm.com/?pubid=SPEC Michael.Kushner@ubm.com
RETURN ALL UNDELIVERABLE CANADIAN ADDRESSES TO: IMEX Global Solutions, P.O. Box
Laura Bush
25542, London, ON N6C 6B2, CANADA. PUBLICATIONS MAIL AGREEMENT No.40612608. Editorial Director
REPRINT SERVICES: Reprints of all articles in this issue and past issues are available Laura.Bush@ubm.com
(500 minimum). Licensing and Reuse of Content: Contact our official partner, Wright’s
John Chasse
Media, about available usages, license fees, and award seal artwork at Advanstar@ Managing Editor
wrightsmedia.com for more information. Please note that Wright’s Media is the only John.Chasse@ubm.com
authorized company that we’ve partnered with for Advanstar UBM materials.
Jerome Workman, Jr.
C.A.S.T. DATA AND LIST INFORMATION: Contact Melissa Stillwell, (218) 740-6831; Senior Technical Editor
e-mail: Melissa.Stillwell@ubm.com Jerome.Workman@ubm.com
INTERNATIONAL LICENSING: Jillyn Frommer, (732) 346-3007, Cindy Delonas
fax: (732) 647-1104; e-mail:Jillyn.Frommer@ubm.com Associate Editor
Cindy.Delonas@ubm.com
Kristen Moore
Rec
ycled P
a
Webcast Operations Manager
%
Kristen.Moore@ubm.com
pe
50
r
10-20%
aste
Vania Oliveira
rW
Po
s t C s u me Project Manager
on
Vania.Oliveira@ubm.com
Sabina Advani
Digital Production Manager
© 2018 UBM. All rights reserved. No part of this publication may be reproduced or transmitted Sabina.Advani@ubm.com
in any form or by any means, electronic or mechanical including by photocopy, recording, or
Kaylynn Chiarello-Ebner
information storage and retrieval without permission in writing from the publisher. Authorization to Managing Editor, Special Projects
photocopy items for internal/educational or personal use, or the internal/educational or personal Kaylynn.Chiarello.Ebner@ubm.com
use of specific clients is granted by UBM for libraries and other users registered with the Copyright
Dan Ward
Clearance Center, 222 Rosewood Dr. Danvers, MA 01923, 978-750-8400 fax 978-646-8700 Art Director
or visit http://www.copyright.com online. For uses beyond those listed above, please direct your dward@hcl.com
written request to Permission Dept. fax 732-647-1104 or email: Jillyn.Frommer@ubm.com.
Brianne Pangaro
UBM Americas provides certain customer contact data (such as customers’ names, addresses, Marketing Associate
phone numbers, and e-mail addresses) to third parties who wish to promote relevant products, Brianne.Pangaro@ubm.com
services, and other opportunities that may be of interest to you. If you do not want UBM Ameri- Melissa Stillwell
cas to make your contact information available to third parties for marketing purposes, simply call C.A.S.T. Data and List Information
toll-free 866-529-2922 between the hours of 7:30 a.m. and 5 p.m. CST and a customer service Melissa.Stillwell@ubm.com
representative will assist you in removing your name from UBM Americas lists. Outside the U.S.,
Thomas W. Ehardt
please phone 218-740-6477. Executive Vice-President, Senior Managing Director
Spectroscopy does not verify any claims or other information appearing in any of the adver-
UBM Life Sciences Group
Tom.Ehardt@ubm.com
tisements contained in the publication, and cannot take responsibility for any losses or other
damages incurred by readers in reliance of such content. Dave Esola
VP & General Manager
Spectroscopy welcomes unsolicited articles, manuscripts, photographs, illustrations and other UBM Life Sciences Group
materials but cannot be held responsible for their safekeeping or return. Dave.Esola@ubm.com
To subscribe, call toll-free 888-527-7008. Outside the U.S. call 218-740-6477. Jillyn Frommer
Permissions
Jillyn.Frommer@ubm.com
Jesse Singer
UBM Americas (www.ubmamericas.com) is a leading worldwide media company providing Production Manager
integrated marketing solutions for the Fashion, Life Sciences and Powersports industries. UBM jsinger@hcl.com
Americas serves business professionals and consumers in these industries with its portfolio
Wendy Bong
of 91 events, 67 publications and directories, 150 electronic publications and Web sites, as Audience Development Manager
well as educational and direct marketing products and services. Market leading brands and a Wendy.Bong@ubm.com
commitment to delivering innovative, quality products and services enables UBM Americas to
“Connect Our Customers With Theirs. UBM Americas has approximately 1000 employees and
Morgan Hight
Audience Support Analyst
currently operates from multiple offices in North America and Europe.
Morgan.Hight@ubm.com
State-of-the-Art X-Ray Solutions
                                          •FAST SDD®                                               •SDD                             •Si-PIN
                          In-house manufacturing = The highest performing detectors available
                     The best detector for optimal results
                                Amptek Detector Comparison: Si-PIN, Standard SDD, and FAST SDD®
                                              55
                                                Fe FWHM vs Peaking Time at 210 K
                    300

                    280                                                                                           FAST SDD® Detector
                    260
                                                       25 mm2 Si-PIN                                  >2,000,000 CPS and 122 eV FWHM Resolution
                    240
Fe FWHM @ 5.9 keV

                    220                  13 mm2 Si-PIN                                                 Options:
                    200                                                                                •   25 mm2 collimated to 17 mm2
                                   6 mm2 Si-PIN
                    180                                                                                •   70 mm2 collimated to 50 mm2
55

                    160          25 mm2                                                                •   Windows: Be (0.5 mil) 12.5 μm, or C Series (Si3N4)
                              Standard SDD
                    140
                                     25 mm2 FAST SDD®                                                  •   TO-8 package fits all Amptek configurations
                    120
                          0                       10                    20                    30
                                                           Tpeak (μs)

                    Configurations to meet your needs

                    XR-100 and PX5 Digital Pulse Processor                               X-123 Complete X-Ray Spectrometer            XRF Experimenters Kit

                    OEM Configurations

                                     A sample of detectors with preamplifiers                                      Digital Pulse Processors and Power Supplies
                                                 and heat sinks

                                                           ®                                       For XRF

                                                                                            amptek.com
6 Spectroscopy 33(10)        Oc tober 2018                                                                                                    w w w. s p e c t r o s c o p y o n l i n e . c o m

                                                      CONTENTS
                                                                                                                                                            v 33 n  10
                                                                                                                                                                    o  2018
                                                  ®

                                                      COLUMNS

          Oc tober 2018
                                                                   Atomic Perspectives . . . . . . . . . . . . . . . . . . . . . . . 12
      Volume 33 Number 10
                                                      The Critical Role of Atomic Spectroscopy in Understanding
                                                      the Links Between Lead Toxicity and Human Disease
                                                      Robert Thomas
                                                      With analytical advances, the clinical practice threshold for lead has dropped from 60 to 5 μL/dL.

                                                                   Chemometrics in Spectroscopy . . . . . . . . . . . . . . . . . 22
                                                      Outliers, Part III: Dealing with Outliers
                                                      Howard Mark and Jerome Workman, Jr.
                                                      What are the steps to take once an outlier is discovered? There are several options.

                                                                   Lasers and Optics Interface . . . . . . . . . . . . . . . . . . . 26
                                                      Tunable Diode Lasers for Trace Gas Detection:
                                                      Methods, Developments, and Future Outlook
                                                      Steven G. Buckley
                                                      Tunable diode laser absorption spectroscopy is hitting the mainstream. Here, we look at the history of
                                                      the technique, the current state of the technology, and future challenges.

                                                                   Spectroscopy Spotlight
             Cover image courtesy of
               anidimi/AdobeStock.                    LIBS For Liquid Samples ............................................................................... 30
                                                      LIBS is normally used with solid samples. What does it take to apply it to liquids?

                                                      Manipulating Sound With Lasers and Optics ...................................................                                                   33
                                                      A tube-shaped laser beam that forms a thermal gradient can channel sound.

                                                      Imaging Malaria-Infected Red Blood Cells with AFM-IR .................................... 34
    ON TH E W E B                                     How atomic force microscopy-infrared spectroscopy can help diagnose disease.

     WEB SEMINARS
                                                      SPECIAL FEATURE
    Rethink Your Polymer Analysis
    for Increased Capacity and                        The 2018 Emerging Leader in Molecular Spectroscopy Award ...........................                                                            36
    Improved Quality
                                                      Nicole Olson
    Chris Greatwood, MGC Advanced Polymers,
    and Adam J. Hopkins, PhD, Metrohm USA             This year’s honoree, Megan Thielges, is a pioneer in the development of vibrational probes for use
                                                      with 2D IR spectroscopy, to reveal new information about the structures and dynamics of proteins.
    Tracking VOCs and Their Lifecycles
    in the Atmosphere with Modern
    Spectroscopic Technologies                        PEER-REVIEWED ARTICLE
    Daniel Stone, PhD, University of Leeds, and
    Peng Zou, PhD, Princeton Instruments
                                                      Quantitative Detection of Phenobarbital in an Injectable Solution
                                                      Based on Surface-Enhanced Raman Spectroscopy ........................................... 40
    Implementing Transmission Raman                   Lin Bao, Siqingaowa Han, Yaoye Xu, Hang Zhao, Dianyang Lin, and Wuliji Hasi
    for Fast Content Uniformity Testing—              This SERS method is rapid, accurate, nondestructive, and easy.
    from Feasibility Evaluation to a
    Validated Release Method
    Meike Römer, PhD, Grünenthal Pharma
                                                       DEPARTMENTS
    Discover How Triple Quadrupole ICP-MS              News Spectrum . . . . . . . . . . . . . . . . . . . . . . . . . . . . . . . . . . . . . . . . . . . . . . . . . . . . . . . . . . 10
    Will Help You Do More and Simplify
    Your Laboratory Routines
                                                       EAS Conference Preview . . . . . . . . . . . . . . . . . . . . . . . . . . . . . . . . . . . . . . . . . . . . . . . . . . 47
    Daniel Kutscher, PhD, and Simon Nelms,             Products & Resources . . . . . . . . . . . . . . . . . . . . . . . . . . . . . . . . . . . . . . . . . . . . . . . . . . . . . 49
    PhD, Thermo Fisher Scientific                       Calendar . . . . . . . . . . . . . . . . . . . . . . . . . . . . . . . . . . . . . . . . . . . . . . . . . . . . . . . . . . . . . . . . 51
    spectroscopyonline.com/webcasts                    Short Courses . . . . . . . . . . . . . . . . . . . . . . . . . . . . . . . . . . . . . . . . . . . . . . . . . . . . . . . . . . . 52
                                                       Ad Index . . . . . . . . . . . . . . . . . . . . . . . . . . . . . . . . . . . . . . . . . . . . . . . . . . . . . . . . . . . . . . . . 54
    Like Spectroscopy on Facebook:
    www.facebook.com/SpectroscopyMagazine              Spectroscopy (ISSN 0887-6703 [print], ISSN 1939-1900 [digital]) is published monthly by UBM LLC 131 West First Street, Duluth, MN 55802-
                                                       2065. Spectroscopy is distributed free of charge to users and specifiers of spectroscopic equipment in the United States. Spectroscopy is
    Follow Spectroscopy on Twitter:                    available on a paid subscription basis to nonqualified readers at the rate of: U.S. and possessions: 1 year (12 issues), $74.95; 2 years (24 issues),
    https://twitter.com/spectroscopyMag                $134.50. Canada/Mexico: 1 year, $95; 2 years, $150. International: 1 year (12 issues), $140; 2 years (24 issues), $250. Periodicals postage paid
                                                       at Duluth, MN 55806 and at additional mailing offices. POSTMASTER: Send address changes to Spectroscopy, P.O. Box 6196, Duluth, MN
    Join the Spectroscopy Group on LinkedIn            55806-6196. PUBLICATIONS MAIL AGREEMENT NO. 40612608, Return Undeliverable Canadian Addresses to: IMEX Global Solutions, P. O.
    http://linkd.in/SpecGroup                          Box 25542, London, ON N6C 6B2, CANADA. Canadian GST number: R-124213133RT001. Printed in the U.S.A.
Ethos UP UltraWAVE UltraCLAVE

8 Spectroscopy 33(10)   Oc tober 2018                                                                              w w w. s p e c t r o s c o p y o n l i n e . c o m

Editorial Advisory Board
Fran Adar Horiba Scientific                                               Rachael R. Ogorzalek Loo University of California Los Angeles,
                                                                          David Geffen School of Medicine
Russ Algar University of British Columbia
                                                                          Howard Mark Mark Electronics
Matthew J. Baker University of Strathclyde
                                                                          R.D. McDowall McDowall Consulting
Ramon M. Barnes University of Massachusetts
                                                                          Gary McGeorge Bristol-Myers Squibb
Matthieu Baudelet University of Central Florida
                                                                          Linda Baine McGown Rensselaer Polytechnic Institute
Rohit Bhargava University of Illinois at Urbana-Champaign
                                                                          Francis M. Mirabella Jr. Mirabella Practical Consulting Solutions, Inc.
Paul N. Bourassa Blue Moon Inc.
                                                                          Ellen V. Miseo Illuminate
Michael S. Bradley Thermo Fisher Scientific                               Michael L. Myrick University of South Carolina
Deborah Bradshaw Consultant                                               John W. Olesik The Ohio State University
Lora L. Brehm The Dow Chemical Company                                    Steven Ray State University of New York at Buffalo
George Chan Lawrence Berkeley National Laboratory                         Jim Rydzak Specere Consulting
John Cottle University of California Santa Barbara                        Jerome Workman Jr. Biotechnology Business Associates
                                                                          Lu Yang National Research Council Canada
David Lankin University of Illinois at Chicago,
College of Pharmacy
Barbara S. Larsen DuPont Central Research and Development                    Spectroscopy’s Editorial Advisory Board is a group of distinguished individuals
                                                                             assembled to help the publication fulfill its editorial mission to promote the effec-
                                                                             tive use of spectroscopic technology as a practical research and measurement tool.
Bernhard Lendl Vienna University of Technology (TU Wien)                     With recognized expertise in a wide range of technique and application areas, board
                                                                             members perform a range of functions, such as reviewing manuscripts, suggesting
Ian R. Lewis Kaiser Optical Systems                                          authors and topics for coverage, and providing the editor with general direction and
                                                                             feedback. We are indebted to these scientists for their contributions to the publica-
                                                                             tion and to the spectroscopy community as a whole.

              Next generation Raman imaging

              High performance Raman systems for a range of applications
              Raman spectroscopy produces chemical and structural images to help you understand more about the
              material being analysed. Renishaw has decades of experience developing flexible Raman systems that
              give reliable results, for even the most challenging measurements. With Renishaw’s suite of Raman
              systems, you can see the small things, the large things and things you didn’t even know were there.

              Visit www.renishaw.com/raman

              Renishaw Inc. 1001 Wesemann Drive, West Dundee, Illinois, 60118, United States
              T +1 847 286 9953 F +1 847 286 9974 E raman@renishaw.com
              www.renishaw.com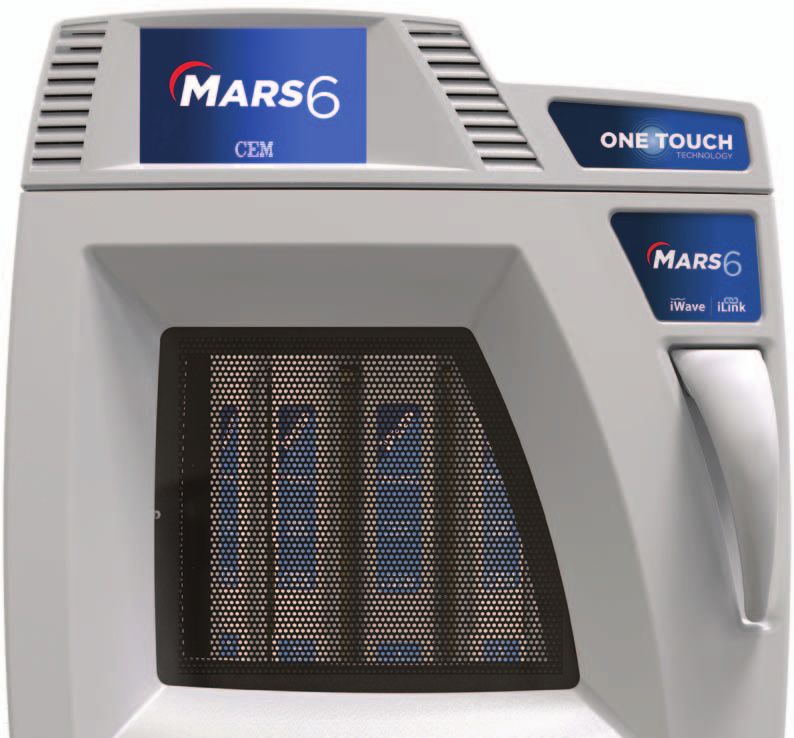
—
Trade in any FT-IR
laboratory spectrometer
Get a new MB3600 analyzer

ABB offers a trade-in program for any FT-IR laboratory spectrometer including
other brands. Send us your current laboratory analyzer and get ABB’s proven
MB3000 series FT-IR spectrometer, the most reliable on the market, at the lowest
cost of ownership. The program includes a significant discount for trading in your
analyzer and the method transfer performed by an ABB applications scientist.
Learn more at: abb.com/analytical or contact us at ftirsupport@ca.abb.com
Measurement made easy.

10 Spectroscopy 33(10)   Oc tober 2018                                                                    w w w. s p e c t r o s c o p y o n l i n e . c o m

News Spectrum
Call for Nominations: 2019 Emerging Leader                                and cleanroom spaces, including more than 6400 square
in Molecular Spectroscopy                                                 feet of applications laboratories designed to showcase the
                                                                          company’s product line, applications training capabilities,
Spectroscopy magazine is seeking nominations for the                      method development, and product demonstrations.
2019 Emerging Leader in Molecular Spectroscopy Award.                       Four laboratories on the new site are designed around
This award recognizes the achievements and aspirations of                 specific sciences: earth science, life science, materials
a talented young molecular spectroscopist who has made                    science, and industrial science. Each laboratory reportedly
strides early in his or her career toward the advancement                 specializes in the sample preparation, analysis, and data
of molecular spectroscopy techniques and applications.                    reporting appropriate for those techniques and their unique
The winner must be within 10 years of receiving his or her                requirements; each is equipped with core instruments
highest academic degree in the year the award is granted.                 from various product lines related to those techniques
Details can be found at http://www.spectroscopyonline.                    and measurements relevant to the application space. The
com/call-nominations-2019-emerging-leader-molecular-                      laboratories are used for sales demonstrations, training,
spectroscopy                                                              customer support, engineering validation, and basic research.
Horiba Scientific Celebrates New Facility                                 Training centers, adjacent to the laboratories, can be used for
Opening                                                                   customer training and service training for the global network
                                                                          of affiliates and distributors.
Horiba Scientific recently celebrated the official opening of               The move allows for the original equipment manufacturer
its new facility in Piscataway, New Jersey. Horiba executives,            (OEM) facility to be located in the same building as the
including Atsushi Horiba, the company’s chairman, and                     main office. The OEM facility has dedicated research and
leaders from industry and academia were in attendance. Also               development (R&D) and manufacturing space, including
joining the celebration were local celebrities State Senator              several cleanrooms to meet production requirements.
Bob Smith and Piscataway Mayor Brian Wahler.                                The tour concluded with instrument and poster
   The 132,000-square foot facility has an open office                    displays of the five Horiba segments (corporate, medical,
design that includes natural light, open communication                    semiconductor, automotive, process, and environmental)
spaces, informal work areas, and conference rooms for                     outside the lunchroom, followed by a buffet lunch and the
meetings and global video conferences. A tour of the facility             cutting of a ceremonial seven-layer cake representing the
highlighted office, engineering, manufacturing, laboratory,               color spectrum. ◾

                         MARKET PROFILE: HANDHELD SPECTROSCOPY

   The advancements of battery and com-            Environmental 8%                                    detection, plastics recycling, pharma-
   puting technologies have enabled ana-                                           Government and      ceuticals, and narcotics. Handheld
   lytical instruments to have smaller form   Other Industrial 10%                 Academia 17%        Raman spectrometers are used for raw
   factors that take them beyond portable                                            Pharmaceuticals   materials analysis, environmental, and
   and into the realm of being handheld.                                             and Biotechnology forensics applications.
   Handheld X-ray fluorescence (XRF),                                                 19%                   The total market for handheld spec-
   near-infrared (NIR) and infrared (IR),      Semiconductor,                                          troscopy accounted for approximately
                                               Electronics, and
   and Raman spectroscopy are the key          Metals 22%                          Chemicals 24%       $150 million in North America in 2017
   spectroscopy techniques available in                                                                and is forecasted to increase 8–10%
   portable and handheld formats that Portable and handheld spectroscopy market in North annually for the next few years, with XRF
   take analytical measurements beyond America.                                                        and Raman spectrometers represent-
   the laboratory and into the field.                                                                   ing about two thirds of the shipments.
        Like other portable and handheld devices, these spectrosco-      Industrial applications in the chemicals, plastics, and semiconduc-
   py instruments will have fewer capabilities and performance than      tor sectors are expected to drive growth for 2018. Life science ap-
   a laboratory instrument. Handheld instruments might be used for       plications represent a significant share of the market, particularly
   identification or qualitative analysis, or perhaps semi-quantitative   for Raman and NIR and IR instruments. Government and academic
   measurements. They are typically tuned for specific applications       laboratories account for about 17% of the market. The overall mar-
   to allow for an increased level of performance. Using these hand-     ket leader for handheld spectroscopy is Thermo Fisher Scientific,
   held devices is also simpler than using laboratory instruments; they  with its flagship Niton XRF analyzers. Other leading manufacturers
   usually have point-and-shoot or push-button operation, as well        include Bruker, Hitachi, Olympus, and Rigaku.
   as touchscreen displays. Another key characteristic of handheld           Market size and growth estimates were adopted from TDA’s
   spectroscopy devices, aside from portability, is that they do not re- Industry Data, a database of technology market profiles and bench-
   quire sample pretreatment, allowing for direct measurements.          marks, as well as the 2018 Instrument Industry Outlook (Midyear
        These handheld spectroscopy devices are now routinely used       Update) report from independent market research firm Top-Down
   in many industries. Handheld XRF instruments are used in the          Analytics (TDA). For more information, contact Glenn Cudiamat, gen-
   metals industry for recycling and sorting scrap materials, and can    eral manager, at (888) 953-5655 or glenn.cudiamat@tdaresearch.
   identify elements from magnesium to uranium. Portable and hand-       com. Glenn is a market research expert who has been covering the
   held NIR and IR devices have high utility in food quality, fungus     analytical instrumentation industry for more than two decades.
MARS 6
Better digestions.
Better analyses.
The best technologies for the best results.
iPrep™ iWave™ iLink® One Touch™
The world’s most Accurate, contactless Remote system It’s like having a
robust vessel temperature control operation chemist in a box
MARS 6™
cem.com/mars6
The leader in microwave digestion12 Spectroscopy 33(10) Oc tober 2018 w w w. s p e c t r o s c o p y o n l i n e . c o m
Atomic Perspectives
The Critical Role of Atomic
Spectroscopy in Understanding
the Links Between Lead Toxicity
and Human Disease
The development of analytical instrumentation over the past 50 years has allowed us not
only to detect trace metals at the parts per quadrillion (ppq) levels, but also to know the
oxidation state, biomolecular form, elemental species, and isotopic constituents. Here,
we look at how the development of atomic spectroscopy techniques has enabled a much
better understanding of the links between trace metal toxicity and human disease, and,
in particular, the role of lead in the health of young children.
Robert Thomas
U nderstanding the effects of trace metals on human
health is as complex as it is fascinating. Too low or
too high a concentration of essential trace elements
in our diet can affect our quality of life. On the other hand,
metallic contamination of the air, soil, and water can have a
nic that had been found, but organic arsenic that had been
metabolized by the apple tree to a less toxic form. Selenium,
which is found in many vegetables including garlic and on-
ions, has important antioxidant properties, but do we know
why some selenium compounds are essential, while others
dramatic impact on our well-being. There are many examples are toxic? Clearly these are all complex questions that have
that highlight both the negative and positive effects of trace to be answered to fully understand the role of trace elements
metals on our lives. For instance, the effect of lead toxicity, in the mechanisms of human diseases. Atomic spectroscopy
particularly on young children, is well documented, but is has an important role to play in answering these questions.
it possible to pinpoint the source of the lead poisoning? The The development of analytical instrumentation over the past
movie “Erin Brockovich” alarmed moviegoers about the dan- 50 years has allowed us not only to detect trace metals at the parts
gers of hexavalent chromium (Cr VI) in drinking water, but per quadrillion (ppq) levels, but also to know their oxidation state,
how many in the audience realized that trivalent chromium biomolecular form, elemental species, and isotopic constituents.
(CRIII) metal is necessary for the metabolism of carbohy- We take for granted all the powerful and automated analytical
drates and fats? Dr. Oz recently alarmed his viewers about tools we have at our disposal to carry out trace elemental studies
high levels of arsenic in apple juice, but what he failed to say on clinical, toxicological, and environmental samples. However,
was that it was not the highly toxic inorganic form of arse- it wasn’t always that way. As recently as the 1960s, the majority of1101 McKay Drive www.bayspec.com San Jose, California 95131 sales@bayspec.com U.S.A. (408) 512-5928
14 Spectroscopy 33(10) Oc tober 2018 w w w. s p e c t r o s c o p y o n l i n e . c o m
throughs in atomic spectroscopy have
directly impacted our understanding of
70 the way trace metals interact with the
60
human body. Let us now take a look at a
considered elevated by CDC
60
Blood lead levels (ug/dL)
specific examples where atomic spectros-
50 copy techniques have allowed us to delve
40 deeper into understanding the impact of
40 trace metal toxicity on our lives, focusing
30
30
specifically on lead (Pb).
25
20 Lead Poisoning
10 Lead has no known biological or phys-
10 iological purpose in the human body,
5
0
but is readily absorbed into the system
1960 1970 1980 1990 2000 2010 2020 by ingestion, inhalation, and, to a lesser
Year
extent, by skin absorption (2). Inorganic
lead in submicrometer-sized particles
Figure 1: The trend in blood lead levels (μg/dL) in children considered elevated by the Centers for in particular can be almost completely
Disease Control and Prevention (CDC), since the mid-1960s. absorbed through the respiratory tract,
and larger particles may be swallowed.
The extent and rate of absorption of lead
through the gastrointestinal tract depend
100 on characteristics of the individual and
Flame AA (~1962) on the nature of the medium ingested. It
10 has been shown that children can absorb
Graphite furnace AA with ZBGC 40–50% of an oral dose of water-soluble
Lead detection limits (ppb)
1 and the STPF concept (~1980) lead compared to only 3–10% for adults
(3). Young children and toddlers are
0.1 particularly susceptible because of their
ICP–MS
Delves cup (~1983) playing and eating habits, and because
0.01 (~1969)
Electrothermal ICP–MS they typically have more hand-to-mouth
atomization (~2012) activity than adults (4). Lead is absorbed
0.001 (~1970) more easily if there is a calcium or iron
0.0001
deficiency, or if the child has a high fat,
inadequate mineral, or low protein diet.
0.00001 When absorbed, lead is distributed in the
1960 Year 2010 body in three main areas: bones, blood,
and soft tissue. About 90% is distributed
Figure 2: Comparison of detection capability (ppb) of atomic spectroscopy techniques used to in the bones, while the majority of the
monitor blood lead and the approximate year they were developed or improved. rest gets absorbed into the bloodstream,
where it gets taken up by porphyrin mol-
trace elemental determinations were pre- technique that could be automated. Every ecules (complex nitrogen-containing
dominantly carried out by traditional wet time a major development was made in organic compounds providing the foun-
chemical methods like volumetric-, grav- atomic spectroscopy, beginning with dation structure for hemoglobin) in the
imetric-, or colorimetric-based assays. In flame atomic emission (FAE) and flame red blood cells (5). It is, therefore, clear
fact, the pharmaceutical industry has been atomic absorption (FAA) in the early that the repercussions and health risks
using a sulfide precipitation colorimetric 1960s, electrothermal atomization (ETA) are potentially enormous if children are
test for the measurement of lead and other or graphite furnace atomic absorption exposed to abnormally high levels of lead.
heavy metals for more than 100 years; that (GFAA) in the early 1970s, inductively
method was only replaced in the United coupled plasma–optical emission spec- The Impact of Lead
States Pharmacopeia (USP) in January trometry (ICP-OES) in the late 1970s, Toxicity on Children
2018 by a plasma spectrochemical test (1). and inductively coupled plasma–mass The toxic effects of lead have recently
It wasn’t until the development of spectrometry (ICP-MS) in the early been exemplified by the drinking water
atomic spectroscopic techniques in the 1980s, trace element detection capabil- crisis in Flint, Michigan, where public
early to mid-1960s that the clinical an- ity, sample throughput, and automa- health officials and water authority
alytical community realized they had a tion dramatically improved. There is no personnel failed to take remedial ac-
highly sensitive and diverse trace element question that developments and break- tion when they replaced Lake Michi-I N T E R N A T I O N A L C E N T R E F O R D I F F R A C T I O N D A T A
Introducing the 2019 Powder Diffraction File™
Diffraction Data You Can Trust
ICDD databases are the only crystallographic databases in the world
with quality marks and quality review processes that are ISO certified.
PDF-4/Organics
Solve Difficult Problems, Get Better Results
535,600+
Entries
115,500+
Atomic
Combines coordinates SIeve+,
Crystalline, Search Indexing
Semicrystalline, Software,
and Amorphous Included as
Solid State an Added
Materials Value
Targeted Molecular
Collection for Graphics and
Commercial & Digitized
Regulatory Patterns
Fields
Improve Your Analysis with the Most Comprehensive
Inorganic and Organic Databases for Powder Diffraction!
Take Advantage of ICDD’s New Combo Site License
for PDF-4+ and PDF-4/Organics
www.icdd.com
ISO
9001:2015
www.icdd.com | marketing@icdd.com
BY DEKRA
ICDD, the ICDD logo and PDF are registered in the U.S. Patent and Trademark Office.
CERT. NO.
110409.01
Powder Diffraction File is a trademark of JCPDS – International Centre for Diffraction Data
©2018 JCPDS–International Centre for Diffraction Data – 10/1816 Spectroscopy 33(10) Oc tober 2018 w w w. s p e c t r o s c o p y o n l i n e . c o m
ters for Disease Control and Prevention
(CDC), recently reported that at least
1000 four million households have children
FAA 60 Level regulated by the CDC living in them who are being exposed to
100 40
60 30 25 high levels of lead from a combination
Blood lead level (ug/dL)
10
of old lead paint and lead water pipes.
10
ETA 5 As a result, there are approximately half
Delves cup ZBGC a million U.S. children 1–5 years of age
1
with blood lead levels (BLL) in excess
0.1 of 5 micrograms per deciliter (μg/dL),
ICP–MS (1991) the level at which CDC recommends
ICP–MS (1985)
0.01 remedial actions be taken (6).
Lead poisoning affects virtually
0.001 Method limits of detection every system in the body, and often
ICP–MS (2012) occurs with no distinctive symptoms.
0.0001
It can damage the central nervous
0.00001 system, kidneys, and reproductive
1960 Year 2010 system and, at higher levels, can cause
coma, convulsions, and even death.
Figure 3: The improvement in real-world method detection capability (in μg/dL) offered by Even low levels of lead are harmful
atomic spectroscopy techniques for blood-lead determinations compared to the trend in blood- and are associated with lower intel-
lead levels regulated by the Centers for Disease Control and Prevention (CDC). ligence, reduced brain development,
decreased growth and impaired hear-
ing (7). The level of lead in a person’s
system is confirmed by a blood-lead
test, and by today’s standards a blood
lead level is considered elevated if it
is in excess of 5 μg/dL (50 ppb) for
children (8). However, the long-term
208
Pb: 52.4% effects of lead poisoning have not
always been well understood. In the
early and mid-1960s, remedial action
would be taken if a blood lead level
(or clinical practice threshold level, as
it was known then) was in excess of
206
Pb: 24.1% 60 μg/dL. As investigators discovered
more sensitive detection systems and
designed better studies, the generally
207
Pb: 22.1% recognized level for lead toxicity has
progressively shifted downward. In
1970, it was lowered to 40 μg/dL and,
204
Pb: 1.4% by 1978, the level had been reduced to
30 μg/dL. In 1985, the CDC published
a threshold level of 25 μg/dL, which
they eventually lowered to 10 μg/dL in
1991. It stayed at this level until it was
reduced to 5 μg/dL in 2012. However,
as our understanding of disease im-
204 205 206 207 208 proves and measurement technology
Atomic mass units gets more refined, this level could be
pushed even lower in the future (9).
Figure 4: Mass spectrum of the four lead isotopes at 204, 206, 207, and 208 atomic mass units Figure 1 shows the trend in blood lead
(amu), with their respective natural abundances. levels considered elevated by the Cen-
ters for Disease Control (CDC), since
gan with the Flint River as the source and high levels of lead in the drinking the mid-1960s.
of the city’s drinking water, a change water supply. This particular problem Note that the term blood lead reference
that resulted in corrosion of lead pipes is still being investigated, but the Cen- value (BLRV) has been used more recentlyw w w. s p e c t r o s c o p y o n l i n e . c o m Oc tober 2018 Spectroscopy 33(10) 17
®
Graphite sealing probe
Internal Internal
FUSION FLUXER
gas gas
External gas
Sampling
valve
Graphite
Carrier tube
ICP–MS gas
(a) ETV
Internal Internal
gas gas
External gas
Sampling
valve
Carrier
gas
It’s time
to switch
from gas
(b) ICP–MS ETV
Figure 5: Schematic of ICP-MS coupled with an the electrothermal vaporization sampling
accessory (ETV-ICP–MS), showing the two distinct stages: (a) prevaporization to drive off the
matrix components and (b) vaporization to sweep the analyte vapor into the ICP–MS instrument
for analysis. Adapted with permission from reference 22.
to electric.
(since 2012), and refers specifically to the Current ly, t he major source of VERSATILE. COMPACT. SAFE.
97.5th percentile of blood lead levels for le ad p oi s on i ng a mong ch i ld ren The X-300 is an automated electric
children 1–5 years old in the United States, comes from lead-based household fusion fluxer capable of producing
ca lcu lated f rom blood lead tests paints, which were used until they fused beads (glass disks) for XRF
performed in the National Health were banned in the United States and solutions for ICP/AA analysis. It
a nd Nut rit ion Exa minat ion Sur- in 1978 by the Consumer Product comes pre-loaded with customizable
vey (NHANES). The BLRV is not a Safety Commission. Prior to that fusion programs for your particular
health-based toxicity threshold, nor date, leaded gasoline was the largest protocol, and is available with one,
does it define what level is consid- pollutant, before it was completely two or three positions.
ered normal. It is intended to help removed from the pumps in 1995.
identify the highest risk childhood O t her potent ia l sou rces i nclude BENEFITS OF ELECTRIC.
populations and geographic areas. lead pipes used in drinking water • SAFETY
It is also important to point out systems, airborne lead from smelt- • TEMPERATURE CONTROL
that these thresholds were not all ers, and clay pots, pottery glazes, • POWER CONSUMPTION
determined the same way. Only in lead batteries, and household dust. • SIMPLICITY
2012 (when the recognized level for However, awareness of the problem, • UNAFFECTED BY ALTITUDE
lead toxicity was lowered to 5 μg/dL) combined with preventative care and Contact us to discuss.
was the population-based threshold regular monitoring, have reduced the
called the BLRV and calculated from percentage of children aged 1–5 years
population statistics. Although all with elevated blood levels (≥5 μg/dL)
these levels could be said to describe in the US from 26% in the early-mid
thresholds of elevated blood lead lev- 1990s to less than 2% in 2014. These
els generally, even the term elevated data were taken from a recent Na- WWW.SPEXSAMPLEPREP.COM/KATANAX
blood lead level wasn’t specifically tional Health and Nutrition Examina- SAMPLEPREP@SPEX.COM • 1-855-GET-SPEX
defined in CDC policy until 1978. tion Survey (NHANES) report (10).18 Spectroscopy 33(10) Oc tober 2018 w w w. s p e c t r o s c o p y o n l i n e . c o m
has been used. When sample prepara-
tion was factored into the equation, a
blood lead level of 600 ppb was reduced
to 10–20 ppb, virtually the same as the
FAA instrumental detection limit.
Delves Cup
To get around this limitation, an accessory
called the Delves Cup was developed in the
late 1960s to improve the detection limit of
Primeval lead value FAA (12). The Delves Cup approach uses a
Blood metal crucible or boat, usually made from
nickel or tantalum, which was positioned
over the flame. The sample, typically
Pb:204Pb
0.1–1.0 mL, is pipetted into the cup, where
the heated sample vapor is passed into a
207
Cookware quartz tube, which is also heated by the
flame. The ground state atoms generated
from the heated vapor are concentrated
Gasoline in the tube, and therefore resident in the
optical path for a longer period of time,
resulting in much higher sensitivity and
about 100x lower detection limits. The
Delves Cup became the standard method
for carrying out blood lead determinations
for many years, because of its relative sim-
plicity and low cost of operation.
Unfortunately, the Delves Cup ap-
proach was found to be very operator
206
Pb:204Pb dependent, not very reproducible (be-
cause of manual pipetting), and required
Figure 6: A plot of the ratio of 206Pb:204Pb, against the ratio of 207Pb:204Pb for blood (•), cookware calibration with blood matrix standards
(o), and gasoline (•) samples, showing the theoretical (primeval) lead line. Adapted with (13). The technique became less attractive
permission from reference 21. when electrothermal atomization (ETA)
was commercialized in the early 1970s.
Routine Monitoring of Lead Using atomic absorption was first commer- This new approach offered a detection
Atomic Spectroscopic Techniques cialized in the early 1960s. capability for lead of ~ 0.1 ppb, approxi-
There is no question that the rou- mately 200x better than FAA. However,
tine monitoring of children has had Flame Atomic Absorption (FAA) its major benefit for the analysis of blood
a huge impact in reducing the num- When flame atomic absorption (FAA) samples was the ability to dilute and inject
ber of children with elevated blood was first developed, the elevated blood the sample automatically into the graphite
levels. Lead assays were initially car- lead level was set at 60 μg/dL. Even tube with very little off-line sample prepa-
ried out using the dithizone colori- though this level is equivalent to 600 ration. In addition, because the majority of
metric method, which was sensitive parts per billion (ppb) of lead, which the matrix components were “driven-off”
enough, but very slow and labor in- was well above the FAA detection limit prior to atomization at ~3000 °C, interfer-
tensive. The method became a little of ~20 ppb at the time, FAA struggled ences were generally less than the Delves
more automated when anodic strip- to accurately detect lead at these levels Cup, which only reached the temperature
ping voltammetr y was developed when sample preparation was taken into of the air or acetylene flame at ~2000 °C.
(11), but blood-lead analysis was not consideration. The preparation of blood This breakthrough meant that blood lead
considered a truly routine method samples typically involved either dilution determinations, even at extremely low lev-
until atomic spectroscopy techniques with a weak acid followed by centrifuging els, could now be carried out in an auto-
became available. Let’s take a more or filtering, or acid digestion followed by mated fashion with relative ease.
detailed look at how improvements dilution and either centrifuging or fil-
in atomic spectroscopy instrumenta- tering. More recently, dilution with a Zeeman Correction
tion detection capability have helped strong base like tetramethylammonium The next major milestone in AA was the
to lower the number of children with hydroxide (TMAH) and the addition of a development of Zeeman background
elevated blood lead levels, si nce surfactant to allow for easier aspiration correction (ZBGC) in 1981, which com-w w w. s p e c t r o s c o p y o n l i n e . c o m Oc tober 2018 Spectroscopy 33(10) 19
pensated for non-specific absorption Method or Procedural
and structured background produced by Limits of Detection
complex biological matrices, like blood Figure 3 is a combination of Figures 1 ANY WHERE
ANY TIME,
and urine. ZBGC, in conjunction with and 2, and shows improvement in the
the stabilized temperature platform fur- blood lead method detection limit (now
nace (STPF) concept, allowed for virtu- in μg/dL and not ppb) offered by atomic
ally interference-free graphite furnace
analysis of blood samples using aqueous
spectroscopy techniques compared to
the trend in blood lead levels set by the
ANALYZE
calibrations (14). Such was the success CDC. To make the comparison more MATERIALS
WITH TSI
of the ZBGC–STPF approach, due pri- valid, a factor of 100x has been applied to
marily to the fact that it could be used to the instrumental detection limits to give
analyze many different kinds of samples an approximation of the achievable “real
using simple aqueous standards, that it world” method detection limit in a blood
became the recognized way of analyzing sample matrix. Both plots are shown in
most types of complex matrices by ETA. log scale, so they can be viewed on the
Even though ETA had been the ac- same graph. The main purpose of these
cepted way of doing blood lead deter- data is to show how the blood lead levels
minations for more than 15 years, the considered by the CDC as “elevated” over
commercialization of quadrupole-based the past 50 years have dropped as method
ICP–MS in 1983 gave analysts a tool that detection limits of the various atomic
was not only 100x more sensitive, but spectroscopy techniques have been low-
suffered from less severe matrix-induced ered, thus giving researchers more confi-
interferences than ETA. In addition, dence in the integrity of their data.
ICP–MS offered multielement capabil- It should also be emphasized that TSI Laser-Induced
Breakdown Spectroscopy
ity and much higher sample throughput. a degradation factor of 50–100x is + LIBS Handheld ChemLite® Analyzer
These features made ICP–MS very at- quite normal when converting an — Handheld point-and-shoot
tractive to the clinical community, such IDL to an MDL, when characteriz- analyzers
that many labs converted to ICP–MS as ing samples by atomic spectroscopy — Store and download spectra
— Onboard calibrations for
their main technique for trace element techniques. However, when analyz- Al, Mg, Ti, Ni, Fe, and Cu
analysis. Then, as the technique ma- ing a very complex biological matrix + LIBS ChemReveal® Benchtop
tured, using advanced mass separation like blood by ICP-MS, there are many Elemental Analysis Instruments
devices, performance enhancing tools, different ways of calculating LODs + ChemLine™ Online Process Sensor
powerful interference reduction tech- to encompass the entire analytical
niques, and more-flexible sampling ac- procedure. One common approach to
cessories, detection limits in real-word determine the PLOD is to carry out
samples improved dramatically for some 20 runs and plot standard deviation
elements. Figure 2 shows the improve- of the standards and spiked matrix
ment in detection capability (in ppb) of versus concentration, extrapolating
ICP-MS compared to ETA and the other the regression line to the ordinate
atomic spectroscopy techniques. axis, to determine the standard de-
It should also be emphasized that viation at zero concentration (15). In
the detection limits shown in Fig- a high throughput laboratory, this
ure 2 are instrument detection limits approach might not be realistic, be- TSI Raman Spectroscopy
(IDLs), which are based on simplistic cause of the additional time taken. + Portable Raman Instruments
calculations of aqueous blanks carried The time involved can be somewhat — Lab-grade measurements
in the field
out by manufacturers, and not realis- shortened by taking fewer readings, — Most sensitive portable Raman
tic method detection limit (MDL) or but doing so will clearly negatively + Benchtop Raman Spectrometers
procedural limits of detection (PLOD) impact the statistical data and de- + Handheld Raman Analyzers
that take into consideration the sample tection limit. Whichever approach is
preparation procedure, dilution steps, used, one should take into account
and multiple analytical measurements. variability in sample preparation,
IDLs are also only intended to be used environmental contamination, sol- www.tsi.com
as a guideline for comparison purposes vents, and reagents, as well as minor
because there are so many different sampling errors from dilution or pi-
ways of assessing detection capability, petting over many runs, all of which
based on variations in manufacturer, can cause variability from day to day.
instrument design, and methodology. Given such variability, a real-world20 Spectroscopy 33(10) Oc tober 2018 w w w. s p e c t r o s c o p y o n l i n e . c o m
procedural LOD for Pb in blood is to match lead isotope ratios in some- ference from matrix components (22).
often three orders of magnitude worse one’s blood to a particular environ- An additional benefit with regard to
than the instrument detection limit, mental source of lead contamination. taking blood samples is that typically
and is typically around 0.01–0.07 μg/ However, there are known, well-un- only a 20–50 μL aliquot is required for
dL, depending on the type of ICP–MS derstood limitations of this approach. analysis. Figure 5 represents a sche-
technology and interference reduc- For lead fingerprinting to be useful, matic of how the ETV–ICP–MS system
tion technique used (9,16). potential sources of lead exposure works, showing the two distinct steps:
must be limited in number and scope prevaporization to drive off the matrix
Identifying Sources of Lead and the lead sources must be isotopi- components, and vaporization to sweep
Using Isotopic Fingerprinting cally distinct. If more than two sources the analyte vapor into the ICP–MS for
An added benefit of the ICP-MS tech- of environmental lead are likely, such analysis.
nique is that it also offers isotopic as from water pipes, gasoline, smelter, In the Mexican study, ETV-ICP-MS
measurement capability. This feature paint, pottery, and glazes, then mixed was then used to determine the lead
is very attractive to many clinical lab- or combined isotope ratios will occur isotope ratios of 208Pb, 207Pb, and 206Pb
oratories, because it gives them the and, as a result, no useful data will be to that of 204Pb in blood samples from
ability to carry out isotope tracer obtained. In addition, if someone has a group of residents. These ratios were
(17), isotope dilution (18) and isotope chronic exposure to extremely high then compared with the two likely
ratio (19) measurements, which are lead levels, the person might have brit- sources of lead contamination from the
beyond the realms of other atomic tle or broken bones, and accumulated cooking pots and the gasoline samples.
spectroscopy techniques. In fact, lead in the bones would be released into Figure 6 shows a subset of data taken
the isotopic measurement capabil- the bloodstream, which could shift the from the study. It shows a plot of the
206
ity allows researchers to get a better lead equilibrium. This release of lead Pb: 204Pb ratio against the 207Pb:204Pb
understanding of the source of lead from the bones could elevate blood lead ratio for the blood, cookware, and
poisoning by measuring the isotope levels, independent of the source of the gasoline samples. It can be seen from
ratio of blood-lead samples and com- lead exposure or contamination. this plot that the data for the blood
paring them with possible sources of and cookware are grouped very tightly
lead contamination. The principal Mexican Study together around the theoretical value
behind this approach, known as iso- A good example of using isotope ratios of the ratios (known as the primeval
topic fingerprinting, is based on the to pinpoint the source of lead poisoning lead value), while the gasoline data are
fact that lead is composed of four that worked extremely well involved a grouped together on their own.
naturally occurring isotopes: 204 Pb, study carried out on a group of people Based on principal component anal-
206
Pb, 207 Pb, and 208 Pb, all with the living in a small village near Mexico ysis of the data, this result confirms
same atomic number, but with dif- City (21). A number of the residents that the lead isotope ratios of the blood
ferent atomic masses. Thus, when had abnormally high levels of lead in and cooking pots are almost identical,
naturally occurring lead is ionized their blood, which came from one of and are very close in composition to
in the plasma, it generates four ions, two likely sources: the use of leaded primeval lead, with very little addition
all with different atomic masses. Fig- gasoline, which had contaminated the of radiogenic lead (produced from ra-
ure 4 shows a mass spectrum of the soil, or glazed ceramic pots, which dioactive decay). On the other hand,
four lead isotopes 204 Pb, 206 Pb, 207 Pb, were used for cooking and eating pur- the alkyl lead compounds used in the
and 208Pb, together with their relative poses, or both. For this experiment, production of leaded gasoline are from
natural abundances of 1.4%, 24.1%, the lead isotope ratios were measured a different source of lead and as a result
22.1% and 52.4%, respectively. using an electrothermal vaporization generate a very different isotopic signa-
A l l t he lead isotopes, w it h t he (ETV) sampling accessory coupled to ture. These data showed very convincing
exception of 204 Pb, are products of an ICP-MS instrument. In this sample evidence that the residents of this small
radioactive decay of either uranium device, a heated graphite tube, sim- Mexican village were getting poisoned
or thorium, the abundance of which ilar to the type used in ETA, is used by the glazed clay pots they were using
will vary slightly depending on the to thermally pretreat the sample. But for cooking and eating, and not from
rock type and geological area. This instead of using the tube to produce contamination of the environment by
means that in all lead-based materi- ground state atoms, its main function leaded gasoline, as was first suspected.
als and systems, 204 Pb has essentially is to drive off the bulk of the matrix be-
remained unchanged at 1.4%, since fore the analytes are vaporized into the Conclusions
the earth was first formed (20). The plasma for ionization and measurement There is no question that developments
ratios of the isotopic concentrations by the mass spectrometer. The major in atomic spectroscopy have helped us
of 208 Pb, 207 Pb, and 206 Pb to that of benefit of ETV-ICP-MS for this applica- better understand the toxicity effects
204
Pb will therefore vary, depending tion is that complex matrices like blood, of lead over the past 50 years. Atomic
on the source of lead. This funda- gasoline, and pottery or clay material spectroscopy advances have allowed us
mental principle can be then be used can be analyzed with very little inter- to lower the clinical practice thresholdw w w. s p e c t r o s c o p y o n l i n e . c o m Oc tober 2018 Spectroscopy 33(10) 21 level of 60 μL/dL in the mid-1960s to ht tps://w w w.cdc .gov/nceh/lead/ lon, C.D. Quarles Jr., K.L. Caldwell, the current blood lead reference value publications/books/plpyc/contents. and R.L . Jones, Talanta 162, 114– (BLRV) of 5 μL/dL. More importantly, htm. 122 (2017), https://w w w.science- these techniques have helped to reduce (5) H. L. Needham, Case Studies in En- d i r e c t . c o m /s c i e n c e /a r t i c l e /p i i / elevated blood levels of children in the vironmental Medicine-Lead Toxicity, S0039914016307305. United States from 26% in the early to U. S. Dept. of Health and Human (17) B .T.G . T ing and M . Jang hor bani , mid-1990s to less than 2% in 2014, Services (1990). Anal. Chem. 58, 1334 (1986). as well as allowing us to get a much (6) Preventing Lead Poisoning in Young (18) J.W. McLaren, D. Beauchemin, and better understanding of the environ- Children, Lead Information Page, S.S. Berman, Anal. Chem. 59, 610 mental sources of lead contamination. Center s for Disease Control and (1987). However, such is the power and versa- Prevention (CDC), https://www.cdc. (19) W.I. Manton, J. Toxicology 36, 7, 705 tility of modern atomic spectroscopy gov/nceh/lead/default.htm. (1998). instrumentation and its accessories, (7) Childhood Blood Lead Levels in Chil- (20) R.D. Russell and R.M. Farquhar, Lead that it has also dramatically improved dren Aged
22 Spectroscopy 33(10)   Oc tober 2018                                                           w w w. s p e c t r o s c o p y o n l i n e . c o m

Chemometrics in Spectroscopy
Outliers, Part III:
Dealing with Outliers
This column is the continuation of our previous installments dealing with the question of outliers.
Here we consider what to do about an outlier, once one is detected.

Howard Mark and Jerome Workman Jr.

Y      ou have developed a set of data and have a reading
       that is suspected to be an outlier. You have applied
       one or more of the tests described in our previous
column (1) and confirmed that the reading is, indeed, an
outlier. Now what do you do?
                                                                   effect has created the discordancy in the values. An out-
                                                                   lier can be an indicator of a scientific accident, of the sort
                                                                   that has led to discoveries such as quinine, the smallpox
                                                                   vaccine, X-rays, insulin, penicillin, Teflon, and the cosmic
                                                                   microwave background (2-4) (Don’t hold your breath for
   There are three actions you might consider taking:              this, but it does happen!). After all, to a lesser degree, we
• Delete the discordant reading                                    saw previously (5) that the presence of a set of outliers that
• Transform the data                                               persisted through changes of data transformations and other
• Accommodate the discordant reading.                              manipulations of the data was indicative of a previously un-
   These possible actions could be considered the statistical      suspected systematic effect influencing the data. The dis-
approaches to dealing with the outlier. Other approaches can       covery of this effect gave us much information about the
also be considered, and, depending on the circumstances,           meaning of calibration transferability, and how to achieve it.
might be preferred. For example, if the outlier arises when             General scientific principles come into play here. Is the
calibrating a spectrometer for quantitative analysis (using        effect reproducible? Can it be created or avoided at will? Does
chemometrics, of course, which is the default activity for all     it lead to predictions of new phenomena? Is there a causal link
our columns), then the origin of the outlier could be either       between the discordant data and fundamental physics, chem-
in the reference laboratory values or among the instrumental       istry, biology, or math? Can you do a controlled experiment (or
values. In either case, an alternative (nonstatistical) approach   more generally, what is sometimes loosely called a statistical
would be to identify the source of the discordant value (in-       experimental design)? Is there a theory (from another science,
strument or laboratory), and then engage in investigation of       such as chemistry, physics, biology) that can explain the find-
the chemistry, physics, and background of the readings to          ings? Do other scientists get similar results, or at least have you
find the fundamental cause. In a pharmaceutical context,           had someone check your work? Here we will avoid departing
for example, this is what would be called root cause analysis.     from our mission of describing the chemometric and statistical
   A variant of this approach is to concentrate all of one’s       effects on the data, and so we will not pursue those other topics.
attention on just the outliers and ignore the rest of the data,    However, the reader should keep these alternate considerations
with a view toward learning some new fundamental sci-              in mind; after all, not everything has a statistical explanation!
ence, the rationale being that some new and unexpected             We will now consider the possibilities listed earlier.
You can also read