Quarterly Board Meeting - March 25, 2021
←
→
Page content transcription
If your browser does not render page correctly, please read the page content below
Quarterly Board
Meeting
March 25, 2021
Report of Interim Action

Report of the Committees

New Business

A. Consent Agenda
   1. Review and Approve Revisions to
      TBR Policy 2.03.00.00 – Admission
      at the Community Colleges
   2. Review and Consider 2020-21
      Faculty Emeritus
      Recommendations for Community
      Colleges
B. Informational Reporting
   1. External Affairs Update
      •   Legislative Update
   2. State Budget Update
   3. Center for Workforce Development
      Update
   4. Strategic Plan Update
   5. Student Success, Retention and
      Success
External Affairs Update
Dr. Kim McCormick

Mid-Session Legislative Update 2021

      Regent Mark George                                Regent Nisha Powers

Confirmation of two new Regents from West Tennessee:
Senate Resolution 17 – confirms Mark George as West Tennessee’s At-Large Regent
Senate Resolution 18 – confirms Nisha Powers as the 8th Congressional District’s Regent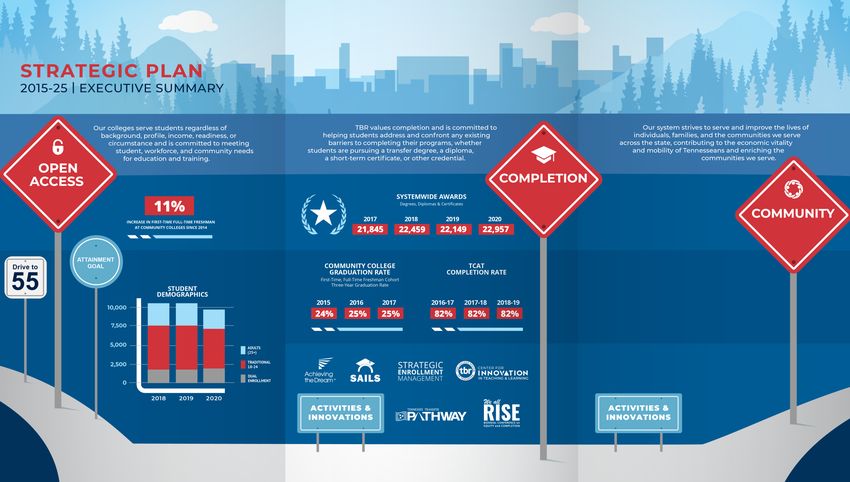
Mid-Session Legislative Update 2021
Issues Arising and Amplified by the COVID-19 Pandemic:

• Vaccinations
• Economic support for individuals affected directly by the disease
  and/or economically affected by workplace closures and shifts in
  commerce
• Minimum wage increase proposals
• Emergency powers of the executive branch – local, state, and federal
Mid-Session Legislative Update 2021
Functions and Authority of State Government:
• Emergency powers of the executive branch – checks and balances with the
  General Assembly
• Uniform Administrative Procedures Act (UAPA) bills
• Naming of public facilities - SB0111/HB1281
• “Transparency in Foreign Investment Act” – SB1191/HB1238

Monitoring of Firearms Legislation:
SB0765/HB0786
Governor Lee’s permitless carry legislation enhances individuals’ ability to carry a
firearm under certain circumstances and increases penalties on theft of firearms
and other gun-related crime.
Mid-Session Legislative Update 2021

Enhanced Funding for High School EPSOs:

Multiple bills have been filed to strengthen Early Postsecondary Opportunities
      -increase Middle College Scholarship amounts
      -increase Dual Enrollment Grant funding
      -fully fund four Dual Enrollment courses
Mid-Session Legislative Update 2021
Items on the Recent Lottery Calendar discussed in the
House Higher Education Subcommittee:
• HB0139/SB0722 – Establishes a “foster care youth outreach liaison” pilot
program at 5 higher education institutions.
• HB1150/SB1173 – Makes revisions to the Helping Heroes Act of 2008.
• HB0646/SB0458 – Clarifies financial aid eligibility for homeschool
students.
• HB0542/SB0009 – Increases the Middle College Scholarship to $1,250
per semester.
• HB0471/SB1157 – Declares William R. Moore Technical College as
eligible to receive Dual Enrollment Grants.
• HB0711/SB0446 – Extends HOPE scholarship eligibility to students of
Western Governors University.
• HB0752/SB0482 – Fully funds 4 Dual Enrollment courses for eligible high
school students.External Affairs Update Dr. Kim McCormick
Overview of State Budget Recommendations for
     Tennessee Board of Regents System
Current Status of Proposed State
Budget
• State Budget Introduced - February 8, 2021
• TBR Budget Hearings Conducted
House Finance, Ways, & Means Committee
Senate Education Committee
• Appropriations Bill Amendment Cut-Off Date
House: March 15th
Senate: April 1stRecommended Changes in TBR State
Appropriations: FY 2021-22 (Recurring)
Recurring Items
Outcomes
Formula Competency- Correctional
Adjustments Outcomes Salary Increase based Edu. Edu Invest Total Recurring
Community Colleges 3,733,500 9,300,000 10,500,000 400,000 - 23,933,500
TCATS (757,000) 2,300,000 2,400,000 - - 3,943,000
Subtotal Academic Units $ 2,976,500 $ 11,600,000 $ 12,900,000 $ 400,000 $ - $ 27,876,500
Central Office $ - $ - $ 652,400 $ - $ 222,000 874,400
Access & Diversity - - - - - -
Subtotal Other $ - $ - $ 652,400 $ - $ 222,000 $ 874,400
Grand Total $ 2,976,500 $ 11,600,000 $ 13,552,400 $ 400,000 $ 222,000 $ 28,750,900Recommended Changes in TBR State
Appropriations: FY 2021-22 (Non-recurring)
Non-Recurring Items
Competency- Morristown Correctional
based Edu. Building Equip Edu Invest Total Non Rec.
Community Colleges 350,000 - - 350,000
TCATS - 3,630,000 - 3,630,000
Subtotal Academic Units $ 350,000 $ 3,630,000 $ - $ 3,980,000
Central Office $ - $ - $ 650,000 650,000
Access & Diversity - - - -
Subtotal Other $ - $ - $ 650,000 $ 650,000
Grand Total $ 350,000 $ 3,630,000 $ 650,000 $ 4,630,000Recommended Changes in TBR State
Appropriations: FY 2021-22
Recurring Non-recurring Grand Total
Community Colleges 23,933,500 350,000 $ 24,283,500
TCATS 3,943,000 3,630,000 $ 7,573,000
Subtotal Academic Units $ 27,876,500 $ 3,980,000 $ 31,856,500
Central Office $ 874,400 650,000 $ 1,524,400
Access & Diversity - - $ -
Subtotal Other $ 874,400 $ 650,000 $ 1,524,400
Grand Total $ 28,750,900 $ 4,630,000 $ 33,380,900
Note: THEC received $11.5 million to expand the Governor’s Investment in Vocational Education
(GIVE) initiative.State Appropriation Recommendations for
Operating Purposes: FY 2021-22
350,000,000
300,000,000
250,000,000
200,000,000
150,000,000
100,000,000
50,000,000
-
Administration Access/Diversity TCATs Colleges
2020-21 New FundsCapital Outlay & Maintenance
Recommendations
State Cash & Non-State
Bonds Matching Funds Total
Maintenance $ 30,800,000 $ - $ 30,800,000
Capital Outlay
COSCC Williamson Co. Arts & Technology $ 26,980,000 $ 950,000 $ 27,930,000
Grand Total - TBR $ 57,780,000 $ 950,000 $ 58,730,000
Note: The COSCC building will also house TCAT Dickson programs.Upcoming Budget Events • Administration Amendment Introduction – Estimated first full week of April • Action by Senate and House Finance Committees – Est. mid-April • Action by full House & Senate – Est. late April • Transmitted to Governor – Est. mid-May • Acted on by Governor – Est. Late May
End
Center for Workforce Development Update
Center for Workforce Development Update

• Update on State ECD projects

• Update on the April TNTrained Virtual Conference
•Apprenticeships

•Correctional Workforce Training
 Programs
•Electric Vehicle Task Force
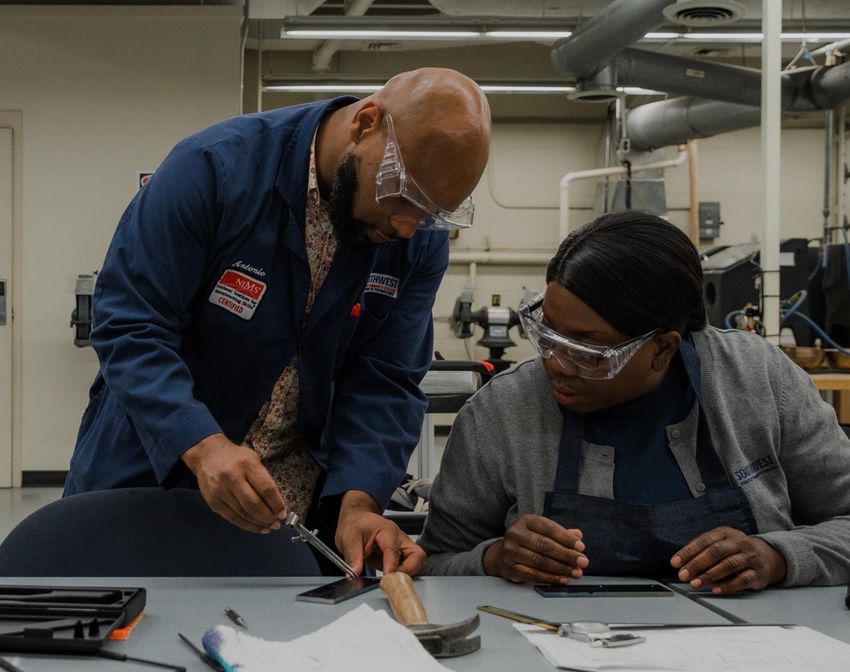
Campus Success Stories
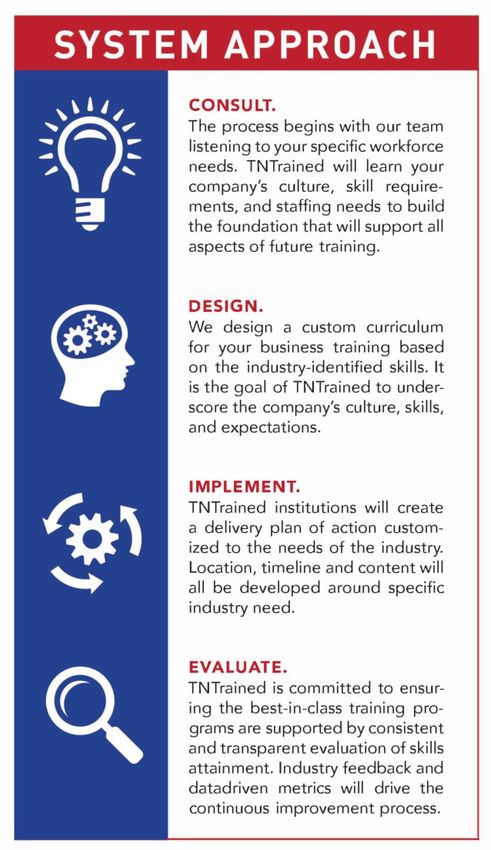
A S YS T E M A P P ROAC H
                       TO W O R K F O RC E D E V E LO P M E N T

TNTrained is a system approach that provides
new and expanding industry the full range of
workforce development strategies that deliver
customized training aimed at staffing
businesses with the best-trained workforce.
TNTrained
WORKFORCE DEVELOPMENT
TOPICS I NCLUDE :
CONFERENCE Customer Service
April 13-14, 2021 – 9:30-11 Central
Credentialing/PLA
Virtual via Zoom
Best Practices
K EYNOTE S PEAKER : Future of Workforce
Jesse Cole, Founder of Fans First
Entertainment, an organization committed
to principles of outstanding customer
service and one of the fastest growing
companies in America.Strategic Plan Update
Student Access, Retention,
                       & Success
                       Spring 2021
TCAT Knoxville, 2019
Enrollment
and Success
in Fall 2020
TCAT Memphis,
2019At TCATs, enrollment declined 2% from fall 2019 to
Fall 2020
fall 2020. That’sEnrollment
about 350 fewer at TCATs
students.
Dual New student Adult
enrollment enrollment enrollment
declined 3% from 2019 to 2020. declined 6% from 2019 to 2020. declined 2% from 2019 to 2020.
That’s 143 fewer students. That’s 238 fewer students. That’s 102 fewer students.
6,000 6,000 6,000
4,500 4,500 4,500
3,000 3,000 3,000
1,500 1,500 1,500
0 0 0
'15 '16 '17 '18 '19 '20 '19 '20 '15 '16 '17 '18 '19 '20
*Count is per student per institution, so students in multiple programs are counted once. Dual Enrollment is defined as students identified as a secondary student, regardless of training level. Adult students are defined as
students age 25 or older, including students in preparatory and supplemental programs. This excludes lineworkers at TCAT Murfreesboro. New student enrollment only includes preparatory students, excluding TCAT Chattanooga.Enrollment at community colleges declined 10% from fall 2019 to
fall 2020. That’s about 8,780 fewer students. However, enrollment
increased slightly from the beginning to the end of the semester.
Dual First-time, full- Adult
enrollment time freshmen enrollment
declined 8% from 2019 to 2020. declined 17% from 2019 to 2020. declined 12% from 2019 to 2020.
That’s 1,275 fewer students. That’s 3,100 fewer students. That’s 2,850 fewer students.
25,000 25,000 40,000
20,000 20,000 32,000
15,000 15,000 24,000
10,000 10,000 16,000
5,000 5,000 8,000
0 0 0
'11 '12 '13 '14 '15 '16 '17 '18 '19 '20 '11 '12 '13 '14 '15 '16 '17 '18 '19 '20 '11 '12 '13 '14 '15 '16 '17 '18 '19 '20
*End-of-term enrollment data. Adult students are defined as students age 25 or older.Black & African American male enrollment
declined 21% from 2019 to 2020.
That’s 1,000 fewer students.
Enrollment in First time, full-time Black male enrollment
declined 33% from 2019 to 2020.
Fall 2020 That’s 400 fewer students.
Many community colleges saw First time, full-time low-income
pronounced drops in enrollment enrollment declined 28% from 2019 to
among Black students and low- 2020. That’s 3,000 fewer students.
income students. These declines have
sharpened our focus on the open
access mission of the system.Course outcomes declined slightly in fall 2020. Further
Fall 2020
research Enrollment
on online at TCATs
coursetaking may help guide efforts
to improve these success rates.
Fall 2018 Fall 2019 Fall 2020
72% 73%
69%
10% 9% 10% 9%
5% 5% 5% 6% 7% 6% 6% 7%
0.4% 0.2% 0.4%
Success (A,B,C) Other Pass (D) Fail (F) Attendance Failure (FA) Withdrawal (W) Incomplete (I)
Earned Credit No Credit Earned In Progress
*Success also includes a passing grade in pass/fail courses. Data includes all courses at all community colleges for the past three fall terms.Enrollment in
Spring 2021
Southwest Tennessee Community College, 2019TCAT Enrollment
In Spring 2021:
• As of March 16, 2021, 9,818 non-dual enrollment
students are registered, three percent less than the
same day prior year.
• As of March 16, 2021, TCAT attendance for non-dual
enrollment students is 9,497, four percent less than
the same day prior year.
• The distribution of enrollment by program does not
appear to have changed significantly when comparing
spring 2021 to spring 2020.
*TCAT registration and attendance data for same day prior year if as of March 17, 2020. Since TCAT – Chattanooga is not in the central
Banner system, the above data does not include Chattanooga. Attendance and registration will continue to grow throughout the term,
TCAT Hohenwald, 2019 so these figures are preliminary.At community colleges, enrollment in spring 2021 is 15% lower
than in spring 2020. This represents about 11,000 fewer students.
First-time college Adult
Dual students starting in
enrollment the spring enrollment
declined 12% from spring 2020 declined 26% from spring 2020 declined 13% from spring 2020
to spring 2021. That’s 1,700 fewer to spring 2021. That’s 369 fewer to spring 2021. That’s 3,000 fewer
students. students. students.
20,000 4,000 40,000
15,000 3,000 30,000
10,000 2,000 20,000
5,000 1,000 10,000
0 0 0
'11 '12 '13 '14 '15 '16 '17 '18 '19 '20 '21 '11 '12 '13 '14 '15 '16 '17 '18 '19 '20 '21 '11 '12 '13 '14 '15 '16 '17 '18 '19 '20 '21
*Preliminary spring 2021 enrollment is based on census (14th day) enrollment data. Prior years are reported with official end-of-term data. Historically, the end-of-term headcount is 1-2% higher than census. Census FTE
may not reflect enrollments in courses that begin after the 14th day. Adult students are defined as students age 25 or older.Enrollment by Black & African American
students declined 21% from spring 2020
to 2021. That’s 2,475 fewer students.
Enrollment in Black male enrollment declined 27% from
spring 2020 to 2021.
Spring 2021 That’s 1,090 fewer students.
Many community colleges saw Hispanic enrollment declined 12% from
declines in enrollment among Black spring 2020 to 2021.
students and Hispanic students. That’s 600 fewer students.Fall-to-spring retention rates fell in 2021. Of the students who
began in fall 2020, only 70% returned in spring 2021.
Fall-to-Spring Retention Rates for First-Time, Full-Time Students
Fall-to-spring retention rates
measure how many students
80% from the fall freshman class
returned in the spring.
70%
Fall-to-spring retention
60%
declined this year,
from 77% in 2019-20 to
70% in 2020-21.
50%
These declines were steepest
40% for Hispanic students
2018-19 2019-20 2020-21 and Black students. Among
Fall FTFT Cohort Black male students, fall-to-
spring retention declined
All Black Black Male Hispanic White from 70% to 59%.
*Retention rates reflect the number of students in the first-time, full-time freshmen cohort who initially enrolled in the fall and returned the next spring or earned a certificate or degree anytime during the first term of
enrollment. Data for the 2020 cohort is preliminary and based on census (14 th day) enrollment data for spring 2021.Student
Success in
2020
Roane State Community College, 2019In fall 2020, students set a record for the number of credentials
earned in a single fall term.
Awards Earned at Community Colleges and TCATs Each Fall
Fall 2011 3,092 2,096 5,188
Fall 2012 3,346 2,059 5,405
Fall 2013 3,559 2,087 5,646
Fall 2014 3,606 2,176 5,782
Fall 2015 4,183 2,036 6,219
Fall 2016 3,788 2,209 5,997
Fall 2017 4,746 2,265 7,011
Fall 2018 4,374 2,174 6,548
Fall 2019 4,712 2,213 6,925
Fall 2020 4,719 2,312 7,031
Community Colleges TCATsGraduation rates have continued to increase for each
Fall
cohort2020 Enrollment
of first-time at TCATs
students at community colleges.
35% 2018
31% 31%
30% 30% 2017
29%
Cumulative Graduation Rate
30% 2016
27%
26% 25%
2015
25% 25%
2014
20%
20% 2013
2012
15%
2011
10% 2010
2009
5%
0%
1 2 3 4 5 6 7 8 9 10 11 12 13 14 15 16 17 18 19 20 21 22 23 24 25 26 27 28 29 30
Number of Semesters Since First Enrollment (Including Summers)
*The cumulative graduation rate reflects the cumulative number of students in a first-time, full-time freshman cohort who earned a technical certificate or degree from any TBR community in each semester, beginning with the
student’s first semester of enrollment as a first-time, full-time freshman.Twenty percent of students from the 2018 cohort have
already graduated—representing the highest graduation rate
after 2.5 years ever.
Graduation Rates in 2.5 Years (Seven Semesters)
The percent of students
25%
23%
who graduated within 2.5
21% years of enrollment has
20% 20% doubled over the past
decade.
15%
Due to increases in cohort
Tennessee Promise
9%
10%
9%
sizes and graduation rates,
8%
8% 3,860 students from the
5% 2018 cohort graduated
2% within 2.5 years of their
0% first enrollment, compared
2009 2010 2011 2012 2013 2014 2015 2016 2017 2018 to only 2,011 students
Entering Cohort from 2014.
All First-Time, Full-Time Black FTFT
White FTFT Recent High School Graduates1 In fall 2020, community college enrollment declined 10%,
and TCAT enrollment declined 2% over the previous fall.
Course success rates in fall 2020 declined slightly.
2 Further research may help guide efforts to improve
success rates.
Community college enrollment declined 15% from spring
3 2020 to 2021. Fall-to-spring retention declined as well,
especially for Black and Hispanic students.
Key Takeaways 4
Students from the 2018 cohort set a new graduation rate
record in 2020. Twenty percent of students graduated
within 2.5 years—more than ever before.
Jackson State Community CollegeC. Discussion
1. Draft Rulemaking
a. Contested Case Procedures Under the
Uniform Administrative Procedures Act
b. Parking and Transit
c. Student Conduct and Disciplinary
Procedures
d. Title IX Compliance/Sexual MisconductDiscussion: Draft Rulemaking Brian Lapps, General Counsel
Draft Rules

• Contested Cases under the Uniform Administrative
  Procedures Act (New)
• Parking and Traffic (New)
• Student Conduct and Disciplinary Procedures (Amended)
• Title IX Compliance/Sexual Misconduct (New Rule/Amended
  Policy)
D. Action Items
   1.   Receive and Consider a Recommendation for the President
        of TCAT McKenzie and Paris
   2.   Review and Consider Resolution of Appreciation for President
        Brad White
   3.   Review and Consider Proposed Criteria for the President of
        Volunteer State Community College
   4.   Review and Consider Proposed Criteria for the President of
        TCAT McMinnville
   5.   Multiple Measures for Learning Support Pilot
   6.   Proposed Program Implementations at the Colleges of
        Applied Technology
   7.   Review and Consider New TBR Policy 7.04.00.00 –
        Programs for Minors on Campus
   8.   Review and Consider Proposed Changes to the Bylaws
   9.   Review and Consider Standing Resolution Delegating
        Authority for Rulemaking Hearings
Recommendation for President of TCAT McKenzie and Paris
Mr. Willie Huffman
Resolution of
Appreciation for
President Brad White
Criteria for the President of
Volunteer State Community College
Criteria for the President of
     TCAT McMinnville
Multiple Measures for Learning Support Placement 2020 Pilot
Over the past decade, Tennessee has transformed remediation.
Students at Tennessee community colleges can access college-level
courses in their first year through three pathways.

                                 Placement Tests
                                 First-time and dual enrollment students who satisfy minimum cut scores
                                 on placement tests (like the ACT, SAT, or Accuplacer) can enroll directly in
                                 college-level courses.

 The path to                     SAILS

college-level                    Students who successfully complete SAILS during their senior year of high
                                 school can enroll directly in college-level math courses.

   courses
                                 Corequisite Learning Support
                                 First-time students who do not meet minimum placement scores and do
                                 not complete SAILS enroll in corequisite learning support courses
                                 alongside their college-level courses. In 2015, TBR became the first system
                                 to transform from the prerequisite remediation model into the innovative
                                 corequisite model at scale across all community colleges.
More than half of first-time students at Tennessee community
colleges require learning support. Corequisite learning support
transformed student success.
Learning support is a
The corequisite learning
In fall 2019, before key part of colleges’
support model
COVID-19… efforts to close equity
transformed success.
gaps.
59% 84% 57%
of first-time, full-time of corequisite learning
of first-time, full-time
students required learning support students in 2017
Black students were placed
support in at least one passed college-level math
into learning support in fall
subject, and 21% required in their first year, compared
2019, along with 66% of
support in all three to only 15% under the
Hispanic students.
subjects. prerequisite model in 2013.TN Corequisite
Placement Pilot
Added high school GPA as a method for
In March 2020, TBR approved a pilot placement alongside traditional measures.
effort to add high school GPA as a
method for learning support
placement.
• COVID-19 posed challenges to Students with a high school GPA of 3.6 or higher
students access to tests like the could bypass corequisite learning support
ACT and Accuplacer.
regardless of their test scores.
• Using high school GPA for
placement is a research-based
best practice.
• Implementing this reform At three colleges, students could provisionally
alongside corequisite learning place out of remediation if their high school GPA
support continues Tennessee’s was between 2.8 - 3.6.
tradition of remediation reform
and innovation.Success in College-Level Math for
First-Time Freshmen in Fall 2020
ACT Math Below Cut Score ACT Math Above Cut Score
HS GPA 36% 48%
Pilot Below 3.6 • passed college-level math in fall
2020, compared to 38% in fall 2019.
• passed college-level math in fall
2020, compared to 54% in fall 2019.
students In Learning Not In
succeeded
Support Learning
Support
at high
rates. HS GPA 72% 79%
Above 3.6
• passed college-level math in fall • passed college-level math in fall
2020, compared to 79% in fall 2019. 2020, compared to 87% in fall 2019.
Not In
Pilot Learning
Support
*Pass rates reflect the number of students enrolled in a college-level math course who earned a grade of A, B, or C.
288 first-time freshmen had high school GPAs above 3.6 but no ACT score. Of these, 65% passed math.Tennessee
Corequisite Extension of the pilot through 2020-2021 would
allow placement to be determined by high school
Placement GPA, alongside traditional test-based measures.
Pilot
This extension will help place students who lack
access to tests or where test scores are delayed
due to COVID-19.
This will also allow for further research into
outcomes for students whose placement was
determined based on their high school GPA.Proposed TCAT Program Terminations,
Modifications, and New Technical
Program Implementations
Dr. Tachaka Hollins
Assistant Vice Chancellor, Academic Affairs64
TENNESSEE COLLEGE OF APPLIED TECHNOLOGY
ATHENS
• Implementation of Pre-Practical Nursing-dual enrollment program at the
main campus (See Implementation Proposal # 1)
TENNESSEE COLLEGE OF APPLIED TECHNOLOGY
ELIZABETHTON
• Implementation of Building Construction Technology at ETSU at
Kingsport Campus (23) (See Implementation Proposal # 2)65
TENNESSEE COLLEGE OF APPLIED TECHNOLOGY
HARRIMAN
• Implementation of Computer Operating Systems and Network Technology
hybrid and traditional program at the main campus
(See Implementation Proposal # 3)
• Implementation of Pre-Practical Nursing – dual enrollment program at the
main campus (See Implementation Proposal # 4)
• Implementation of Transportation, Distribution, and Logistics Program
hybrid and traditional at the TCAT Harriman- Three-Star Extension Campus
(2M) (See Implementation Proposal # 5)66
TENNESSEE COLLEGE OF APPLIED TECHNOLOGY
HOHENWALD
• Implementation of Power Sports Technology program at the main campus
(See Implementation Proposal # 6)
TENNESSEE COLLEGE OF APPLIED TECHNOLOGY
KNOXVILLE
• Implementation of Pre-Practical Nursing – dual enrollment program at Alcoa High
School (2J). (See Implementation Proposal # 7)67
TENNESSEE COLLEGE OF APPLIED TECHNOLOGY
LIVINGSTON
• Implementation of Pre-Practical Nursing – dual enrollment program at
Cookeville High School (2C) (See Implementation Proposal # 8)
• Implementation of Farming Operations Technology-dual enrollment hybrid
and traditional program at Monterey High School (2H) (See Implementation
Proposal # 9)68
TENNESSEE COLLEGE OF APPLIED TECHNOLOGY
NEWBERN
• Proposal to relocate the Diesel-Powered Equipment Technology program from the
TCAT Newbern Transportation Campus (2D) to the main campus
(See Implementation Proposal # 10)
• Proposal to relocate the Truck Driving program from the TCAT Newbern
Transportation Campus (2D) to the main campus
(See Implementation Proposal # 11)
• Proposal to relocate the Welding Technology program from the TCAT Newbern
Transportation Campus (2D) to the main campus.
(See Implementation Proposal #12)69
TENNESSEE COLLEGE OF APPLIED TECHNOLOGY
RIPLEY
• Implementation of Barbering program at the main campus
(See Implementation Proposal # 13)
TENNESSEE COLLEGE OF APPLIED TECHNOLOGY
SHELBYVILLE
• Implementation of Pre-Practical Nursing – dual enrollment program at the
main campus (See Implementation Proposal # 14)70 Hybrid Delivery • The Office of Academic Affairs recommends one-hundred, forty- seven (147) programs seeking to add hybrid delivery mode to their existing program inventory for review and approval. See board materials for more details. • Recently, COE informed schools of the option to have programs approved as traditional and hybrid instruction. The hybrid modality does not impact fiscal resources, personnel, space, or equipment. A hybrid program makes available less than 50% of its required instructional hours via distance education. The COE temporary waiver for distance education instruction expires on June 30, 2021.
71

Program Modifications
To meet the requirements of the Council on
Occupational Education (COE) accrediting body, six
(6) program modifications are being presented for the
Board’s review and approval. These proposals will
allow the Technical Colleges to be more responsive to
the needs of students, businesses, and industries. The
program modifications are included in your materials.
Programs for Minors on
            Campus Policy
• Goal of Increasing Safety of Minors in Campus programs.
• Applies to academic camps, sports camps, and other
  sponsored activities (in person and online).
• Requires background checks and training.
• Centralizes accountability.
Proposed Revisions to Bylaws
• Two minor revisions
o Name Change – “Committee on Economic and Community
Development” becomes “Committee on Workforce
Development”
o References latest version of Robert’s Rules of OrderDelegation of Rulemaking
Hearing
• General Counsel, with assistance from Secretary, would conduct
hearing.
• These are typically routine functions.
• Rulemaking Hearing must be separate from Board meeting to
consider rules.
• Board retains authority to approve rules.
• Board may revoke delegation at any time.Quarterly Board Meeting March 25, 2021
You can also read