QV Equities Investor Update - April 2019
←
→
Page content transcription
If your browser does not render page correctly, please read the page content below
QV Equities Investor Update
April 2019

Agenda
IML State Manager
The purpose of QVE
Daniel Moore and Michael O’Neill - Senior Analyst & PM
Time for caution….being selective is key
Simon Conn - Senior PM
QVE portfolio positioning and key holdings
2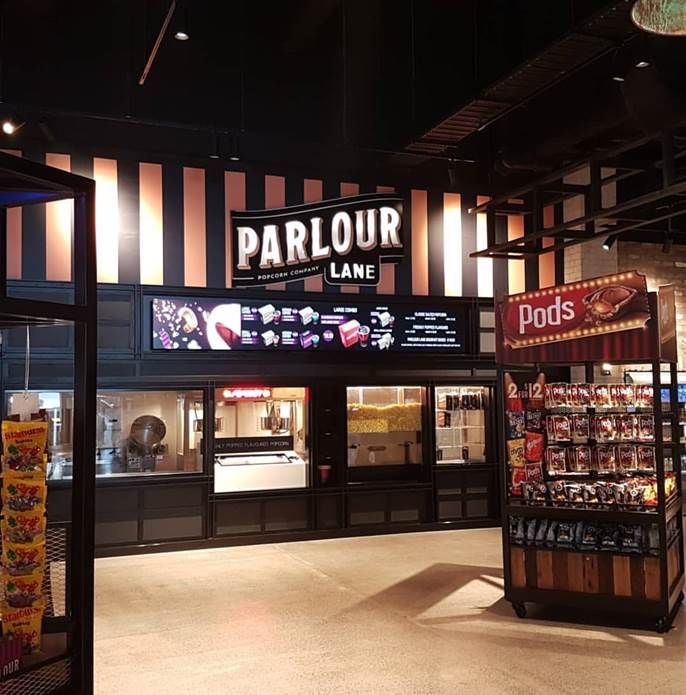
QV Equities Limited
Listed 22 August 2014
Managed by Investors Mutual
Focused on Ex-20 stocks
Experienced Board with independent majority
Focus on long-term capital growth & income
3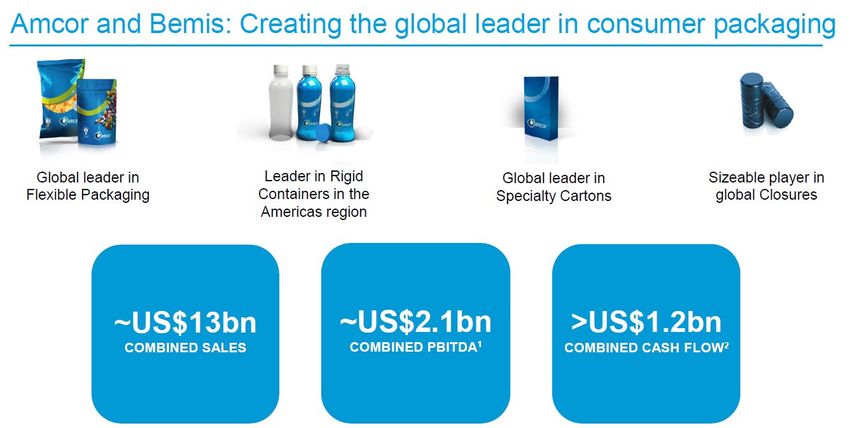
About IML
Boutique manager established in 1998
Over $9b FUM – with a focus on retail
Disciplined ‘true to label’ Value & Quality style
Consistent performance and outcomes over the past 20 years
Well resourced investment team with experienced leadership
Past performance is not a reliable indicator of future performance
4
ASX 20- Dominated by Financials & Resources
                                  Energy             Real Estate
           Consumer Telco Services 4%                   2%
          Discretionary   4%
              4%

             Industrials
                5%

               Consumer
                Staples    Health Care                   Financials
                  6%           9%                           47%

                                                                                     Financials &
                                         Materials
                                                                                     Resources 66%
                                          19%

5                                                                  Source: ASX20list.com as at 28 February 2019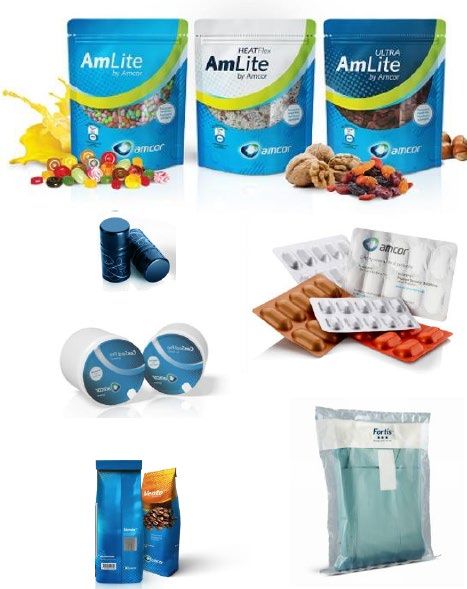
ASX ex 20 - More diverse sectors

                                                      Communication
                                   Utilities             Services
            Consumer Staple          5%                    3%
                 5%
                                                         Materials
                      I.T.                                18%
                      5%

               Health Care
                   8%                                           Real Estate
                               Energy                              14%
                                 9%

                                                             Financials
                Consumer                                        12%
                                               Industrials
               Discretionary
                                                  12%
                    9%

                                                                          Source: Factset as at 28 February 2019
6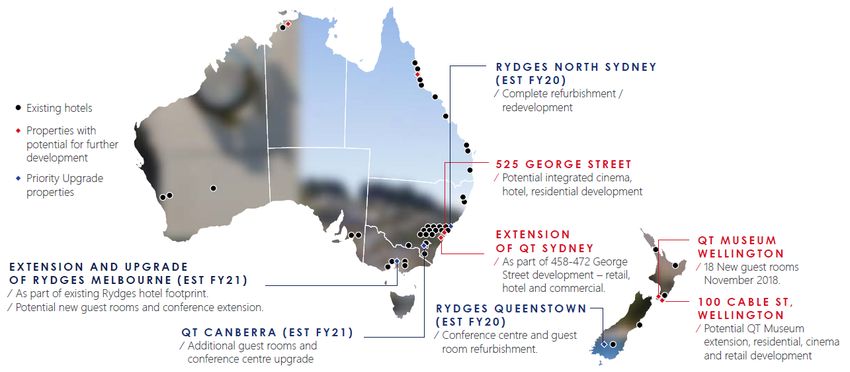
Why focus on an Ex 20 managed portfolio?
More diverse in terms of industry sectors
Less researched opportunities
Investors typically underweight in this segment
Solid yields on offer
IML has a long record of significant value add in this segment
Past performance is not a reliable indicator of future performance. The value of your investment can move up or down
7
Time for caution…being selective is key
Retail investor needs:
The portfolio aims or seeks to provide the following:
Capital preservation
Reasonable capital growth
Income focused
Capital is not guaranteed. Capital growth and income objectives are made on a reasonable basis and are not a guarantee of actual outcomes or performance
9
Investment Philosophy: focus on quality and value

     We seek to buy and own:

     Companies with a competitive advantage,

     with recurring earnings,

     run by capable management,

     that can grow,

     .......at a reasonable price.

10
Patience and discipline required as an investor
Market Investor
Short term focus Long term focus
Momentum driven Valuation driven
Upgrade / Downgrade mania Disciplined focus on ‘quality’
Daily information flow In-depth research
11QVE portfolio lagging over recent periods “Momentum” based market Resources sector strong Industrials sector lagging Significant gains in momentum/concept stocks A few disappointing performers in the portfolio 12
The changing nature of who’s participating in markets

                                                                                             Breakdown of US volumes

           Average Daily Volume (billion shares)

                                                   1997 1998 1999 2000 2001 2002 2003 2004 2005 2006 2007 2008 2009 2010 2011 2012 2013 2014 2015 2016 2017 2018

                                                                                           HFT   Passive Funds   Active Funds

                                                                                                                                Source: Credit Suisse; As at 31 December 2018
13
Iron ore prices
USD 200/t Iron ore (FOB Australia)
USD 180/t
USD 160/t
USD 140/t
USD 120/t
USD 100/t
USD 80/t
USD 60/t
USD 40/t
USD 20/t
USD 0/t
1995 1996 1997 1998 1999 2000 2001 2002 2003 2004 2005 2006 2007 2008 2009 2010 2011 2012 2013 2014 2015 2016 2017 2018 2019
Source: IRESS;
As at 30 January 2019
14Current environment
Interest rates low High debt levels
Unemployment and inflation low Election uncertainty
Population growth Chinese slowdown (FAI)
Infrastructure boom Trade wars, Brexit
Commodity prices strong Property price falls
15Housing credit
Housing credit growth (3m annualised)…lowest on record
Source: Deutsche Bank, RBA;
16 As at January 2019Housing approvals 17 Source: RBA Chart Pack February 2019; ABS
Time for caution; however opportunities are appearing
Global growth is slowing
Interest rates – inflation remain low
Signs of excesses in markets appearing
Value emerging in some sectors
Being selective and looking beyond the short term will deliver results over time
18Froth and Bubble?
Technology stocks
REITs
Iron ore stocks
High growth ‘concept’ stocks
…time to be selective
19The IT momentum trade: 2016-19
20,000
Market Cap
18,000
Wisetech $7.1bn 16,000
Appen $2.7bn 14,000
Afterpay $4.7bn 12,000
Altium $4.2bn
$M
10,000
Total $18.7bn 8,000
6,000
4,000
2,000
0
Mar-16
Sep-16
Sep-17
Sep-18
Jul-16
Jan-17
Mar-17
Jan-18
Mar-18
Jan-19
Mar-19
Nov-16
Jul-17
Nov-17
Jul-18
Nov-18
May-16
May-17
May-18
Source: IRESS, FactSet; JPMorgan
20 As at 28 March 2019Valuations – Reality check
Past performance is not a reliable indicator of future performance
Source: IML;
As at 27 March 2019
21Goodman Group share price & PE
14 26
13
Price PE 24
12
11 22
10
20
Price
9
PE
18
8
7 16
6
14
5
4 12
FY10 FY11 FY12 FY13 FY14 FY15 FY16 FY17 FY18 Source: FactSet & Goodman reports;
As at 29 March 2019
Investment 82% 71% 69% 65% 60% 57% 49% 35% 32%
Management 10% 10% 11% 14% 14% 14% 16% 23% 27%
22
Development 8% 19% 20% 21% 26% 29% 35% 42% 41%Themes of the past- Fads come and go
Dot.com boom of 2000/2001
LPT boom of 2005 – 2008
Resources/ mining services boom 2005-2008
The latest instalment…
IT sector: 2016 - 19
23IML’s portfolio focus
Investing in companies with sustainable earnings and dividends
Not capitalising high spot prices or development profits
Investing in companies with a strong franchise and realistic plan for the next
3-5 years
Cautious cyclicals
24Financials
Slowdown in lending and further fee cuts
Competition impacting margins
Bad debts at cyclical lows
Higher regulatory compliance and remediation costs
Higher capital requirements for NZ
25Stock Market Corrections (Lesson 17)
Corrections are unpredictable and inevitable
Invest in quality stocks for the long term
Be diversified
Never be over geared
Take advantage of indiscriminate selling
When sanity prevails good quality companies with real earnings will recover
26QVE Portfolio update
CY 2018 – a volatile year
                                                               Performance (Pre-tax)
        10.0%
                                                                        7.4%
                                                           4.7%
         5.0%
                                                                                                      1.5%
         0.0%
                                                                                              -0.2%
                 -2.7% -3.2%
         -5.0%

        -10.0%                                                                                                             -8.1%

                                                                                                                                       -11.3%
        -15.0%
                     Q1                                            Q2                              Q3                               Q4
                                                                     QVE             ASX300 ex20
                                                                                                             Source: NTA Quarterly reports 2018
                     Past performance is not a reliable indicator of future performance                      As at 31 December 2018
28
IML’s approach to ex 20 stocks
Focus on good quality mid and small cap names and stick to fundamentals
Smalls/mid cap sector more prone to fads/bubbles/hype
Discipline required in particular in this segment
Yield works in this sector – key component of total returns
29Portfolio positioning - company specific initiatives
Company specific initiatives - examples
Cost-outs ➔ Pact Group, Clydesdale Bank
Acquisitions ➔ Integral Diagnostics, Amcor
Genesis Energy, Shopping Centres
Contracted growth ➔
Australasia
Market share gains ➔ GWA, Tabcorp
Restructuring ➔ Nine Entertainment, Caltex
30QV Equities key stocks
KEY EQUITY INVESTMENTS ASX Code Weight
Amcor AMC 4.5%
Crown Resorts CWN 4.5%
Caltex Australia CTX 4.3%
Spark Infrastructure SKI 4.0%
Sonic Healthcare SHL 3.9%
Aurizon AZJ 3.7%
Steadfast SDF 3.6%
Orica ORI 3.4%
Pact Group PGH 3.3%
GWA GWA 2.9%
31 Source: QVE NTA as at 28 February 2019QVE Portfolio – 12 month positive contributors
Ruralco
Steadfast
Amcor
Genesis Energy
Southern Cross Media
Shopping Centres Australasia
Contact Energy
Source: QVE as at 28 February 2019
32Disappointing performers
Bank of Queensland
Clydesdale Bank
Pact Group
Source: QVE as at 28 February 2019
33QVE portfolio activity- Recent buys
Recent buys
Nine Entertainment
Crown Resorts
Regis Healthcare
Tabcorp
Southern Cross Media
Origin Energy
Sydney Airport
As at 28 February 2019
34QVE portfolio activity- Recent sells
Recent sells/trims
Fletcher Building
Fairfax Media
Ansell
AGL Energy
Contact Energy
As at 28 February 2019
35Amcor
One of the largest packaging companies in the world
Operates 200 plants, in 43 countries
95% of sales to consumables (food, beverages, healthcare)
Proposed Bemis transaction
36Amcor
1 Based on revenues for the year ended 30 June 2018, excluding specialty cartons
2 Amcor management estimates based on Bemis revenues for the year ended 30 June 2018
Source: Amcor – Credit Suisse FB Conference Presentation
As at 28 March 2019
37Amcor
1 Based on combined US GAAP Adjusted PBITDA for FY18 and includes an expected US $180 million of annual pre tax cost synergies.
2 Based on combined operating cash flow (before capital expenditures, acquisitions and dividends) for the year ended June 30, 2018.
Source: Amcor – Credit Suisse FB Conference Presentation
As at 28 March 2019
38Tabcorp
Owns monopoly lotteries and retail wagering licenses in Australia
Recurring earnings, which are resilient through the economic cycle
Strong growth potential from transition to online lotteries sales
Dividend yield of ~5% fully franked
Source: IML estimates & Tabcorp;
As at 20 March 2019
39Tabcorp: Online lotteries growth
Source: Tabcorp strategy day & 1H19 presentation;
November 2018 & February 2019
40Tabcorp: Developments
Levelling of the playing field with Point of Consumption Tax
Powerball changes
– 30% price increase
– New rules mean higher frequency of large jackpots
Set for Life
– New game innovation targeted at Millennials
Synergies with Tatts
– $130m - $145m of savings from integration
Source: IML estimates & PaddyPower Annual report;
As at 20 March 2019
41Stock Update
• Southern Cross Media: H1 EPS DPS PE Yld
Metro radio – one of three national FM networks +10% Flat 10.4 6.7% ff
Regional radio – only scale player
Regional TV – Ch9 affiliate in most regional areas
• GWA: +7.4% +5.9% 15.9 5.5% ff
leading designer & supplier to Bathrooms & Kitchens
market
- Methven acquisition strengthens portfolio
Source: IML
42
As at 29 March 2019Nine Entertainment
FY20F EBITDA split
Fairfax Media merger completed December 2018
Merger synergies of at least $65m p.a.
Revenue synergies from cross-selling
Target of >60% digital earnings by 2022
Source: IML & Nine Entertainment;
43 As at 29 March 2019Nine Entertainment
Free-to-air TV remains the pre-eminent mass market vehicle for brand advertising
Since 2013, audience CAGR -5% vs TV ad spend down 1% p.a.
Other video properties performing strongly
Stan 1.5m subs, forecasting 1st profit Q4’19
9Now streaming ad revenue +51% in H1’’19
Significant opportunity in cross-promoting Domain
9Now revenues hoh ($m)
35
30
25
20
15
10
5
0
1H17 2H17 1H18 2H18 1H19 Source: IML & Nine Entertainment;
44
As at 29 March 2019Nine Entertainment
Attractive valuation: FY20 PE 11.2x, yield 5.8%
Current portfolio offers optionality
Asset sales (ACM, Stuff NZ)
Acquisition of MRN and/or Domain minorities
Potential to add equity partners in Stan
Strong balance sheet (0.5x net debt / EBITDA)
Source: IML & Nine Entertainment
IML PE & Yield Estimates
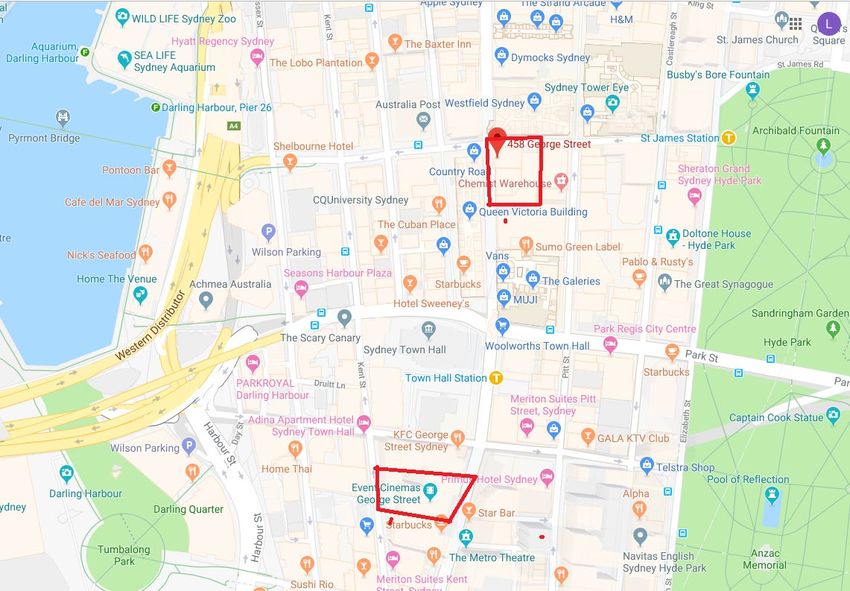
45 As at 29 March 2019Event Hospitality & Entertainment
Cinema business in Australia & New Zealand
Australian hotel business - QT, Rydges & Atura
Significant and strategic property portfolio
Conservative balance sheet strengthened further by sale of
German cinema assets
New management reshaping the company
Source: IML, Events Hospitality &
46 Entertainment website & company data
As at February 2019Event Hospitality & Entertainment : Property portfolio market value: $2bn
Existing hotels
Property with potential for further development
Priority Upgrade properties
Source: IML, Events Hospitality &
47
Entertainment website & company data
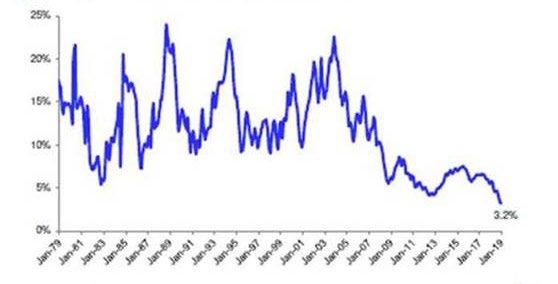
As at 27 March 2019Interest rates stuck to the bottom – yields provide an investor a foundation
Source: FactSet;
As at 22 March 2019
48Yields: don’t forget the income
Portfolio Top Holdings Yield
Genesis Energy 5.9%
GWA 5.6%
Southern Cross Media 6.6%
Tabcorp 4.5%
Nine Entertainment 5.7%
Crown Resorts 5.1%
Hotel Property Investments 6.1%
Ausnet 5.4%
Aurizon 5.0%
Skycity Entertainment 5.2%
Sydney Airport 5.3%
Regis Healthcare 4.7%
Shopping Centres Australasia 5.6%
Unibail-Rodamco-Westfield 7.3%
Charter Hall Retail 6.4%
Genesis Energy dividend includes the supplemental.
Past performance is not a reliable indicator of future performance Source: IML; FY19 estimates as at 2 April 2019
49QVE Performance & NTA – February 2019
NET TANGIBLE ASSETS
(NTA)* QVE-ASX
NTA before tax $1.11 (ex div)
NTA after tax $1.10 (ex div)
PERFORMANCE* QVE’s NTA (pre QVE’s NTA BENCHMARK
tax) (after tax)
1 Month +2.2% +1.6% +5.3%
3 Months +3.4% +2.5% +9.6%
6 Months -4.2% -2.8% -2.8%
1 Year -0.5% +0.2% +4.9%
Since Inception Total Return p.a +7.3% +6.2% +10.1%
*The before and after tax NTA numbers relate to the provision for tax on net profit in addition to deferred tax on the un-realised gains in the Company’s
investment portfolio. The Company is a long term investor and does not intend disposing of its total portfolio. Under current Accounting standards, the
Company is required to provide for tax on any gains that might arise on such a theoretical disposal, after utilisation of brought forward losses. All figures
are unaudited and approximate.
The above returns are after fees and assumes all declared dividends are reinvested and excludes tax paid from pre tax NTA. *Performance is calculated
to 28 February 2019. Past performance is not indicative of future performance.
Source: QVE NTA as at 28 February 2019
50Historical Dividends to QVE Shareholders
QVE Dividend Payment (Fully Franked)
3.5 Special Dividend (Fully Franked)
3.0 1.0
2.5
2.2
CENTS PER SHARE
2.1
2.0 2.0
2.0 1.8
2.1
1.5 1.5
1.5
1.0
0.5
0.5
0.0
FY15 Interim FY15 Final FY16 Interim FY16 Final FY17 Interim FY17 Final FY18 Interim FY18 Final FY19 Interim
Source: QVE FY18 Annual Report & HY19 Results report
51QVE historical NTA
QVE NTA
1.3
1.25
1.2
1.15
1.1
1.05
1
0.95
0.9
Source: QVE
52Outlook
Global economies growing steadily
Record low interest rates
Ongoing volatility in the sharemarket
Caution and being selective remains the key
53QVE Portfolio Weights – as at 28 February 2019
Comm. Services I.T.
5% 1%
Real Estate
5%
Cash
17%
Utilities
8%
Energy Materials
8% 14%
Health Care
9%
Financials
10% Consumer
Industrials Discretionary
10% 13%
Source: QVE NTA February 2019
54IML’s portfolio focus:
Staying disciplined is key
IML’s portfolios underpinned by quality industrial companies on reasonable valuations
Income will remain important
Volatility expected to remain
Selectively deploying cash opportunistically
55IML’s competitive advantage
True to label: disciplined approach and proven track record over 20 years
Proven investment process: proven downside protection and income generation
IML has a long record of significant value add in this segment
Past performance is not a reliable indicator of future performance
56Conclusion
Thank you for your attendance
Regular communications – videos and webinars
Website sign up to receive IML emails, musings & investment updates
Feedback forms – CPD Points
Questions for the speakers
57DISCLAIMER
QV Equities Limited ACN 169 154 858 (QVE) has prepared the information in this presentation. This
presentation has been prepared for the purposes of providing general information only and does not
constitute personal financial product or investment advice as it does not take into account your
investment objectives, taxation situation, financial situation or needs. An investor must not act on the basis
of any matter contained in this presentation in making an investment decision but must make its own
assessment of QVE, conduct its own investigations and analysis, and seek independent financial, taxation
and legal advice. Past performance is not a reliable indicator of future performance. QVE is an Authorised
Representative of Investors Mutual Limited (AFSL Number 229988)
QVE, its directors, employees and consultants do not warrant the accuracy, reliability or completeness of
information contained in the presentation and, to the extent permitted by law, accept no responsibility for
any loss or damage arising in any way (whether arising in contract, or tort or negligence or otherwise)
from any representation, error or omission in the information or from any resulting loss or damage
(whether direct, indirect, consequential or otherwise) suffered by the recipient of this material or any other
person. The information provided within the presentation is not intended to be a complete description of
matters described.
Usage and linking to the QVE presentation is at the users own risk. QVE will not be liable for any loss or
damage from any cause (including negligence) to a users system or presentation, or to people linking to
QVE from a users presentation, caused by or in connection with the use of or a link to the QVE
presentation. Any such loss or damage is at the responsibility of the user. QVE advises users to take their
own precautions in relation to protecting their system or presentation from viruses or malfunction.
Copyright in the information contained in this presentation is owned by QVE. Use of this information or
reproduction of it in any form is allowed for personal use only. Without limiting the generality of the
foregoing, QVE does not permit reproductions of its material in other presentations in conjunction with
advertising, trademarks, logos on material of other financial planners or competitors without the express
written permission of QVE.
All currency references are references to Australian dollars (unless otherwise specified) and any reference
to law is to the law of Australia.
All estimates are made on a reasonable basis and are not a guarantee of actual outcomes or performance.You can also read