Raffaele Argiento Presentazione ai dottorandi: The Cattolica reseach group - Bicocca
←
→
Page content transcription
If your browser does not render page correctly, please read the page content below

Presentazione ai dottorandi: The Cattolica reseach group

                  Raffaele Argiento
                raffaele.argiento@unicatt.it

                         Bicocca
                Milano, 24 Settembre 2020

                                               R. Argiento   Milano, 24 Settembre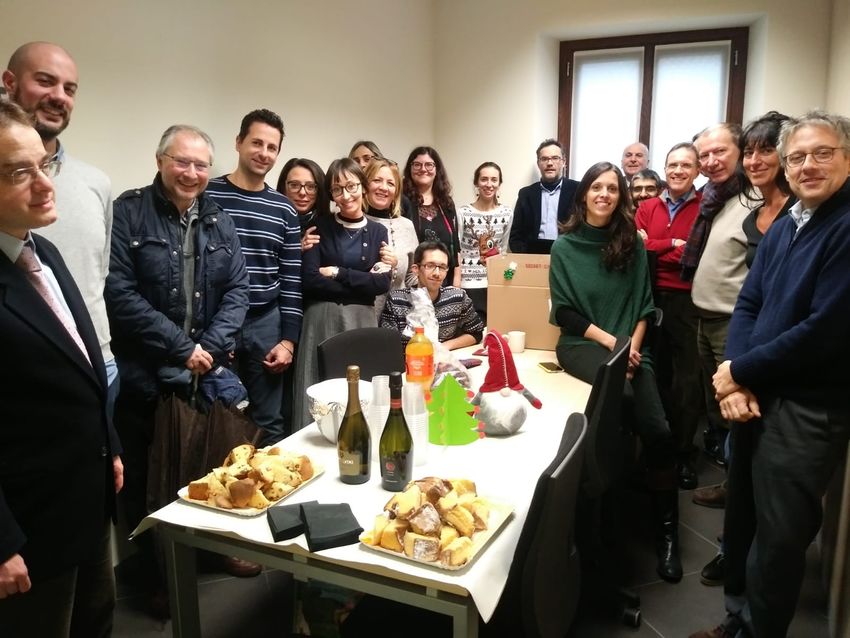
Presentazione ai dottorandi: The Cattolica reseach group

                  Raffaele Argiento
                raffaele.argiento@unicatt.it

                         Bicocca
                Milano, 24 Settembre 2020

                                               R. Argiento   Milano, 24 Settembre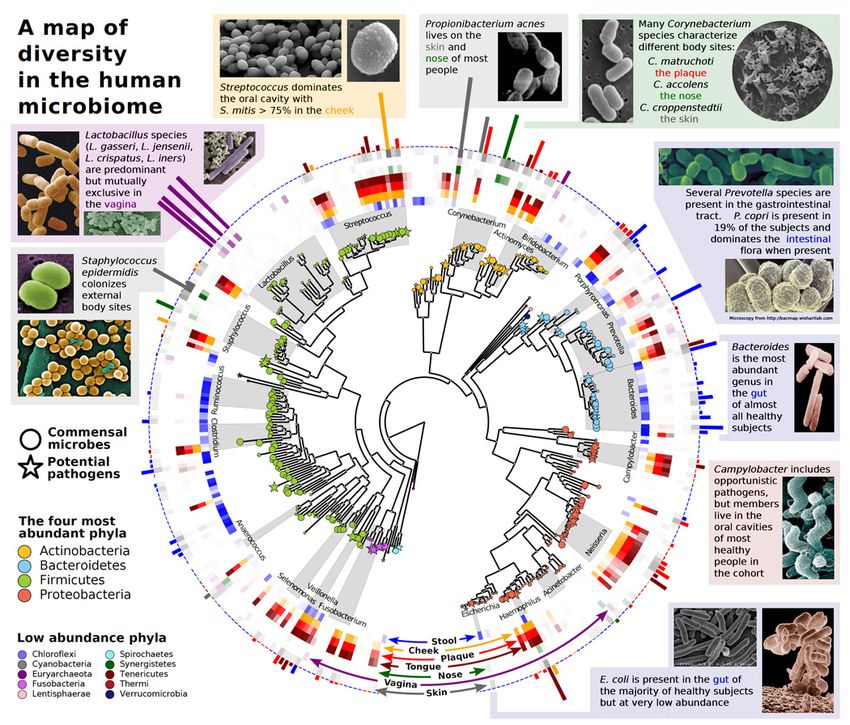
Applications: Biostatistics

Collaborations: Rice University & MD Anderson, TX USA – Na-
tional Univerisy of Singapore (NUS) – College of Public Healt,
National Taiwan University.

                                    R. Argiento   Milano, 24 Settembre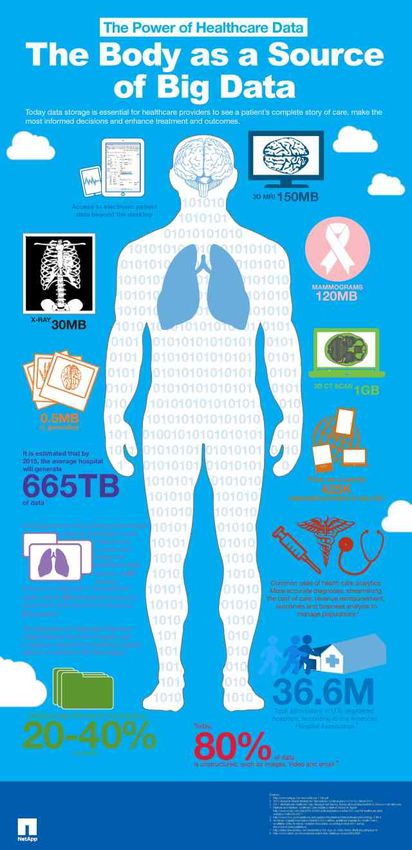
Applications: Biostatistics

                                   Collaborations: Rice University & MD Anderson, TX USA – Na-
                                   tional Univerisy of Singapore (NUS) – College of Public Healt,
                                   National Taiwan University.

Microbiome data: modelling the association
between bacteria taxa e nutrients

                                                                       R. Argiento   Milano, 24 Settembre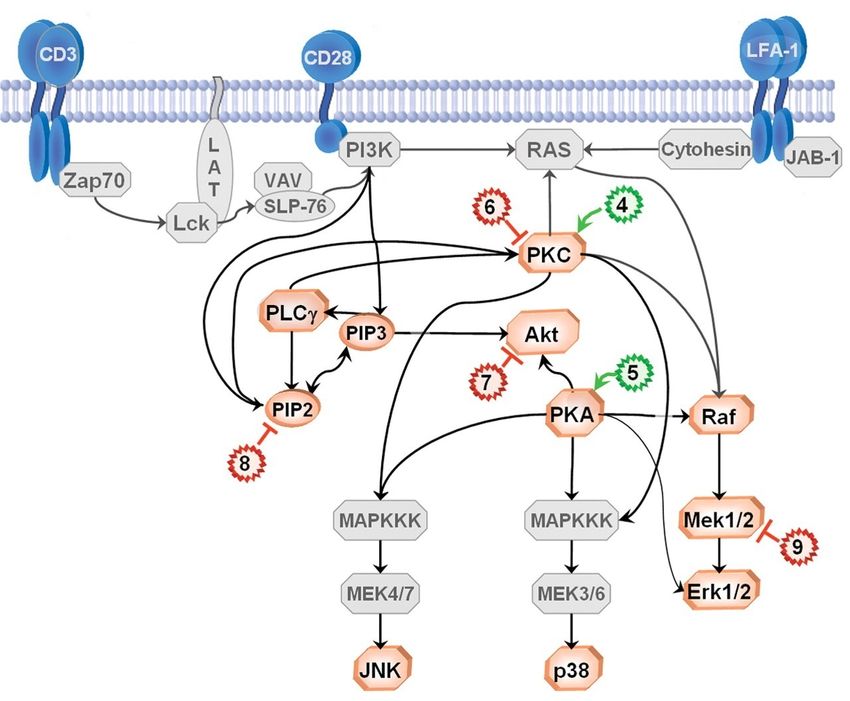
Applications: Biostatistics

                                   Collaborations: Rice University & MD Anderson, TX USA – Na-
                                   tional Univerisy of Singapore (NUS) – College of Public Healt,
                                   National Taiwan University.

Microbiome data: modelling the association        Population structure:      Genetic Diversity
between bacteria taxa e nutrients                 (subpopulations)

                                                                          R. Argiento   Milano, 24 Settembre
Applications: Biostatistics Data Privacy

                               Collaborations: University of Firenze – University of Modena e
                               Reggio Emilia – National Technical University of Athens.

Protein data: Discover relationship between
proteins, causal inference

                                                                   R. Argiento   Milano, 24 Settembre
Applications: Data Privacy

                               Collaborations: Università della Svizzera Italiana – Axa –

Protein data: Discover relationship between      Fraud detection: shorten the delay from the
proteins, causal inference                       occurrence of the fraud to its detection;

                                                                      R. Argiento   Milano, 24 Settembre
Applications: Sport Data & Healthcare

Collaborations: Kent University (UK) – Università di Torino – Po-
litecnico Milano – Victoria University, Melbourne (AUS)

                                                                    R. Argiento   Milano, 24 Settembre
Applications: Sport Data & Healthcare

 Collaborations: Kent University (UK) – Università di Torino – Po-
 litecnico Milano – Victoria University, Melbourne (AUS)

Sport analytics: performances predictions,
doping detection

                                                                     R. Argiento   Milano, 24 Settembre
Applications: Sport Data & Healthcare

 Collaborations: Kent University (UK) – Università di Torino – Po-
 litecnico Milano – Victoria University, Melbourne (AUS)

Sport analytics: performances predictions,         Avis data: Clustering donors for customized
doping detection                                   advertising

                                                                         R. Argiento   Milano, 24 Settembre
Applications: Atmospheric Environment
• Air pollution is a major global environmental
risk to human health (WHO, 2018)
• We are simultaneously exposed to a complex
mixture of air pollutants
• Moving toward a multi-pollutant approach to
air quality
R. Argiento Milano, 24 SettembreApplications: Atmospheric Environment
• Air pollution is a major global environmental
risk to human health (WHO, 2018)
• We are simultaneously exposed to a complex
mixture of air pollutants
• Moving toward a multi-pollutant approach to
air quality
4
• A better understanding of the
interactions between air pollutants is µg m3
2
critical
• Learning dependencies among
0
multiple time series
−2
C6H6 NO2 SO2 O3 PM2.5 BC
2014/01/01 2014/07/02 2014/12/09 2015/05/27 2016/01/14 2016/09/20 2017/04/30 2017/10/25 2018/04/05 2018/10/11
R. Argiento Milano, 24 SettembreMixture models in Bayesian nonparametrics
Hierarchical modelling
ind.
Y1 , ..., Yn |θ1 , ..., θn ∼ f (yi |θi )
i.i.d.
θ1 , ..., θn |P ∼ P
d P
P(·) = ∞ h=1 wh δτh (·)
R. Argiento Milano, 24 SettembreMixture models in Bayesian nonparametrics
Hierarchical modelling
ind.
Y1 , ..., Yn |θ1 , ..., θn ∼ f (yi |θi )
i.i.d.
θ1 , ..., θn |P ∼ P
d P
P(·) = ∞ h=1 wh δτh (·) ∼ Norm − CRM
Histogram of y
0.4
0.3
Density
0.20.1
0.0
−4 −2 0 2 4
y
R. Argiento Milano, 24 SettembreMixture models in Bayesian nonparametrics
Hierarchical modelling
ind.
Y1 , ..., Yn |θ1 , ..., θn ∼ f (yi |θi )
i.i.d.
θ1 , ..., θn |P ∼ P
d P
P(·) = ∞ h=1 wh δτh (·) ∼ Norm − CRM
Histogram of y
0.4
0.3
Density
0.20.1
0.0
−4 −2 0 2 4
y
R. Argiento Milano, 24 SettembreMixture models in Bayesian nonparametrics
Hierarchical modelling
ind.
Y1 , ..., Yn |θ1 , ..., θn ∼ f (yi |θi )
i.i.d.
θ1 , ..., θn |P ∼ P
d P
P(·) = ∞ h=1 wh δτh (·) ∼ Norm − CRM
Histogram of y
0.4
0.3
Density
0.20.1
0.0
−4 −2 0 2 4
y
R. Argiento Milano, 24 SettembreMixture models in Bayesian nonparametrics
Hierarchical modelling
ind.
Y1 , ..., Yn |θ1 , ..., θn ∼ f (yi |θi )
i.i.d.
θ1 , ..., θn |P ∼ P
d P
P(·) = ∞ h=1 wh δτh (·) ∼ Norm − CRM
Histogram of y
0.4
0.3
Density
0.20.1
0.0
−4 −2 0 2 4
y
R. Argiento Milano, 24 SettembreMixture models in Bayesian nonparametrics
Hierarchical modelling
ind.
Y1 , ..., Yn |θ1 , ..., θn ∼ f (yi |θi )
i.i.d.
θ1 , ..., θn |P ∼ P
d P
P(·) = ∞ h=1 wh δτh (·) ∼ Norm − CRM
Histogram of y
0.4
0.3
Density
0.20.1
0.0
−4 −2 0 2 4
y
R. Argiento Milano, 24 SettembreMixture models in Bayesian nonparametrics
Hierarchical modelling
ind.
Y1 , ..., Yn |θ1 , ..., θn ∼ f (yi |θi )
i.i.d.
θ1 , ..., θn |P ∼ P
d P
P(·) = ∞ h=1 wh δτh (·) ∼ Norm − CRM
Ongoing works
(a) Dependent processes Px , to include covariate information
(b) A general class of dependent models that encompasses many specific structures
(c) Scalable algorithms for fast inference
Selected Publications
• Argiento, R., Cremaschi, A. and Vannucci, M. (2019). “Hierarchical Normalized Completely Random Measures to Cluster Grouped Data”, Journal
of the American Statistical Association. Just accepted.
• Cremaschi, A., Argiento, R., Shoemaker, K., Peterson, C.B. and Vannucci M. (2019). “Hierarchical Normalized Completely Random Measures for
Robust Graphical Modeling”. Bayesian Analysis. Just accepted.
• Argiento R., Ruggiero, M. (2018). “Computational challenges and temporal dependence in Bayesian nonparametric models”, Statistical Methods
and Applications, Volume 27,
R. Argiento Milano, 24 SettembreGraphical modelling
Graph theory
1 1
G = (V, E)
6 6
• finite set of vertices
V = {1, . . . , q} 3 3
5 5
• subset of edges
2 2
E ⊆V ×V
4 4
Nodes ⇔ Random variables Figure: Directed (left) and undirected (right) graphs.
Edges ⇔ Probabilistic relationships
R. Argiento Milano, 24 SettembreGraphical modelling
Graph theory
1 1
G = (V, E)
6 6
• finite set of vertices
V = {1, . . . , q} 3 3
5 5
• subset of edges
2 2
E ⊆V ×V
4 4
Nodes ⇔ Random variables Figure: Directed (left) and undirected (right) graphs.
Edges ⇔ Probabilistic relationships
Graphical model
3 Family of probability distributions for the q random variables which factorizes according to
a given graph. 3 Conditional independencies are read from the graph.
R. Argiento Milano, 24 SettembreGraphical modelling
Graph theory
1 1
G = (V, E)
6 6
• finiteOngoing
set of vertices
works
V = {1, . . . , q} 3 3
5 5
(a) Objective Bayes Model Selection from Observational
• subset Data
of edges 2 2
E (b)
⊆ VMultiple
× V Graphical Models
(c) Estimate Causal effects using Directed Graphical Models
4 4
(c) Dependent graphs, spatio-temporal dependence to capture graphs relationships.
Nodes ⇔ Random variables Figure: Directed (left) and undirected (right) graphs.
Edges ⇔ Probabilistic relationships
Pubblicazioni recenti
• Castelletti, F. Consonni, G., Della Vedova, M. L. & Peluso, S. (2018). “Learning Markov equivalence classes of Directed Acyclic Graphs: an
GraphicalObjective
model Bayes Approach.” Bayesian Analysis 13, 1231–1256.
• Castelletti, F. & Consonni, G. (2019). “Objective Bayes model selection of Gaussian interventional essential graphs for the identification of
3 Family signaling pathways.” Annals of Applied Statistics, in-press
of probability distributions for the q random variables which factorizes according to
a given •graph.
Paci, L. & Consonni, G. (2019). “ Structural Learning of Contemporaneous Dependencies in Graphical VAR models”, Invited revision
3 Conditional independencies are read from the graph.
R. Argiento Milano, 24 SettembreScientific Events
• Applied Bayesian Statistical School.
• Scientific board of BaySM-Bayesian Young
Stitistician Meeting. Scientific chair della
prossima edizione.
• International Society for Bayesian Analysis -
ISBA
• Società Italiana di Statistica-SIS
R. Argiento Milano, 24 SettembreScientific Events
• Applied Bayesian Statistical School.
• Scientific board of BaySM-Bayesian Young
Stitistician Meeting. Scientific chair della
prossima edizione.
• International Society for Bayesian Analysis -
ISBA
• Società Italiana di Statistica-SIS
Lucia Paci, Alessia Pini, Raffaele Argiento,
Federico Castelletti, Stefano Peluso, Bruno
Buonaguidi, Guido Consonni
Grazie!
R. Argiento Milano, 24 SettembreYou can also read