Rapid climate change in the ocean west of the Antarctic Peninsula during the second half of the 20th century
←
→
Page content transcription
If your browser does not render page correctly, please read the page content below
GEOPHYSICAL RESEARCH LETTERS, VOL. 32, L19604, doi:10.1029/2005GL024042, 2005

Rapid climate change in the ocean west of the Antarctic Peninsula
during the second half of the 20th century
Michael P. Meredith and John C. King
British Antarctic Survey, Cambridge, UK
Received 11 July 2005; revised 30 August 2005; accepted 6 September 2005; published 7 October 2005.
[1] The climate of the Western Antarctic Peninsula                      and thus warmer WAP winters, whilst anomalously anti-
(WAP) is the most rapidly changing in the Southern                      cyclonic conditions are associated with decreased warm air
Hemisphere, with a rise in atmospheric temperature of                   advection and colder WAP winters [Marshall and King,
nearly 3°C since 1951 and associated cryospheric impacts.               1998]. The trend toward warmer WAP temperatures is thus
We demonstrate here, for the first time, that the adjacent              likely to have been accompanied by a shift toward more
ocean showed profound coincident changes, with surface                  cyclonic atmospheric circulation. An increase in precipita-
summer temperatures rising more than 1°C and a strong                   tion at WAP stations over 1956 – 1992 [Turner et al., 1997]
upper-layer salinification. Initially driven by atmospheric             is consistent with such a shift. Winter temperatures at the
warming and reduced rates of sea ice production, these                  WAP have been observed to be strongly dependent on
changes constitute positive feedbacks that will contribute              the extent of sea ice in the Bellingshausen Sea (west of the
significantly to the continued climate change. Marine                   Peninsula), and available evidence indicates that a reduc-
species in this region have extreme sensitivities to their              tion in sea ice extent coincided with the WAP warming
environment, with population and species removal predicted              [King, 1994; King and Harangozo, 1998; Turner et al.,
in response to very small increases in ocean temperature.               2005; Vaughan et al., 2003].
The WAP region is an important breeding and nursery                        [4] Given the dramatic changes in atmospheric condi-
ground for Antarctic krill, a key species in the Southern               tions at the WAP, the potential for changes in the adjacent
Ocean foodweb with a known dependence on the physical                   ocean is clear. This region is an important spawning ground
environment. The changes observed thus have significant                 for Antarctic krill, a key species in the Southern Ocean
ecological implications. Citation: Meredith, M. P., and J. C.           food web that was recently demonstrated to have a
King (2005), Rapid climate change in the ocean west of the              significant dependence on changes in the physical envi-
Antarctic Peninsula during the second half of the 20th century,         ronment [Atkinson et al., 2004]. Other marine species
Geophys. Res. Lett., 32, L19604, doi:10.1029/2005GL024042.              sampled in this region have also been shown to have
                                                                        extreme sensitivities to the physical ocean environment,
                                                                        with population and species removal predicted in response
1. Introduction                                                         to very small increases in temperature [Peck et al., 2004].
  [2] Three regions in the world have shown very rapid                  In this paper, we examine the climate change in the ocean
atmospheric warming during the second half of the last                  to the west of the Antarctic Peninsula during the second
century [Vaughan et al., 2003]. Of these, only one (the                 half of the twentieth century, and its implications.
Western Antarctic Peninsula; WAP) is in the Southern
Hemisphere. Annual mean atmospheric temperatures here
have risen nearly 3°C since 1951, with this warming                     2. Methods
occurring predominantly during the austral fall and winter                [5] We examined oceanographic changes in the region
(April to September) [King, 1994; King and Harangozo,                   west of the WAP using hydrographic data from two
1998; Turner et al., 2005]. The warming has had profound                recent compilations of ocean properties spanning the
consequences for the Antarctic Peninsula ice sheet, with a              second half of the twentieth century [Boyer et al., 2005;
recent study showing that the majority of glaciers have                 Levitus et al., 2005]. These were originally compiled by
retreated during the past 50 years, and that average retreat            the National Oceanographic Data Center, and interpolated
rates are accelerating [Cook et al., 2005].                             onto a 1 degree-square grid at standard depth levels. The
  [3] Coupled climate models (including those forced with               Southern Ocean is notoriously data-sparse, particularly
observed increases in greenhouse gases) generally fail to               during earlier eras; to protect the reliability of our results,
reproduce the WAP warming [King et al., 2004]. Investiga-               we omitted from consideration any (interpolated) gridpoints
tions into the cause of the WAP warming have been                       for which no actual measurements were used when com-
hampered by the lack of reliable information on atmospheric             piling the censuses, and derived decadal means using non-
circulation before the late 1970s. However, recent data have            overlapping data fields on the same grid and considering
shown a strong correlation between the atmospheric circu-               only fields which contained data from within the austral
lation in this region and WAP temperatures. Anomalously                 summer. (Strong seasonal bias exists in the timing of data
cyclonic conditions over the Amundsen-Bellingshausen                    collection, thus data presented here relate solely to the
region are associated with increased warm air advection                 austral summer). Whilst the distribution of times of data
                                                                        collection within the austral summer varied during the
Copyright 2005 by the American Geophysical Union.                       sequence of measurements, there was no systematic change
0094-8276/05/2005GL024042$05.00                                         in the timings such as could lead to apparent trends in ocean

                                                                  L19604                                                         1 of 5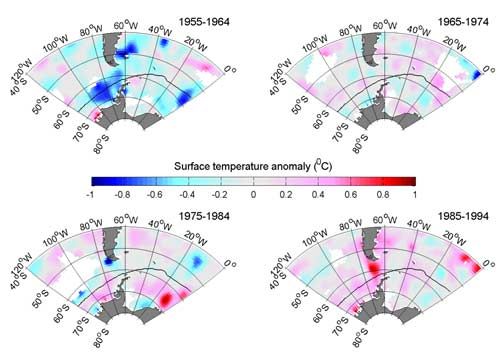
L19604                     MEREDITH AND KING: RAPID OCEAN CLIMATE CHANGE AT THE WAP                                                      L19604

                                                                         values for 4 years. The model was subjected to arbitrary sea
                                                                         ice production in a one-dimensional, unidirectional sense. To
                                                                         illustrate the key role of sea ice production, we ran the model
                                                                         with two configurations: firstly with unaltered forcings, and
                                                                         then with purposefully doubled sea ice production rates.

                                                                         3. Results
                                                                           [7] Decadal sea surface temperature anomalies (Figure 1)
                                                                         reveal a large cold anomaly in the Bellingshausen Sea,
                                                                         west of the Peninsula, during 1955– 64. This was around
                                                                         0.8°C colder than average, and extended through Drake
                                                                         Passage toward the South Atlantic. The annual mean air
                                                                         temperature at Faraday Station on the WAP was also
                                                                         anomalously low during this period ( 4.9°C (Table 1)),
                                                                         as was the average summer air temperature ( 0.1°C
Figure 1. Decadal means of summer surface temperature                    (Table 1)). The cold oceanic anomaly during this period
anomalies for the second half of the twentieth century.                  was not present subsequently, being replaced by succes-
Gridcells with no data are left white. Note the significant              sively warmer waters (Figure 1). The warming was
negative anomalies close to the Antarctic Peninsula during               surface-intensified (Figure 2), its magnitude decaying
the period 1955 – 64, a region that becomes progressively                virtually to zero by around 100 m depth. The warming
warmer during the sequence. The average September ice                    trend is very significant; it greatly exceeds those for the
extent for 1979– 2002 is plotted, derived from satellite                 deep Southern Ocean or the global ocean as a whole
microwave data as the 15% ice concentration limit using the              presented previously [Gille, 2002; Levitus et al., 2005],
Bootstrap algorithm [Comiso, 1995].                                      and indicates that the rapid climate change observed in
                                                                         this region is not restricted to the atmosphere.
                                                                           [8] Although there are fewer reliable salinity data, it is
properties. The number of casts used to create each decadal              clear that the upward trend in temperature in the Belling-
field in the WAP region (here taken as 60 – 75°S, 60 –                   shausen Sea was accompanied by a trend toward higher
100°W) are 217 (1955 – 64), 260 (1965– 74), 505 (1975 –                  summer salinity (Figure 3). This was also strongly surface
84) and 425 (1985 – 94). Further details of the hydrographic             intensified (Figure 3). The greatest change in surface
data used are available at http://www.nodc.noaa.gov/OC5/                 salinity west of the Peninsula during the second half of
WOA01/pr_woa01.html.                                                     the twentieth century was greater than 0.25. The magni-
  [6] A mixed layer model [Meredith et al., 2004; Price et               tude of this change exceeds even the remarkable change in
al., 1986] was created to illustrate the key role of sea ice             salinity observed in the Ross Sea during the same period
production in determining upper ocean properties. The upper              (around 0.1– 0.15 [Jacobs et al., 2002]), although notably
200 m of an idealized ocean was simulated, using initial                 with the opposite sign and an influence over a shallower
ocean conditions from hydrographic data collected at the                 depth range.
WAP [Meredith et al., 2004] and surface forcing derived                    [9] The trend toward higher surface salinity in the Bel-
from meteorological data obtained at the WAP. For each                   lingshausen Sea during summer is consistent with the
timestep, three criteria for vertical stability were applied;            previous observation of decreasing winter sea ice extent.
these depend on static stability, the bulk Richardson number             The key role of sea ice production in explaining these
criterion, and the gradient Richardson number criterion.                 changes is shown in the mixed-layer model runs. During
Following this, vertical advection and vertical turbulent                austral winter (the time of highest seasonal salinities), the
mixing were applied. Vertical advection is permitted in the              model run with increased ice production showed marginally
model, but horizontal advection and mesoscale variability                higher surface salinities than the run with standard ice
are not. Wind stress is applied as a vector to allow shear at            production, as a consequence of greater brine rejection
the base of the mixed layer to influence the mixing. The                 (Figure 4, upper panel). This enhanced sea ice formation
model was run with monthly-mean (seasonally repeating)                   stores extra freshwater in solid form at the sea surface,

          Table 1. Decadal Means of Annual, Winter (June – August) and Summer (December – February) Air Temperatures
          (°C) at Faraday on the Western Antarctic Peninsula. Also Shown Are Decadal Sea Surface Temperature (SST) and
          Sea Surface Salinity (SSS) Anomalies at 65°S, 70°Wa
                                                Air Temperature
          Decade                Annual              Winter              Summer               SST Anomaly                SSS Anomaly
          1955 – 64                4.9                10.6                 0.1                     0.7                       0.09
          1965 – 74                3.5                7.6                 +0.3                    0.0                        0.03
          1975 – 84                4.3                9.5                 +0.3                    +0.1                      +0.01
          1985 – 94                3.3                7.2                 +0.8                    +0.5                      +0.09
          1995 – 04                2.6                5.7                 +0.8
            a
             Note the period of low atmospheric temperatures during the late 1950s/early 1960s and the progressive warming thereafter,
          coincident with the warming of the surface ocean west of the Peninsula.

                                                                    2 of 5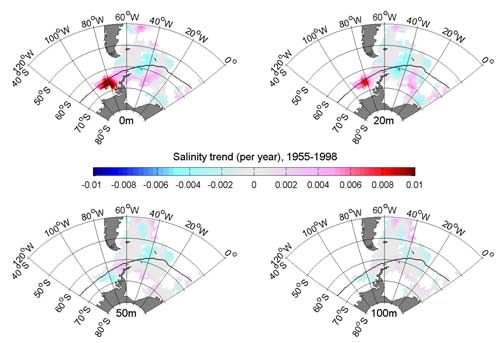
L19604 MEREDITH AND KING: RAPID OCEAN CLIMATE CHANGE AT THE WAP L19604
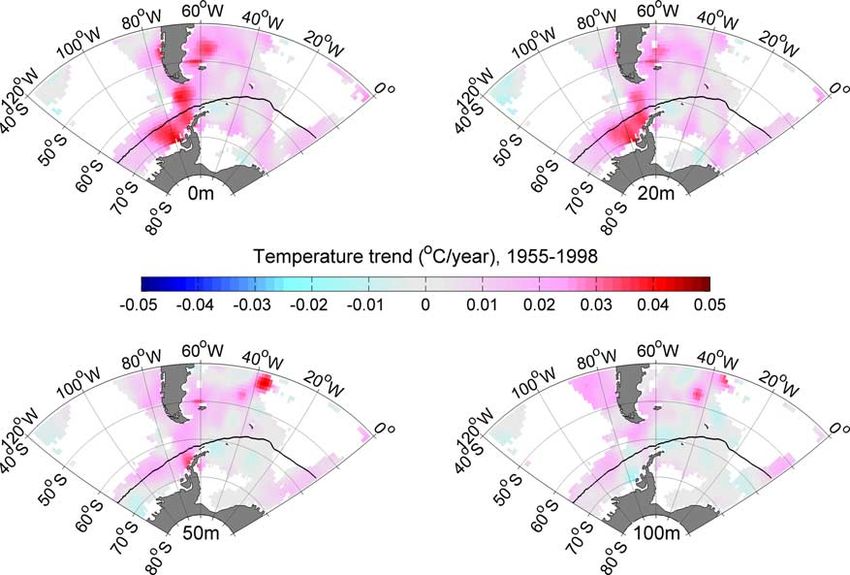
Figure 2. Trends in ocean summer temperature during 1955 –1998, for four different depth levels (surface, 20 m, 50 m
and 100 m). Gridcells with no data are left white. Note that the significant warming trend observed close to the Antarctic
Peninsula is strongly surface-intensified, decaying virtually to zero at 100 m depth.
however the rejected brine is distributed over the full depth Thus, for the surface waters, the summertime freshening
of the winter mixed layer. Consequently, the difference in caused by enhanced sea ice melt greatly outweighs the
surface salinity between the two model runs is not very salinification caused by the enhanced sea ice formation the
large at this time of year. The following summer, the previous winter (Figure 4). This process explains the fresher
melting of the extra sea ice formed adds significant extra nature of the surface ocean during 1955 – 64, when ice
freshwater at the surface. This stabilises the water column, formation was especially strong in the Bellingshausen Sea
thus the freshwater anomaly tends to be retained near the
surface and the freshening effect at this level is very strong.
Figure 4. Results from the PWP mixed layer model.
Upper panel is surface salinity; lower panel is salinity at
Figure 3. As for Figure 2, but for salinity. Note that the 50 m, both as a function of time. Solid line is for model
significant trend toward higher salinity west of the Antarctic run under standard forcings (the control run); dashed line
Peninsula is strongly surface-intensified. Surface salinities is same but with arbitrarily doubled sea ice production.
in the region of highest trend increased by over 0.25 during Winter (W) and summer (S) conditions are marked. The
the second half of the twentieth century. origin of the horizontal axis is the turn of the year.
3 of 5L19604 MEREDITH AND KING: RAPID OCEAN CLIMATE CHANGE AT THE WAP L19604
[King and Harangozo, 1998], and the subsequent trend believed to favour cold water, however the possible
toward higher salinities as ice formation decreased. The influences of changes in ocean temperature were not
lower panel of Figure 4 shows that the effect of this process considered. Our results suggest that, for the depth range
decreases significantly with depth, in accord with the of relevance to krill, major oceanographic changes have
observations. occurred in one of their key spawning and nursery areas
during the second half of the twentieth century. If ocean
temperatures continue to rise, and sea ice formation
4. Discussion decreases further, it is very possible that the krill popula-
[10] The explanations we have presented for the observed tion will see significant further declines. This has broader
changes are essentially one-dimensional, and do not invoke implications for the regional-scale ecosystem, for which
changing circulation of either ocean or ice to explain the krill is a key species. From analysis of samples collected
observations. Clearly changes in circulation can occur, but between 8 and 15 m depth at the WAP, it is known that
they are apparently not the critical factor in explaining the other species in this region are very sensitive to changes in
observed trends. For example, sea ice drift in the Belling- ocean temperature, due to a loss of aerobic capacity as
shausen Sea is less persistent than in the strong gyres of the warming occurs [Peck et al., 2004]. It was suggested that
Weddell and Ross Seas [Stammerjohn et al., 2003]. Once the majority of Antarctica’s benthic species would be at
formed, advection will act to move oceanic anomalies out of risk of at least population level losses from only a 1– 2°C
the WAP region. However, the forcings for the ocean trends increase in local summer ocean temperatures [Peck et al.,
(from the atmosphere and cryosphere) remain in the area of 2004].
the WAP, thus the ocean anomalies will always be strongest [15] Our work has shown that changes of a magnitude
here. Air/sea/ice interaction will progressively erode these significant to the operation of the ecosystem are conceivable
anomalies as they advect away from the region. at the WAP over just a few decades, and are already
[11] Note that we explain the observed oceanographic underway. Further, we have shown that the changes in
trends as surface-induced responses to atmospheric and ocean properties, with higher temperatures and higher
cryospheric changes. Other possible theories, such as en- salinities, both act as positive feedbacks. Consequently,
hanced upwelling of underlying warmer waters, do not we conclude that the ocean is acting to sustain and amplify
explain the observations, in particular the surface intensifi- the atmospheric and cryospheric changes, making serious
cation of the trends. The pattern of response is consistent impacts on the marine ecosystem even more likely.
with a trend toward increasingly cyclonic atmospheric
conditions in the region, as inferred previously [Marshall [16] Acknowledgments. We thank colleagues at NODC concerned
and King, 1998]. with the compilation and provision of the hydrographic data used here,
particularly Tim Boyer and Sydney Levitus. We thank Angus Atkinson,
[12] Significant feedbacks will be induced from the David Vaughan, Chris Rapley and other colleagues at BAS for useful
oceanic trends. Both the temperature and salinity trends discussions and input. The comments of two reviewers helped strengthen
are in a direction that will act to reduce future sea ice this paper. This study was funded by the U.K. Natural Environment
Research Council, and is a contribution of the BAS ACES and Discovery-
production. Since a reduction in ice cover was important in 2010 programmes.
the instigation of these trends, they thus constitute positive
feedbacks acting to promote further warming and salinifi- References
cation of the summer ocean surface. The magnitudes of Atkinson, A., V. Siegel, E. Pakhomov, and P. Rothery (2004), Long-term
these feedbacks are very significant: a 1°C warming of the decline in krill stock and increase in salps within the Southern Ocean,
upper 25 m of the water column is equivalent to the energy Nature, 432, 100 – 103.
Boyer, T. P., S. Levitus, J. I. Antonov, R. A. Locarnini, and H. E. Garcia
required to form about 0.3 m of sea ice. This is a large (2005), Linear trends in salinity for the World Ocean, 1955 – 1998, Geo-
fraction of the winter ice thickness in the Bellingshausen phys. Res. Lett., 32, L01604, doi:10.1029/2004GL021791.
Sea (typically 0.5 – 1.0 m [Timmermann et al., 2004]). Comiso, J. C. (1995), SSM/I concentrations using the bootstrap algorithm,
NASA Tech. Rep., 1380, 40 pp.
Consequently, the observed warming of the ocean in sum- Cook, A. J., A. J. Fox, D. G. Vaughan, and J. G. Ferrigno (2005), Retreat-
mer will have contributed very significantly to a reduction ing glacier fronts on the Antarctic Peninsula over the past half-century,
in winter sea ice extent, and, in turn, to the rapid atmo- Science, 308, 541 – 544.
Gille, S. T. (2002), Warming of the Southern Ocean since the 1950s,
spheric warming that has been observed in this region Science, 295, 1275 – 1277.
during winter. Jacobs, S. S., C. F. Giulivi, and P. A. Mele (2002), Freshening of the Ross
[13] There are other significant cryospheric impacts of Sea during the late 20th century, Science, 297, 386 – 389.
these findings. For example, it was shown recently that the King, J. C. (1994), Recent climate variability in the vicinity of the Antarctic
Peninsula, Int. J. Climatol., 14, 357 – 369.
majority of glaciers on the Antarctic Peninsula are retreat- King, J. C., and S. A. Harangozo (1998), Climate change in the western
ing, and that the retreat rates are accelerating [Cook et al., Antarctic Peninsula since 1945: Observations and possible causes, Ann.
2005]. Other works have shown that the melt rates of Glaciol., 27, 571 – 575.
King, J. C., J. Turner, G. J. Marshall, W. M. Connolley, and T. A.
glaciers depend critically on the temperature of the ocean Lachlan-Cope (2004), Antarctic Peninsula climate variability and its
that they are in contact with [Shepherd et al., 2004]. causes as revealed by analysis of instrumental records, in Antarctic
Consequently, our findings of very strong surface warming Peninsula Climate Variability: A Historical and Paleoenvironmental
Perspective, edited by E. Domack et al., pp. 17 – 30, AGU, Washington,
and positive ocean feedbacks have significant implications D. C.
for the future of the ice sheet in this region. Levitus, S., J. Antonov, and T. Boyer (2005), Warming of the world
[14] Antarctic krill populations in the Southern Ocean ocean, 1955 – 2003, Geophys. Res. Lett., 32, L02604, doi:10.1029/
have declined since the 1970s, and it was argued recently 2004GL021592.
Marshall, G. J., and J. C. King (1998), Southern Hemisphere circulation
that changes in sea ice formation and distribution were anomalies associated with extreme Antarctic Peninsula winter tempera-
important for this [Atkinson et al., 2004]. Krill are tures, Geophys. Res. Lett., 25, 2437 – 2440.
4 of 5L19604 MEREDITH AND KING: RAPID OCEAN CLIMATE CHANGE AT THE WAP L19604
Meredith, M. P., I. A. Renfrew, A. Clarke, J. C. King, and M. A. Brandon sea ice – ocean model, J. Geophys. Res., 109, C07017, doi:10.1029/
(2004), Impact of the 1997/98 ENSO on the upper waters of Marguerite 2003JC002242.
Bay, western Antarctic Peninsula, J. Geophys. Res., 109, C09013, Turner, J., S. R. Colwell, and S. Harangozo (1997), Variability of pre-
doi:10.1029/2003JC001784. cipitation over the coastal western Antarctic Peninsula from synoptic
Peck, L. S., K. E. Webb, and D. M. Bailey (2004), Extreme sensitivity observations, J. Geophys. Res., 102, 13,999 – 14,007.
of biological function to temperature in Antarctic marine species, Turner, J., S. R. Colwell, G. J. Marshall, T. A. Lachlan-Cope, A. M.
Functional Ecol., 18, 625 – 630. Carleton, P. D. Jones, V. Lagun, P. A. Reid, and S. Iagovinka (2005),
Price, J. F., R. A. Weller, and R. Pinkel (1986), Diurnal cycling: Observa- Antarctic climate change during the last 50 years, Int. J. Climatol., 25,
tions and models of the upper ocean response to diurnal heating, cooling 279 – 294.
and wind mixing, J. Geophys. Res., 91, 8411 – 8427. Vaughan, D. G., G. J. Marshall, W. M. Connolley, C. Parkinson,
Shepherd, A., D. Wingham, and E. Rignot (2004), Warm ocean is eroding R. Mulvaney, D. A. Hodgson, J. C. King, C. J. Pudsey, and J. Turner
West Antarctic Ice Sheet, Geophys. Res. Lett., 31, L23402, doi:10.1029/ (2003), Recent rapid regional climate warming on the Antarctic Peninsula,
2004GL021106. Clim. Change, 60, 243 – 274.
Stammerjohn, S. E., M. R. Drinkwater, R. C. Smith, and X. Liu (2003),
Ice-atmosphere interactions during sea-ice advance and retreat in the
western Antarctic Peninsula region, J. Geophys. Res., 108(C10),
3329, doi:10.1029/2002JC001543.
Timmermann, R., A. Worby, H. Goosse, and T. Fichefet (2004), Utilizing M. P. Meredith and J. C. King, British Antarctic Survey, High Cross,
the ASPeCt sea ice thickness data set to evaluate a global coupled Madingley Road, Cambridge CB3 0ET, UK. (mmm@bas.ac.uk)
5 of 5You can also read