Reactivation of latent tuberculosis through modulation of resuscitation promoting factors by diabetes
←
→
Page content transcription
If your browser does not render page correctly, please read the page content below
www.nature.com/scientificreports
OPEN Reactivation of latent
tuberculosis through modulation
of resuscitation promoting factors
by diabetes
Arpana Verma1, Maninder Kaur1, Lakshya Veer Singh2, Divya Aggarwal3, Indu Verma1,
Bishan D. Radotra3 & Sadhna Sharma1*
The evidence of an association between diabetes and latent tuberculosis infection (LTBI) remains
limited and inconsistent. Thus, the study aims to delineate the role of diabetes in activation of latent
tuberculosis infection. Murine model of latent tuberculosis and diabetes was developed, bacillary load
and gene expression of resuscitation promoting factors (rpfA-E) along with histopathological changes
in the lungs and spleen were studied. Treatment for LTBI [Rifampicin (RIF) + Isoniazid (INH)] was also
given to latently infected mice with or without diabetes for 4 weeks. Diabetes was found to activate
latent tuberculosis as the colony forming unit (CFU) counts were observed to be > 104 in lungs and
spleen. The gene expression of hspX was downregulated and that of rpfB and rpfD was observed to be
upregulated in latently infected mice with diabetes compared to those without diabetes. However,
no significant reduction in the CFU counts was observed after 4 weeks of treatment with RIF and
INH. Diabetes helps in the progression of LTBI to active disease mainly through altered expression
of resuscitation promoting factors rpfB and rpfD, which can serve as important targets to reduce the
shared burden of tuberculosis and diabetes.
Mycobacterium tuberculosis infects nearly 25% of the world’s population out of which only 5–10% develop active
disease while 90–95% people live with clinically asymptomatic latent tuberculosis infection (LTBI). This accounts
for a huge reservoir of LTBI infected individuals1. Latent form of M. tuberculosis has slow replication rates and
is metabolically less active relative to its active f orm2,3. M. tuberculosis is able to survive in oxygen deprived
environment through altered gene expression, modulated metabolic pathways and switch over to anaerobic
respiration4–10. All these adaptations contribute to the development of LTBI in humans. However, the compro-
mised state of immune system as in HIV, undernutrition, smoking and diabetes, imbalances this equilibrium
leading to reactivation of LTBI and progression to active disease.
Diabetes mellitus (DM) is among the top three common risk factor for tuberculosis along with HIV and
undernutrition11. Diabetic patients are two times more susceptible to develop TB as compared to non-diabetics
and this alliance is more substantial in HIV-positive p atients12. Diabetes increases early mortality risk among
TB patients, irrespective of their HIV s tatus13. Presently, the exact mechanisms behind tuberculosis and diabetes
association are unclear. Exogenous factors primarily control the acquisition of infection whereas immune insuf-
ficiency plays a pivotal role in the reactivation of disease14. TB diabetes has become an impending co-epidemic
and reasons for this could be rise in diabetes and unawareness of people about its risk, huge reservoir of LTBI
and active tuberculosis15.
Studies on growth of M. tuberculosis cultures under hypoxia combined with genetic analysis have illustrated
an amplified expression of a 16 kDa α-crystallin homolog protein. Apart from this, resuscitation promoting
factors (RPFs) of M. tuberculosis have been shown to stimulate the growth of dormant mycobacteria. Mycobac-
terium tuberculosis consists of five rpf genes i.e. rpfA (Rv0867c), rpfB (Rv1009), rpfC (Rv1884c), rpfD (Rv2389c)
and rpfE (Rv2450c) with lysozyme activity that aid in reactivation via hydrolysis of the p eptidoglycans16,17.
Since diabetes is known to play an important role in activating latent tuberculosis, it is necessary to study the
1
Department of Biochemistry, Postgraduate Institute of Medical Education and Research, Chandigarh,
India. 2TACF, International Centre for Genetic Engineering and Biotechnology, New Delhi, India. 3Department
of Histopathology, Postgraduate Institute of Medical Education and Research, Chandigarh, India. *email:
sadhnabiochem@gmail.com
Scientific Reports | (2021) 11:19700 | https://doi.org/10.1038/s41598-021-99257-1 1
Vol.:(0123456789)
www.nature.com/scientificreports/
Figure 1. CFU enumeration of M. tuberculosis H37Rv in latent tuberculosis after diabetes development.
Log10 CFU counts in lungs and spleen of mice from Group-I, Group-II and Group-III at different time points
of streptozotocin treatment. (A) Lungs after 9 weeks (B) Spleen after 9 weeks (C) Lungs after 13 weeks (D)
Spleen after 13 weeks of streptozotocin treatment. The data were represented as Mean ± SE of 5 animals in each
group and the statistical significance was determined by Mann–Whitney test. **p ≤ 0.01, *p ≤ 0.05. Group-I:
latent tuberculosis only, Group-II: latent tuberculosis with diabetes and Group-III: latent tuberculosis with
immunosuppression. Animal model was developed only once but CFU enumeration was done in triplicates
from each animal.
role of various rpf genes and other associated genes in order to elucidate the mechanism of activation of latent
tuberculosis in diabetes.
Therefore, an animal model of latent tuberculosis and diabetes was used to study the effect of diabetes on
latent tuberculosis activation and its treatment outcome.
Results
Diabetes increased the bacillary load in latent TB mice. Murine model of latent tuberculosis was
successfully developed as the CFU counts were
www.nature.com/scientificreports/

                                  Figure 2.  Histological examination of lung morphology to assess the presence of granulomas. After diabetes
                                  development, Hematoxylin & Eosin staining was performed on lung tissue of mice from Group-I, II and III at
                                  week 9 and 13 of streptozotocin treatment. Lung section of (A) Group-I mice (B) Group-II mice (C) Group-III
                                  mice after 9 weeks; Lung section of (D) Group-I mice (E) Group-II mice (F) Group-III mice after 13 weeks of
                                  streptozotocin treatment. Arrows indicate granulomas (A,D) and inflammation (B,C,E,F). Images were taken at
                                  20× magnification. Group-I: latent tuberculosis only, Group-II: latent tuberculosis with diabetes and Group-III:
                                  latent tuberculosis with immunosuppression.

                                  the lung tissue of Group-III animals, lymphocytic infiltration was observed (Fig. 2F). The level of significance
                                  between Group-I, II and III for granuloma formation, peribronchiolitis and perivasculitis at week 9 and 13 is
                                  given in Table 1. However, no changes were found in the spleen in all groups at week 9 and 13 of diabetes induc-
                                  tion.

                                  Reactivation of M. tuberculosis by resuscitation promoting factors. The expression of hspX gene
                                  was significantly downregulated in latent tuberculosis with immunosuppression group as compared to latent
                                  tuberculosis only group which signifies the activation from latency at week 9 (Fig. 3A). However, the expres-
                                  sion of all the resuscitation promoting factor (rpf) genes was found to be significantly downregulated in latent
                                  tuberculosis with immunosuppression group (Group-III) as compared to latent tuberculosis only (Group-I)
                                  and latent tuberculosis with diabetes group (Group-II) at week 9 (Fig. 3B–F). Moreover, no significant change
                                  was observed in the expression of any of the genes mentioned above in latent tuberculosis with diabetes group
                                  as compared to latent tuberculosis only group after 2 weeks of diabetes development i.e. week 9, indicating that
                                  Group-II is behaving similar to Group-I (Fig. 3A–F). However, at week 13, a significant decrease was observed
                                  in the expression of hspX gene in latent tuberculosis with diabetes group (Group-II) as well as in latent tuber-
                                  culosis with immunosuppression group (Group-III) as compared to latent tuberculosis only group (Group-I).
                                  No significant difference was observed in the expression of hspX between Group-II and Group-III (Fig. 4A).

Scientific Reports |   (2021) 11:19700 |              https://doi.org/10.1038/s41598-021-99257-1                                                 3

                                                                                                                                            Vol.:(0123456789)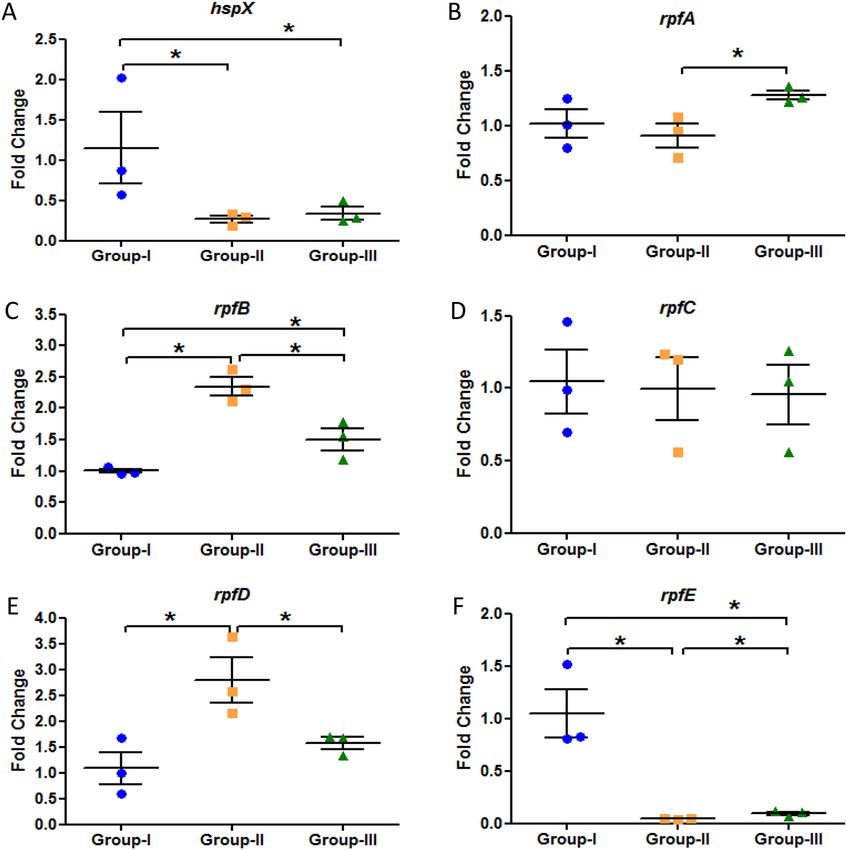
www.nature.com/scientificreports/

                                                                                                       Level of significance for different group comparisons
                                               Group-I (mean     Group-II (mean     Group-III (mean    Group-I vs Group-II    Group-I vs Group-      Group-II vs Group-
           Histological features Time points   score ± SE)       score ± SE)        score ± SE)        (p-value)              III (p-value)          III (p-value)
                                 Week 9        3.33 ± 0.33       0.33 ± 0.33        0.00 ± 0.00        *0.05                  *0.05                  ns
           Granuloma formation
                                 Week 13       4.66 ± 0.33       0.00 ± 0.00        0.00 ± 0.00        *0.05                  *0.05                  ns
                                 Week 9        3.33 ± 0.33       1.33 ± 0.33        2.00 ± 0.57        *0.05                  ns                     ns
           Peribronchiolitis
                                 Week 13       3.66 ± 0.33       4.33 ± 0.66        1.33 ± 0.33        ns                     *0.05                  *0.05
                                 Week 9        2.66 ± 0.33       2.33 ± 0.33        1.66 ± 0.33        ns                     ns                     ns
           Perivasculitis
                                 Week 13       3.33 ± 0.33       4.33 ± 0.33        1.33 ± 0.33        ns                     *0.05                  *0.05

                                               Table 1.  Comparative histological scoring of different study groups. Mean score was calculated from 3
                                               animals in each group. The data was represented as Mean ± SE of 3 animals in each group and the statistical
                                               significance was determined by Mann–Whitney test. *p ≤ 0.05. ns-non-significant. Group-I: latent tuberculosis
                                               only, Group-II: latent tuberculosis with diabetes and Group-III: latent tuberculosis with immunosuppression.

                                               Figure 3.   Expression analysis of various genes in the lungs of Group-I, Group-II and Group-III mice after
                                               9 weeks of streptozotocin treatment. Gene expression of (A) hspX (B) rpfA (C) rpfB (D) rpfC (E) rpfD (F)
                                               rpfE. The data were represented as Mean ± SE of 3 animals in each group and the statistical significance was
                                               determined by Mann–Whitney test. *p ≤ 0.05. Group-I: latent tuberculosis only, Group-II: latent tuberculosis
                                               with diabetes and Group-III: latent tuberculosis with immunosuppression. Animal model was developed only
                                               once but gene expression was studied in triplicates from each animal.

          Scientific Reports |    (2021) 11:19700 |                https://doi.org/10.1038/s41598-021-99257-1                                                             4

Vol:.(1234567890)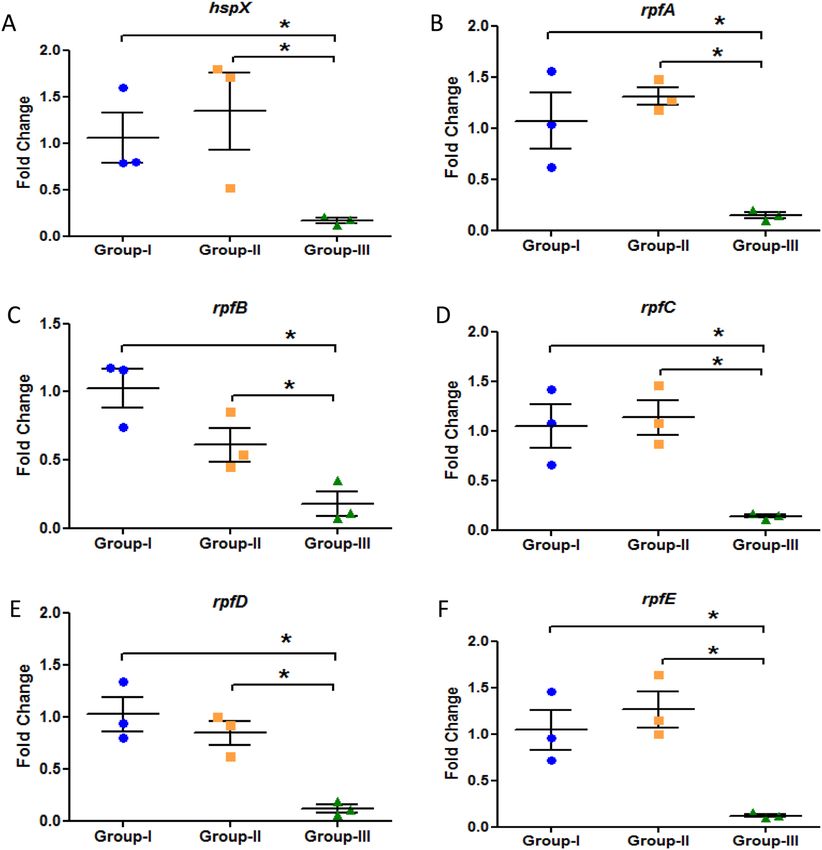
www.nature.com/scientificreports/
Figure 4. Expression analysis of various genes in the lungs of Group-I, Group-II and Group-III mice after
13 weeks of streptozotocin treatment. Gene expression of (A) hspX (B) rpfA (C) rpfB (D) rpfC (E) rpfD (F)
rpfE. The data were represented as Mean ± SE of 3 animals in each group and the statistical significance was
determined by Mann–Whitney test. *p ≤ 0.05. Group-I: latent tuberculosis only, Group-II: latent tuberculosis
with diabetes and Group-III: latent tuberculosis with immunosuppression. Animal model was developed only
once but gene expression was studied in triplicates from each animal.
A significant increase was observed in the expression of rpfB gene i.e. approximately 2.3-fold, and rpfD gene,
i.e. 2.8-fold in latently infected animals having diabetes as compared to animals having latent tuberculosis only
(Fig. 4C,E). In latent tuberculosis with immunosuppression group also, around 1.5-fold increase was observed
in the expression of rpfB gene as compared to latent tuberculosis only group but the expression was significantly
decreased when compared to Group-II (Fig. 4C). The expression of rpfA gene was found to be upregulated in
Group-III as compared to Group-II and the expression of rpfC gene remained same in all the groups whereas
the gene expression of rpfE was found to be significantly downregulated in both Group-II and Group-III as
compared to Group-I (Fig. 4B,D,F). It was observed that at earlier time point (week 9) Group-II behaved like
Group-I but with increase in time duration (week 13), Group-II behaved similar to Group-III which indicates
that the duration of hyperglycemia plays a vital role in modulating the expression of different resuscitation and
dormancy associated genes. These findings suggest that diabetes promotes resuscitation of latent bacilli through
rpfB and rpfD and thus favours its activation.
Diabetes had no effect on treatment outcome. INH + RIF therapy had no effect on the bacillary loads
in lungs of latently infected animals with or without diabetes. Although a significant decrease in log10 CFU/mL
in spleen was observed after therapy in both latent tuberculosis only treated with INH + RIF (Group-Ib) and
latent tuberculosis with diabetes treated with INH + RIF (Group-IIb) as compared to latent tuberculosis only,
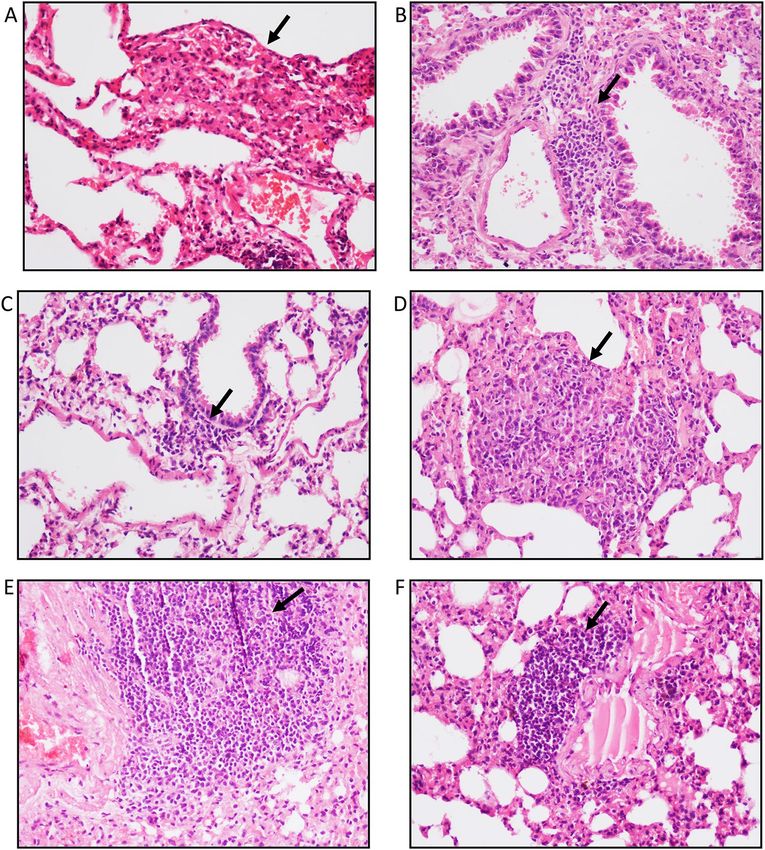
untreated (Group-Ia) and latent tuberculosis with diabetes, untreated (Group-IIa) respectively (Fig. 5A,B). After
4 weeks of treatment, granulomas were observed in lung tissues of Group-Ia (Mean score-4.66) and Group-Ib
animals (Mean score-1.33) (Fig. 6A,B). In Group-IIa inflammation (Mean score-4.33) was observed but no
granulomas were seen whereas in Group-IIb, histiocytic collection was seen and granuloma formation was
observed (Mean score-0.33) (Fig. 6C,D). However, the changes were non-significant between untreated and
Scientific Reports | (2021) 11:19700 | https://doi.org/10.1038/s41598-021-99257-1 5
Vol.:(0123456789)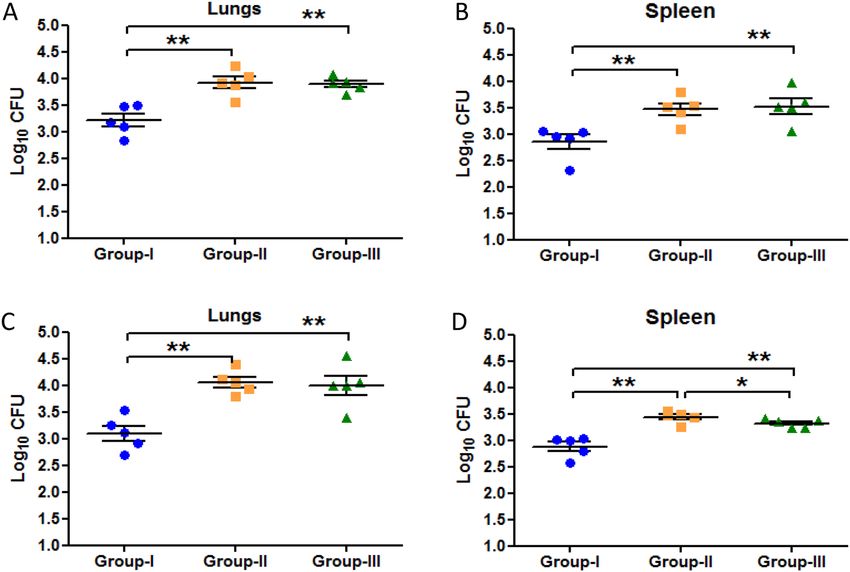
www.nature.com/scientificreports/
Figure 5. CFU comparison between untreated and treated groups. Log10 CFU counts in lungs and spleen of
untreated and INH + RIF treated latent tuberculosis and latent tuberculosis with diabetes group (A) Lungs
(B) Spleen. The data were represented as Mean ± SE of 5 animals in each group and the statistical significance
was determined by Mann–Whitney test. *p ≤ 0.05. Group-Ia: latent tuberculosis untreated, Group-Ib: latent
tuberculosis treated with INH + RIF, Group-IIa: latent tuberculosis with diabetes untreated, Group-IIb:
latent tuberculosis with diabetes treated with INH + RIF. Animal model was developed only once but CFU
enumeration was done in triplicates from each animal.
Figure 6. Histological examination of lung morphology to assess the presence of granulomas in untreated
and treated groups. Hematoxylin & Eosin staining was performed on lung tissue sections of untreated and
INH + RIF treated latent tuberculosis and latent tuberculosis with diabetes group. Lung section of (A) Group-Ia
animals (B) Group-Ib animals (C) Group-IIa animals (D) Group-IIb animals after 4 weeks of treatment. Arrows
indicate granulomas in lung sections (A,B,D) and inflammation (C). Images were taken at 20× magnification
Group-Ia: latent tuberculosis untreated, Group-Ib: latent tuberculosis treated with INH + RIF, Group-IIa: latent
tuberculosis with diabetes untreated, Group-IIb: latent tuberculosis with diabetes treated with INH + RIF.
treated groups. Moreover, a significant decrease in the expression of hspX gene was observed in Group-Ib as
compared to Group-Ia but no significant change was observed in the expression between Group-IIa and Group-
IIb (Fig. 7A). The expression of rpfB and rpfD was found to be significantly downregulated in Group-IIb as
compared to Group-IIa but no change was observed in its expression between Group-Ia and Ib (Fig. 7E). The
expression of rpfE was found to be significantly downregulated in latent tuberculosis treated group as compared
to latent tuberculosis untreated group and expression was significantly upregulated in latent tuberculosis with
diabetes treated group as compared to latent tuberculosis with diabetes untreated group (Fig. 7F). However,
no significant changes were observed in the expression of rpfA and rpfC between untreated and treated groups
(Fig. 7B,D). The results indicate that after treatment, observations of the latent tuberculosis with diabetes group
Scientific Reports | (2021) 11:19700 | https://doi.org/10.1038/s41598-021-99257-1 6
Vol:.(1234567890)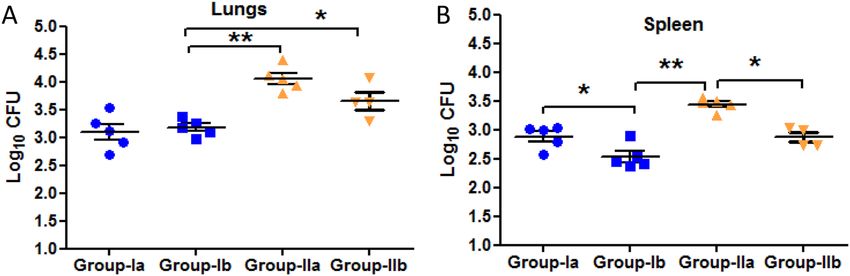
www.nature.com/scientificreports/
Figure 7. Gene expression analysis of various genes in untreated and treated groups. Gene expression of
(A) hspX (B) rpfA (C) rpfB (D) rpfC (E) rpfD (F) rpfE in lungs of untreated and INH + RIF treated latent
tuberculosis and latent tuberculosis with diabetes group. The data were represented as Mean ± SE of 3 animals
in each group and no statistically significant changes were observed in the expression of hspX and rpf genes.
Group-Ia: latent tuberculosis untreated, Group-Ib: latent tuberculosis treated with INH + RIF, Group-IIa: latent
tuberculosis with diabetes untreated, Group-IIb: latent tuberculosis with diabetes treated with INH + RIF.
Animal model was developed only once but gene expression was studied in triplicates from each animal.
(Group IIb) were not very different from only latent tuberculosis group. Thus, it was concluded that longer dura-
tion therapy i.e. more than 4 weeks is required to evaluate the treatment outcome.
Discussion
Diabetes acts as a predisposing risk factor for tuberculosis making it necessary to delineate its role in LTBI activa-
tion. This prompted us to develop an animal model of latent TB with diabetes so as to thoroughly investigate the
underlying factors that may lead to the reactivation of latent tuberculosis under diabetic conditions.
The conversion of LTBI to active TB was strongly supported by CFU counts which were found to be more
than 104. Moreover, a study by Dutta et al have shown similar results in which a model of latent tuberculosis was
developed by immunization with rBCG and an increase in CFU counts was seen after treating the mice with anti-
TNF-α mAb18. Similarly, increased CFU counts were seen after administration of aminoguanidine, a nitric oxide
synthase inhibitor, resulting in immune suppression in latent tuberculosis mice m odel19. TNF-α neutralization
has also been shown to reactivate chronic persistent tuberculosis in a low dose mice model of latent t uberculosis20.
Abnormal regulation of inflammatory mechanisms in diabetes is also a characteristic feature that can cause
exaggerated inflammatory responses in the lung, resulting in impaired lung f unction21. In the present study also,
diabetes was found to be associated with compromised lung morphology with severe inflammation as indicated
by lymphocytic infiltration and no granulomas. Our findings were supported by a study wherein granulomas
became disorganised and inflammation was increased in the lungs of latently infected mice after treatment with
anti-TNF-α mAb18. Another study on zebrafish infected with latent M. marinum also reported loss of granuloma
Scientific Reports | (2021) 11:19700 | https://doi.org/10.1038/s41598-021-99257-1 7
Vol.:(0123456789)www.nature.com/scientificreports/
integrity upon dexamethasone t reatment22. Similar results were observed after blocking TNF-α in chronically
infected C57BL/6 mice along with the dissolution of granulomatous tissues and increased lung i nflammation23.
Alpha crystallin is believed to sustain the tubercle bacilli during latent or dormant phase of infection, thus
indicating HspX as a potential marker of latent tuberculosis i nfection24,25. The gene expression of hspX was down-
regulated in latently infected mice induced with diabetes as compared to mice infected with latent tuberculosis
only. This finding further confirmed the active state of tubercle bacilli after diabetes development. Increased
expression of HspX in the latent state of tubercle bacilli and its reversal to normal levels during the exponential
growth has also been reported earlier 25. Other studies also showed that the levels of anti-Acr IgG were lower in
active TB as compared to latent TB thus supporting the present o bservation26,27. Similarly, a study by Muttucu-
maru et al strongly supported our findings and reported that alpha-crystallin was induced in the non-replicative
state of M. tuberculosis as compared to active culture28.
Since TB reactivation has an inevitable link with resuscitation promoting factors, it was mandatory to study
the expression of various rpf genes under diabetic conditions. The expression of rpfB and rpfD genes was sig-
nificantly upregulated in latent tuberculosis and diabetes group in comparison to only latent tuberculosis group.
These results strongly suggest that diabetes promotes resuscitation to latent tubercle bacilli and helps in its acti-
vation through resuscitation promoting factors B & D. Goldman et al have also shown the importance of Rpf in
reactivation of chronic TB. RpfAB double knockout mutants exhibited a deficiency in reactivation in C57BL/6
mice upon immune suppression induced by nitric oxide synthase inhibitor (aminoguanidine) and by C D4+ T-cell
29
depletion . A delay in reactivation of bacterial growth upon immune suppression in the mouse model of chronic
tuberculosis after deletion of rpfB gene has been shown30. Rpf triple and double mutants were observed to be
defective in their ability to re-grow after immunosuppression induced by administration of aminoguanidine
and anti-TNF-α a ntibodies31. A significant differential attenuation in virulence has been observed in the above
stated triple mutants in a mouse model of chronic T B32. Kapoor et al reported that the dormant M. tuberculosis
within the granuloma were resuscitated when treated with anti-TNFα-mAb resulting in increased expression of
rpf genes i.e. rpfA, rpfB and rpfC33. Recently an Rpf-interacting protein A (RipA) was identified which interacts
explicitly with RpfB and RpfE and efficiently promotes hydrolysis of peptidoglycan during reactivation and hence
is responsible for the release of bacteria from dormancy34.
Since diabetes is associated with poor tuberculosis treatment outcomes, the effect of diabetes on LTBI treat-
ment was studied. Latent TB therapy (INH + RIF) did not affect the bacillary load between untreated and treated
LTBI with diabetes group. The results were supported by a clinical study wherein tuberculosis patients with dia-
betes showed poor TB treatment o utcomes35. A meta-analysis study showed that tuberculosis treatment failure
was higher in tuberculosis patients with diabetes36. In the present study, no significant difference was observed
in the bacillary load between latent tuberculosis only untreated and treated groups, which could be because of
the short treatment period. A study by Zhang et al showed that the therapy for LTBI (Rifapentine + Pyrazinamide
and Rifapentine + Isoniazid + Pyrazinamide) was ineffective for less than 6–8 weeks37. Other studies have also
shown that it takes 10–12 weeks for the standard regimen RIF + INH + PZA to cure active TB mice where the
bacterial burden is high and 20–24 weeks to prevent relapse38,39. Thus, longer duration therapy (> 4–5 weeks) is
required to eliminate minimal bacillary load. The gene expression of hspX was upregulated and the expression
of rpfB and rpfD was downregulated in latent tuberculosis with diabetes treated group as compared to latent
tuberculosis with diabetes untreated group. These results may suggest that upon treatment, M. tuberculosis
may revert to the latent state which could be the reason for relapse of tuberculosis. However, it needs further
exploration as therapy was given for only four weeks. Apart from the short duration of therapy, another limita-
tion of the present study is that a single high dose of streptozotocin was administered to the animals to induce
diabetes which is more reflective of type 1 diabetes and not of type 2 diabetes. The reason for using a high dose
of streptozotocin is that animals were immunized with BCG which is thought to play a role in protection against
diabetes. Several studies have shown that multiple low doses of streptozotocin did not induce diabetes in mice
previously immunized with BCG40,41.
In conclusion, diabetes leads to disruption of granuloma formation and ultimately leads to the activation of
latent tuberculosis. The major factors involved in this activation or resuscitation process are the resuscitation
promoting factors rpfB and rpfD which can be targeted to contain the tuberculosis infection and reduce the
shared burden of tuberculosis and diabetes co-pathology.
Materials and methods
Animal procurement and ethics statement. All animal procedures were performed in the Bio-Safety
Level-III (BSL-III) facility at International Centre for Genetic Engineering and Biotechnology (ICGEB), New
Delhi. Animal procedures were approved by the Institutional Animal Ethical Committee with ref No. 89/90/
IAEC/616 and also by the Animal Ethical Committee of ICGEB, New Delhi with ref No. ICGEB/IAEC/02042019/
TACF-PGIMER-16. All methods were performed in accordance with the relevant guidelines and regulations.
Also, the study is reported in accordance with ARRIVE guidelines.
Latent tuberculosis and diabetes in mice. Latent tuberculosis mouse model was developed according
to the method of Zhang et al. Briefly, BALB/c mice (5–6 weeks, either sex) were infected with BCG through aero-
solization (O.D. of 0.5 at 600 nm ~ 5 × 10⁶ CFU/ml)42. After 6 weeks of immunization with BCG, animals were
infected with M. tuberculosis H37Rv (O.D. of 1.1 at 600 nm ~ 3.1 × 10⁷)43 through aerosol route. Animals were
sacrificed after 4 and 6 weeks of infection for determination of latent TB development. Six weeks post infection
with M. tuberculosis H37Rv, latently infected animals from latent TB group were divided in 3 groups i.e. Group-I:
latent tuberculosis only, Group-II: latent tuberculosis with diabetes, Group-III: latent tuberculosis with immu-
nosuppression. Group-II animals were induced with diabetes by using streptozotocin (150 mg/kg body weight)
Scientific Reports | (2021) 11:19700 | https://doi.org/10.1038/s41598-021-99257-1 8
Vol:.(1234567890)www.nature.com/scientificreports/
Balb/c mice (5-6 weeks)
n=152
Control animals Latent TB Group Active TB Group
(n=10) (BCG given) (n=99) (without BCG) (n=27)
3 animals sacrifice on day 1 6 weeks
Infection with H37Rv Infection with H37Rv
3 animals sacrifice on day 1
Animals sacrificed at 4 and 6 week
th th Animals sacrificed at 4th and 6th week
Latent TB group
for CFU enumeration and for CFU enumeration, and
n=72
histopathology histopathology
n=8 at each time n=8 at each time
Latent tuberculosis Latent tuberculosis Latent tuberculosis
only with Diabetes with
n=24 n=24 immunosuppression
n=24
Treated with RIF+INH Untreated Untreated Treated with RIF+INH
n=8 n=24 n=24 n=8
Animals sacrificed at 13 for CFU Animals sacrificed at week 9 and Animals sacrificed at 13 for CFU Animals sacrificed at week 9 and
enumeration, histopathology, 13 for CFU enumeration, enumeration, histopathology, 13 for CFU enumeration,
RNA extraction histopathology, RNA extraction RNA extraction histopathology, RNA extraction
n=8 at each time n=8 at each time n=8 at each time n=8 at each time
Figure 8. Flow chart depicting the experimental design, distribution of animals into different groups and time
line of BCG infection, M. tuberculosis infection and subsequent treatments.
as described by Ventura-Sobrevilla et al.44. A flow chart of the distribution of animals into different groups with
experimental endpoints is given in Fig. 8.
Quantitative culture of lungs and spleen. Lungs and spleen were removed aseptically and homog-
enised in phosphate buffer saline (PBS). Aliquots (0.1 mL) of homogenates (undiluted and serial tenfold dilu-
tions) were plated on Middlebrook 7H11 agar (Becton–Dickinson, USA) enriched with 10% oleic acid-albumin-
dextrose-catalase (OADC) (Difco-Becton Dickinson, USA). 4 mg/ml of 2-thiophenecarboxylic acid hydrazide
(TCH) (Sigma Aldrich) was added in 7H11 agar media to select for M. tuberculosis45. Plates were incubated at
37 °C in a 5% CO2 environment and colony forming unit (CFU) counts were determined after 28 days of incu-
bation.
Induction of immunosuppression in latently infected mice. Group-II animals were induced with
diabetes and Group-III animals were treated with dexamethasone to induce immunosuppression after six weeks
of infection with M. tuberculosis H37Rv. Group-III animals were used as a positive control for active tubercu-
losis. Three doses of dexamethasone was administered to Group-III animals at a dose of 6 mg/kg body weight
subcutaneously 2 days apart46.
Treatment therapy for latent tuberculosis. After the induction of diabetes, Group-I (latent tuber-
culosis only) and Group-II (latent tuberculosis with diabetes) animals were further subdivided into four sub-
groups i.e. Group-Ia: latent tuberculosis untreated, Group-Ib: latent tuberculosis treated with isoniazid (INH)
and rifampicin (RIF), Group-IIa: latent tuberculosis with diabetes, untreated, Group-IIb: latent tuberculosis with
diabetes, treated with INH + RIF. 10 animals from both Group-I and Group-II each were treated with isoniazid
(INH) and rifampicin (RIF). At week 9 of diabetes induction, Group-Ib and Group-IIb animals were adminis-
tered with INH (10 mg/kg body weight) and RIF (10 mg/kg body weight) orally through gavage, 5 days per week
for 4 weeks. After 4 weeks animals (n = 8) were sacrificed from all groups, their lungs and spleens were harvested
and processed for CFU enumeration, histopathology and gene analysis.
Histopathological studies. Aseptically removed lungs and spleen were transferred to 10% buffered for-
malin and further processed for paraffin embedding and sectioning47. Paraffin sections were deparaffinized and
stained by standard haematoxylin and eosin (H&E) stain and acid-fast bacilli (AFB) stain. According to Valdez
et al., a scoring system [0 = within normal limits (no change); 1 = minimal changes; 2 = mild changes; 3 = moder-
ate changes; 4 = marked changes; 5 = very severe changes] involving examination of lungs for peribronchiolitis,
perivasculitis and granuloma formation was used to give a total score for lungs from each mouse in all groups48.
Scientific Reports | (2021) 11:19700 | https://doi.org/10.1038/s41598-021-99257-1 9
Vol.:(0123456789)www.nature.com/scientificreports/
Gene expression analysis. Lung tissue was directly transferred to 15 ml of chilled 0.01% sodium dodecyl
sulphate (SDS) and homogenized by using homogenizer. Homogenates were then centrifuged at 4000 rpm for
10 min at 4 °C to collect the bacterial pellets released from disrupted cells. The supernatant was separated and
pellets were resuspended in 2–3 ml of TRIzol depending upon the size of the pellet. Samples were then trans-
ferred to screw cap tubes containing around 500 ml of 0.1 mm zirconia/silica beads and given 4 cycles of 30 s
each with max. speed of Mini-beadbeater and processed for RNA isolation by standard phenol–chloroform
method49. RNA (500 ng) was reverse transcribed using Revert Aid First Strand cDNA synthesis kit (Thermo
Scientific, USA). qRT-PCR amplification was done by using S YBR® Green chemistry on Roche L ightCycler® 96
Real-Time PCR Systems. The primer sequence used for the amplification of different genes is as follows:
rpfA—GATGGACGCTCCGTTGGAC (F), GTTTGCTCGT TCACCGCAG (R)
rpfB—TGGATGGTCACGACGCTAAG (F), CCAGATGCTTCCGTCGATCA (R)
rpfC—GGTCGCGGTGCAATAGACA (F), TCAGCGCGGAATACTTGCC (R)
rpfD—CTTACTACTGCGGGTGCTGG (F), CCCGAACAACCTCCAGTCTC (R)
rpfE—TTGAAGAACGCCCGTACGAC (F), GTTCTCAGCCACCCGGATC (R)
hspX—CACCACCCTTCCCGTTCAG (F), TGGACCGGATCTGAATGTGC (R)
16srRNA—GTGGCGAACGGGTGAGTAAC (F), ATGCATCCCGTGGTCCTATC (R)
Statistical analysis. The level of significance was determined by Mann-Whitney test and Kruskal–Wallis
test using the GraphPad Prism, version 8.0 (GraphPad Software, San Diego, USA) (https://www.graphpad.com)
Received: 3 March 2021; Accepted: 10 August 2021
References
1. World Health Organization. Global Tuberculosis Report 2020 (2020).
2. Lillebaek, T. et al.Molecular evidence of endogenous reactivation of Mycobacterium tuberculosis after 33 years of latent infection.
J. Infect. Dis.185, 401-404. https://doi.org/10.1086/338342 (2002).
3. Lillebaek, T. et al.Stability of DNA patterns and evidence of Mycobacterium tuberculosis reactivation occurring decades after the
initial infection. J. Infect. Dis.188, 1032–1039. https://doi.org/10.1086/378240 (2003).
4. Park, H. D. et al. Rv3133c/dosR is a transcription factor that mediates the hypoxic response of Mycobacterium tuberculosis. Mol.
Microbiol. 48, 833–843. https://doi.org/10.1046/j.1365-2958.2003.03474.x (2003).
5. Schnappinger, D. et al. Transcriptional adaptation of Mycobacterium tuberculosis within macrophages: Insights into the phagosomal
environment. J. Exp. Med. 198, 693–704.https://doi.org/10.1084/jem.20030846 (2003).
6. Voskuil, M. I. et al. Inhibition of respiration by nitric oxide induces a Mycobacterium tuberculosis dormancy program. J. Exp. Med.
198, 705–713. https://doi.org/10.1084/jem.20030205 (2003).
7. Voskuil, M. I., Visconti, K. C. & Schoolnik, G. K. Mycobacterium tuberculosis gene expression during adaptation to stationary
phase and low-oxygen dormancy. Tuberculosis 84, 218–227. https://doi.org/10.1016/j.tube.2004.02.003 (2004).
8. Rustad, T. R., Harrell, M. I., Liao, R. & Sherman, D. R. The enduring hypoxic response of Mycobacterium tuberculosis. PLoS ONE
3, e1505. https://doi.org/10.1371/journal.pone.0001502 (2008).
9. Rustad, T. R., Sherrid, A. M., Minch, K. J. & Sherman, D. R. Hypoxia: A window into Mycobacterium tuberculosis latency. Cell.
Microbiol. 11, 1151–1159. https://doi.org/10.1111/j.1462-5822.2009.01325.x (2009).
10. Larsson, C. et al. Gene expression of mycobacterium tuberculosis putative transcription factors whib1-7 in redox environments.
PLoS ONE 7, e37516. https://doi.org/10.1371/journal.pone.0037516 (2012).
11. World Health Organization. Global Tuberculosis Report 2017 (2017).
12. Faurholt-Jepsen, D. et al. Diabetes is a risk factor for pulmonary tuberculosis: A case-control study from Mwanza, Tanzania. PLoS
ONE 6, e24215. https://doi.org/10.1371/journal.pone.0024215 (2011).
13. Faurholt-Jepsen, D. et al. Diabetes is a strong predictor of mortality during tuberculosis treatment: A prospective cohort study
among tuberculosis patients from Mwanza, Tanzania. Trop. Med. Int. Heal. 18, 822–829. https://d oi.o rg/1 0.1 111/t mi.1 2120 (2013).
14. Pablos-Méndez, A., Blustein, J. & Knirsch, C. A. The role of diabetes mellitus in the higher prevalence of tuberculosis among
Hispanics. Am. J. Public Health 87, 574–579. https://doi.org/10.2105/AJPH.87.4.574 (1997).
15. Harries, A. D. et al. The looming epidemic of diabetes-associated tuberculosis: Learning lessons from HIV-associated tuberculosis.
Int. J. Tuberc. Lung Dis. 15, 1436–1444. https://doi.org/10.5588/ijtld.11.0503 (2011).
16. Ernst, J. D. The immunological life cycle of tuberculosis. Nat. Rev. Immunol.12, 581–591. https://doi.org/10.1038/nri3259 (2012).
17. Cohen-Gonsaud, M. et al. Resuscitation-promoting factors possess a lysozyme-like domain. Trends Biochem. Sci. 29, 7–10. https://
doi.org/10.1016/j.tibs.2003.10.009 (2004).
18. Dutta, N. K., Illei, P. B., Jain, S. K. & Karakousis, P. C. Characterization of a novel necrotic granuloma model of latent tuberculosis
infection and reactivation in mice. Am. J. Pathol. 184, 2045–2055. https://doi.org/10.1016/j.ajpath.2014.03.008 (2014).
19. Flynn, J. L., Scanga, C. A., Tanaka, K. E. & Chan, J. Effects of aminoguanidine on latent murine tuberculosis. J. Immunol. 160,
1796–1803. (1998).
20. Mohan, V. P. et al. Effects of tumor necrosis factor alpha on host immune response in chronic persistent tuberculosis: Possible role
for limiting pathology. Infect. Immun. 69, 1847–1855. https://doi.org/10.1128/IAI.69.3.1847-1855.2001 (2001).
21. Pitocco, D. et al. The diabetic lung—a new target organ?. Rev. Diabet. Stud. 9, 23–35. https://d oi.o
rg/1 0.1 900/R DS.2 012.9.2 3 (2012).
22. Myllymäki, H., Niskanen, M., Luukinen, H., Parikka, M. & Rämet, M. Identification of protective postexposure mycobacterial
vaccine antigens using an immunosuppression-based reactivation model in the zebrafish. Dis. Models Mech. 11, dmm033175.
https://doi.org/10.1242/dmm.033175 (2018).
23. Chakravarty, S. D. et al. Tumor necrosis factor blockade in chronic murine tuberculosis enhances granulomatous inflammation
and disorganizes granulomas in the lungs. Infect. Immun. 76, 916–926. https://doi.org/10.1128/IAI.01011-07 (2008).
24. Sherman, D. R. et al. Regulation of the Mycobacterium tuberculosis hypoxic response gene encoding α-crystallin. Proc. Natl. Acad.
Sci. U S A. 98, 7534-7539. https://doi.org/10.1073/pnas.121172498 (2001).
25. Hu, Y., Movahedzadeh, F., Stoker, N. G. & Coates, A. R. M. Deletion of the Mycobacterium tuberculosis α-crystallin-like hspX gene
causes increased bacterial growth in vivo. Infect. Immun. 74, 861–868. https://doi.org/10.1128/IAI.74.2.861-868.2006 (2006).
26. Silva, V. M. C., Kanaujia, G., Gennaro, M. L. & Menzies, D. Factors associated with humoral response to ESAT-6, 38 kDa and 14
kDa in patients with a spectrum of tuberculosis. Int. J. Tuberc. Lung Dis. 7, 478–484 (2003).
Scientific Reports | (2021) 11:19700 | https://doi.org/10.1038/s41598-021-99257-1 10
Vol:.(1234567890)www.nature.com/scientificreports/
27. Davidow, A. et al. Antibody profiles characteristic of Mycobacterium tuberculosis infection state. Infect. Immun. 73, 6846–6851.
https://doi.org/10.1128/IAI.73.10.6846-6851.2005 (2005).
28. Muttucumaru, D. G. N., Roberts, G., Hinds, J., Stabler, R. A. & Parish, T. Gene expression profile of Mycobacterium tuberculosis
in a non-replicating state. Tuberculosis 84, 239–246. https://doi.org/10.1016/j.tube.2003.12.006 (2004).
29. Russell-Goldman, E., Xu, J., Wang, X., Chan, J. & Tufariello, J. A. M. A Mycobacterium tuberculosis Rpf double-knockout strain
exhibits profound defects in reactivation from chronic tuberculosis and innate immunity phenotypes. Infect. Immun. 76, 4269–
4281. https://doi.org/10.1128/IAI.01735-07 (2008).
30. Tufariello, J. A. M. et al. Deletion of the Mycobacterium tuberculosis resuscitation-promoting factor Rv1009 gene results in delayed
reactivation from chronic tuberculosis. Infect. Immun. 74, 2985–2995. https://doi.org/10.1128/IAI.74.5.2985-2995.2006 (2006).
31. Biketov, S. et al. The role of resuscitation promoting factors in pathogenesis and reactivation of Mycobacterium tuberculosis during
intra-peritoneal infection in mice. BMC Infect. Dis. 7, 146. https://doi.org/10.1186/1471-2334-7-146 (2007).
32. Downing, K. J. et al. Mutants of Mycobacterium tuberculosis lacking three of the five rpf-like genes are defective for growth in vivo
and for resuscitation in vitro. Infect. Immun. 73, 3038–3043. https://doi.org/10.1128/IAI.73.5.3038-3043.2005 (2005).
33. Kapoor, N. et al. Human granuloma in vitro model, for TB dormancy and resuscitation. PLoS ONE 8, e53657. https://doi.org/10.
1371/journal.pone.0053657 (2013).
34. Hett, E. C. et al. A partner for the resuscitation-promoting factors of Mycobacterium tuberculosis. Mol. Microbiol. 66, 658–668.
https://doi.org/10.1111/j.1365-2958.2007.05945.x. (2007).
35. Jeon, C. Y., Murray, M. B. & Baker, M. A. Managing tuberculosis in patients with diabetes mellitus: Why we care and what we
know. Expert Rev. Anti Infect. Ther. 10, 863–868. https://doi.org/10.1586/eri.12.75 (2012).
36. Riza, A. L. et al. Clinical management of concurrent diabetes and tuberculosis and the implications for patient services. Lancet
Diabetes Endocrinol. 2, 740–753. https://doi.org/10.1016/S2213-8587(14)70110-X (2014).
37. Zhang, T., Zhang, M., Rosenthal, I. M., Grosset, J. H. & Nuermberger, E. L. Short-course therapy with daily rifapentine in a murine
model of latent tuberculosis infection. Am. J. Respir. Crit. Care Med. 180, 1151–1158. https://d oi.o
rg/1 0.1 164/r ccm.2 00905-0 795OC
(2009).
38. Rosenthal, I. M. et al. Daily dosing of rifapentine cures tuberculosis in three months or less in the murine model. PLoS Med. 4,
e344. https://doi.org/10.1371/journal.pmed.0040344 (2007).
39. Rosenthal, I. M., Zhang, M., Almeida, D., Grosset, J. H. & Nuermberger, E. L. Isoniazid or moxifloxacin in rifapentine-based regi-
mens for experimental tuberculosis?. Am. J. Respir. Crit. Care Med. 178, 989–993. https://doi.org/10.1164/rccm.200807-1029OC
(2008).
40. Baik, S. H. et al. BCG vaccine prevents insulitis in low dose streptozotocin-induced diabetic mice. Diabetes Res. Clin. Pract. 46,
91–97. https://doi.org/10.1016/S0168-8227(99)00079-0 (1999).
41. da Rosa, L. C. et al. Bacille Calmette-Guérin/DNAhsp65 prime-boost is protective against diabetes in non-obese diabetic mice but
not in the streptozotocin model of type 1 diabetes. Clin. Exp. Immunol. 173, 430–437. https://doi.org/10.1111/cei.12140 (2013).
42. Kargupta, R. et al. Rapid culture-based detection of living mycobacteria using microchannel electrical impedance spectroscopy
(m-EIS). Biol. Res. 50, 21. https://doi.org/10.1186/s40659-017-0126-7 (2017).
43. Peñuelas-Urquides, K. et al. Measuring of Mycobacterium tuberculosis growth. A correlation of the optical measurements with
colony forming units. Braz. J. Microbiol. 44, 287–289. https://doi.org/10.1590/S1517-83822013000100042. (2013).
44. Ventura-Sobrevilla, J. et al. Effect of varying dose and administration of streptozotocin on blood sugar in male CD1 mice. Proc.
West. Pharmacol. Soc. 54, 5–9 (2011).
45. Lecoeur, H. F., Truffot-Pernot, C. & Grosset, J. H. Experimental short-course preventive therapy of tuberculosis with rifampin and
pyrazinamide. Am. Rev. Respir. Dis. 140, 1189–1193. https://doi.org/10.1164/ajrccm/140.5.1189. (2011).
46. Ahmad, Z., Sharma, S. & Khuller, G. K. The potential of azole antifungals against latent/persistent tuberculosis. FEMS Microbiol.
Lett. 258, 200–203. https://doi.org/10.1111/j.1574-6968.2006.00224.x (2006).
47. Ramos-Vara, J. A. Principles and methods of immunohistochemistry. Methods Mol. Biol. 691, 83–96. https://doi.org/10.1007/
978-1-60761-849-2_5 (2011).
48. Flores-Valdez, M. A. et al. The BCGΔBCG1419c vaccine candidate reduces lung pathology, IL-6, TNF-α, and IL-10 during chronic
TB infection. Front. Microbiol. 9, 1–12. https://doi.org/10.3389/fmicb.2018.01281 (2018).
49. Adilakshmi, T., Lease, R. A. & Woodson, S. A. Hydroxyl radical footprinting in vivo: Mapping macromolecular structures with
synchrotron radiation. Nucleic Acids Res. 34, e64. https://doi.org/10.1093/nar/gkl291 (2006).
Acknowledgements
The authors are grateful to Indian Council of Medical Research for financial support.
Author contributions
A.V.—conception and design of the work, acquisition, analysis and interpretation of data, manuscript writing and
prepared figures. M.K., L.V.S.—acquisition of data. D.A., I.V., B.D.R.—interpretation of data. S.S.—conception
and design of the work, funding acquisition, interpretation of data and substantively revised the work.
Competing interests
The authors declare no competing interests.
Additional information
Correspondence and requests for materials should be addressed to S.S.
Reprints and permissions information is available at www.nature.com/reprints.
Publisher’s note Springer Nature remains neutral with regard to jurisdictional claims in published maps and
institutional affiliations.
Scientific Reports | (2021) 11:19700 | https://doi.org/10.1038/s41598-021-99257-1 11
Vol.:(0123456789)www.nature.com/scientificreports/
Open Access This article is licensed under a Creative Commons Attribution 4.0 International
License, which permits use, sharing, adaptation, distribution and reproduction in any medium or
format, as long as you give appropriate credit to the original author(s) and the source, provide a link to the
Creative Commons licence, and indicate if changes were made. The images or other third party material in this
article are included in the article’s Creative Commons licence, unless indicated otherwise in a credit line to the
material. If material is not included in the article’s Creative Commons licence and your intended use is not
permitted by statutory regulation or exceeds the permitted use, you will need to obtain permission directly from
the copyright holder. To view a copy of this licence, visit http://creativecommons.org/licenses/by/4.0/.
© The Author(s) 2021
Scientific Reports | (2021) 11:19700 | https://doi.org/10.1038/s41598-021-99257-1 12
Vol:.(1234567890)You can also read