Recent Trends in Southeastern Ecosystems (2021)
←
→
Page content transcription
If your browser does not render page correctly, please read the page content below
Recent Trends in
Southeastern Ecosystems
(2021)

Measuring progress toward the Southeast
Conservation Adaptation Strategy (SECAS) goal

October 13, 2021

Preferred Citation: Southeast Conservation Adaptation Strategy. 2021. Recent Trends in
Southeastern Ecosystems (2021): Measuring Progress toward the SECAS Goal. Available online:
http://secassoutheast.org/pdf/SECAS-goal-report-2021.pdf
Contents
Executive summary ...................................................................................................................................... 1
   Overview of recent trends in ecosystem indicators................................................................................ 2
Introduction ................................................................................................................................................. 3
   Background .............................................................................................................................................. 3
   Purpose of this report .............................................................................................................................. 3
   Methods .................................................................................................................................................... 3
       Changes since the last report .............................................................................................................. 3
       Selecting indicators.............................................................................................................................. 3
       Defining health, function, and connectivity ........................................................................................ 3
       Defining “recent” trends ...................................................................................................................... 4
       Estimating trends ................................................................................................................................. 4
       Evaluating confidence in trend ............................................................................................................ 4
       Assessments used in the report ........................................................................................................... 4
       Assessments considered but not used in this report .......................................................................... 4
Ecosystem indicator trends ......................................................................................................................... 5
   Terrestrial ................................................................................................................................................. 5
       Health ................................................................................................................................................... 5
           Areas without invasive plants .......................................................................................................... 5
           Beach birds ....................................................................................................................................... 7
           Forested wetland area ..................................................................................................................... 8
           Forested wetland birds .................................................................................................................. 10
           Gopher tortoise (Eastern population) ........................................................................................... 13
           Longleaf pine area.......................................................................................................................... 15
           Pine and prairie birds ..................................................................................................................... 16
           Prescribed fire in longleaf pine ...................................................................................................... 20
           Salt marsh area .............................................................................................................................. 21
           Upland forest area.......................................................................................................................... 22
           Upland forest birds......................................................................................................................... 24
       Function.............................................................................................................................................. 28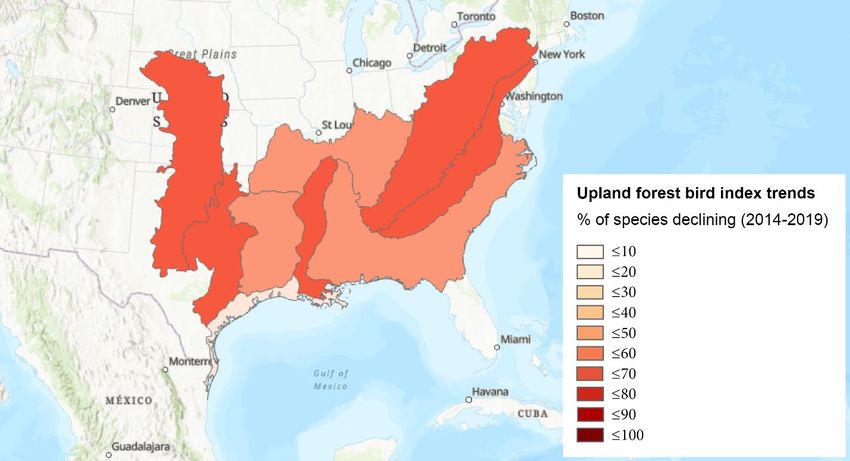
Working lands conservation .......................................................................................................... 28
       Connectivity........................................................................................................................................ 31
           Undeveloped lands in corridors .................................................................................................... 31
   Freshwater .............................................................................................................................................. 33
       Function.............................................................................................................................................. 33
           Water quality .................................................................................................................................. 33
       Connectivity........................................................................................................................................ 35
           Aquatic connectivity ...................................................................................................................... 35
   Estuarine & marine ................................................................................................................................. 37
       Health ................................................................................................................................................. 37
           Coastal condition ........................................................................................................................... 37
       Function.............................................................................................................................................. 39
           Fisheries .......................................................................................................................................... 39
Image credits .............................................................................................................................................. 41
Executive summary
Through SECAS, diverse partners are working together to design and achieve a connected network of
lands and waters that supports thriving fish and wildlife populations and improved quality of life for
people across the Southeastern United States and the Caribbean. The long-term goal for SECAS is a
10% or greater improvement in the health, function, and connectivity of Southeastern ecosystems by
2060. To stay on track for achieving that goal, a 1% improvement will be needed every 4 years.

This report is the third annual assessment of progress toward the SECAS goal using information from
existing monitoring programs. It uses the most recent 3-6 years of available data. The report is
intended to facilitate discussion around conservation actions needed to meet the goal.

Most indicators improved overall during the period covered in this report. Given the rapid changes
happening in the Southeast, this is an encouraging sign for achieving the SECAS goal. Longleaf pine
area, forested wetland birds, working lands conservation, coastal condition, and marine fisheries
indicators improved fast enough to stay on track to meet the SECAS goal. Longleaf pine, forested
wetland conservation, working lands, and marine fisheries have been major areas of shared
conservation focus in the Southeast, and those efforts are clearly having a big impact.

Only 5 of the 17 indicators had declining trends. Of these, pine and prairie birds continue to be the
most off track for meeting the SECAS goal. Declines in habitat, especially within the West Gulf Coastal
Plain, Piedmont, Southeast Coastal Plain, Central Hardwoods, and Peninsular Florida, are likely
driving this pattern. There is still hope that focused conservation can have an impact as Bachman’s
sparrow, subject to significant conservation attention, increased in abundance through much of the
longleaf pine range. This further reinforces the importance of accelerating open pine, pine/oak
savanna, and other grassland restoration throughout the Southeast for grassland birds, pollinators,
and other key species.

For the first time in the 3-year history of this report, prescribed fire in longleaf switched to a declining
trend. Despite the COVID-19 pandemic, prescribed fire did increase between 2019 and 2020—a major
achievement. That said, the overall declining trend over the last 6 years suggests that more work will
be needed to maintain the restoration momentum in this important ecosystem.

To learn more about the role of SECAS in meeting the goal, see the SECAS Statement of Purpose.

                                                                                                               1
Overview of recent trends in ecosystem indicators
Table 1. Overview of recent trends in ecosystem indicators. Indicators shown in green are on track to meet
the goal (≥1% increase every 4 years); indicators shown in yellow (
Introduction

Background
Through SECAS, diverse partners are working together to design and achieve a connected network of
lands and waters that supports thriving fish and wildlife populations and improved quality of life for
people across the Southeastern United States and the Caribbean. In the fall of 2018, SECAS leadership
approved a long-term goal and supporting short-term metrics to evaluate progress toward that
connected network.

The long-term goal is a 10% or greater improvement in the health, function, and connectivity of
Southeastern ecosystems by 2060. One of the short-term metrics, selected to stay on track to meet
the long-term goal, is a 1% improvement in the health, function, and connectivity of Southeastern
ecosystems every 4 years. This report on recent trends seeks to measure progress toward that metric.

Purpose of this report
This report assesses progress toward the SECAS goal using information from existing monitoring
programs. It is intended to facilitate discussion around conservation actions needed to meet the goal.

Methods

Changes since the last report
For 2021, we made three major improvements: 1) new indicators for working lands conservation, salt
marsh area, and undeveloped land in corridors, 2) updated data for bird indicators, prescribed fire in
longleaf pine, and coastal condition, and 3) reformatting to better match the health, function, and
connectivity categories within the SECAS goal.

Selecting indicators
We selected indicators that are monitored by consistent multi-state efforts and are already used by
other organizations to evaluate ecosystem conditions.

Defining health, function, and connectivity
For the purposes of this report, we use these definitions for health, function and connectivity:

    •   Health: The condition of species and the ecosystems they depend on
    •   Function: The benefits provided to people by species and ecosystems
    •   Connectivity: The ability of species and ecosystems to move over time

                                                                                                         3
Defining “recent” trends
We used the most recent 3-6 years of available data for each indicator to calculate the recent trend. In
many cases, the time periods for various indicators do not overlap. The available data from all of the
monitoring made it difficult to select a single time period as the definition of recent. For example,
2015 is the most recent year with available data from the National Coastal Condition Assessment,
while data on prescribed fire in longleaf pine was only available starting in 2013.
Estimating trends
For indicators where charts only show two points in time (e.g., longleaf pine area), we simply
calculated the change between those points. For indicators showing data from more than two years
(e.g., prescribed fire in longleaf pine), we estimated the trend based on the slope of a linear regression
through all points. For coastal condition and bird indicators, where trends were only available for
discrete subregions or states, we averaged trends equally instead of weighting by area.
Evaluating confidence in trend
The confidence estimate for each trend is a qualitative judgement based on the design of the
monitoring, overall sample size, and major sources of variability in the indicator.
Assessments used in the report
We used 13 different assessments to evaluate indicator trends. Assessments ranged from remotely
sensed data like the National Land Cover Database to long-term volunteer-driven monitoring
programs like the Breeding Bird Survey. Additional assessments used included America’s Longleaf
Range-wide Accomplishment Reports, Forest Inventory and Analysis, Gopher Tortoise Candidate
Conservation Agreement reports, USDA Soil and Water Resources Conservation Act Reports,
Southeast Conservation Blueprint, International Shorebird Survey , EPA 303(d) state reports,
Southeast Aquatic Resources Partnership Aquatic Barrier Database, NOAA C-CAP Regional Landcover,
National Coastal Condition Assessments, and NOAA Reports to Congress on the Status of Fisheries.
Assessments considered but not used in this report
There are many subregional assessments of ecosystem conditions (e.g., Chesapeake Bay, Everglades),
but their coverage of only part of the Southeast made them difficult to formally integrate into this
particular report. One national assessment, Surfrider Foundation’s State of the Beach, had potential,
but was not used because it focused on policies related to beach conditions rather than the actual
condition of the beaches.
4Ecosystem indicator trends
Terrestrial
All inland and coastal terrestrial ecosystems
Health
The condition of species and the ecosystems they depend on
Areas without invasive plants
Figure 1. Percent change in areas without invasive plants by plant type, based on the most recent available
state data.
Yearly trend
Most states showed declining trends for areas without different types of invasive plants. The most
recent data available varied for each state, with some as old as 2016 and others as recent as 2019.
Averaging trends across plant type and states results in a 0.33% decline per year.
5On track to meet SECAS goal
No. The decline of about 1.3% every 4 years is not on track to meet the SECAS goal of a 1% increase
every 4 years.
Data source
Forest Inventory Analysis (FIA) data extracted using the Southern Nonnative Invasive Plant Extraction
Tool (SNIPET)
Confidence in trend
Medium. While data for some states was a few years old, the statistically randomized design of the FIA
program, its long history of tracking trends, and the sample size across all states suggest these data
provide a reasonable estimate of the trend.
Interpretation
This is an indicator of local conditions across terrestrial ecosystems. This indicator suggests that work
to reduce the spread of specific invasive species is having an impact. Without the ongoing work to
reduce invasives, landscape and climate change in the Southeast would likely lead to far worse
trends. However, this indicator also shows that additional attention to invasive plants will be required
to get on track to meet the SECAS goal.
Notable trends for this indicator include: 1) improvements in areas without invasive vines in
Tennessee mostly due to reductions in Japanese honeysuckle, 2) improvements in areas without
invasive shrubs in Oklahoma mostly due to reductions in shrubby and Thunberg’s lespedeza, 3)
declines in areas without invasive forbs in Mississippi due to large increases in liriope, and 4) declines
in areas without invasive grasses in Kentucky, Virginia, and the Carolinas mostly due to increases in
Japanese stiltgrass.
6Beach birds
Figure 2. Beach bird trends and confidence.
Yearly trend
When averaged across species, beach birds increased by 0.003% per year from 2011-2016. Piping
plover and whimbrel increased by 0.02% and 0.03% per year, respectively. Red knot and willet
declined by 0.02% and 0.01%, respectively.
On track to meet SECAS goal
No. The increase of about 0.012% every 4 years is not enough to reach the SECAS goal of a 1% increase
every 4 years.
Data source
International Shorebird Survey (ISS)
Special thanks to Adam Smith (Canadian Wildlife Service, Environment and Climate Change Canada)
and Paul Smith (Environment and Climate Change Canada) for providing data and estimates for this
report. Special thanks to Manomet for overall coordination of the ISS.
Confidence in trend
Low. All trend estimates have high statistical uncertainty. This is mostly due to low sample sizes along
the South Atlantic and Gulf coasts.
7Interpretation
This is an indicator of beach habitat quality. The mixed trends highlight the challenges and
opportunities within this ecosystem. Habitat modification, climate change, and human disturbance
continue to pose problems, but conservation action throughout the Atlantic and Gulf coasts also
seems to be making an impact. As these birds are migratory, conservation actions and threats
impacting their populations occur both within the Southeast and in other parts of the species’ ranges.
Forested wetland area
Figure 3. Millions of acres of forested wetland in 2011 and 2016.
8Table 2. State-specific percent change in forested wetland area from 2011-2016.
2011 acres 2016 acres % change/year
Alabama 3,468,382 3,530,626 0.36
Arkansas 3,407,234 3,406,490Data source
National Land Cover Database (NLCD)
Confidence in trend
High. The remotely sensed data used in this indicator provides full coverage of the region and forested
wetlands typically have high classification accuracy.
Interpretation
This is a coarse indicator of the overall extent of potential habitat in the forested wetland ecosystem.
Extensive conservation investments in forested wetlands, policies restricting wetland development,
and growing interest from urban communities in water supply protection and reducing flood risks
may be causing the increases in forested wetland area. However, forested wetland area is also very
sensitive to timber management decisions and yearly weather fluctuations that facilitate or hinder
harvest. It is likely that many complicated interacting factors will drive changes in this indicator in the
future.
Forested wetland birds
Figure 4. Percent of forested wetland bird species that are increasing or declining by state from 2014-2019.
10Table 3. Species trend data from 2014-2019 for each state used in Figure 4 above. Brighter colors indicate
higher confidence.
Prothonotary Swallow-tailed Yellow-throated
Swainson's warbler
warbler kite warbler
Increase - Low Increase - Low Increase - Low Increase - Low
Alabama
confidence confidence confidence confidence
Increase - Low Decline - Low Decline - Low
Arkansas
confidence confidence confidence
Increase - Low Increase - High Increase - Low Increase - Low
Florida
confidence confidence confidence confidence
Increase - Low Increase - High Decline - Low Increase - Low
Georgia
confidence confidence confidence confidence
Increase - Low Increase - Low Increase - Low
Kentucky
confidence confidence confidence
Increase - Low Increase - Low Decline - Low Increase - High
Louisiana
confidence confidence confidence confidence
Decline - Low Increase - Low Increase - Low Decline - Low
Mississippi
confidence confidence confidence confidence
Increase - Low Decline - Low
Missouri
confidence confidence
Decline - Low Increase - Low Increase - Low
North Carolina
confidence confidence confidence
Decline - Low Increase - Low
Oklahoma
confidence confidence
Increase - Low Increase - Low Decline - High Increase - Low
South Carolina
confidence confidence confidence confidence
Increase - Low Increase - Low Increase - Low
Tennessee
confidence confidence confidence
Decline - Low Increase - Low Increase - Low
Texas
confidence confidence confidence
Decline - Low Increase - Low Increase - Low
Virginia
confidence confidence confidence
Decline - Low Increase - Low Increase - Low
West Virginia
confidence confidence confidence
11Figure 5. Percent of forested wetland bird species declining from 2014-2019 by Bird Conservation Region
(BCR).
Yearly trend
Most states showed increasing trends for forested wetland bird species from 2014-2019. Species
selected are Regional Species of Greatest Conservation Need for states in the Southeast, primarily
occur in this ecosystem, and have sufficient data for trend analysis in the Breeding Bird Survey. High
confidence trends were statistically significant while low confidence trends were not. Averaging
species trends across species and states results in an overall 2.1% increase per year.
On track to meet SECAS goal
Yes. The increase of about 8.4% every 4 years is greater than the SECAS goal of a 1% increase every 4
years.
Data source
Breeding Bird Survey (BBS)
12Confidence in trend
Medium. Despite issues with roadside sampling and detectability for some species, the BBS is a
standardized and randomized sample regularly used to estimate bird population trends. The mixed
patterns across states and the low number of trends being statistically significant (“high confidence”)
suggests that overall, forested wetland birds may be stable, slightly increasing, or slightly decreasing
with major variation across states.
Interpretation
This is an indicator of both local and landscape conditions across the forested wetland ecosystem.
While there is variation across species and states, forested wetland birds appear to be on track to
meet the SECAS goal. This may be due to the extensive conservation investments in forested
wetlands, policies restricting wetland development, and growing interest from urban communities in
water supply protection and reducing flood risks.
Gulf Coastal Prairie is the only Bird Conservation Region where more species are declining than
increasing. There are two species that are declining in this region: Prothonotary warbler and Yellow-
throated warbler. Prothonotary warbler populations in this region had been increasing from the 1960s
into the late 1990s and have been steadily declining ever since. Yellow-throated warbler population
trends are highly uncertain in this region with wide confidence intervals and a relatively small sample
size.
Gopher tortoise (Eastern population)
Figure 6. Percent of gopher tortoise sites with increasing, declining, or stable trends during resurveys in 2017.
13Yearly trend
Most of the sites that were resurveyed in 2017 showed an increase in gopher tortoises within the
Eastern population segment (Florida, Georgia, South Carolina, and eastern Alabama). The Eastern
population is a candidate for listing under the Endangered Species Act. The chart above shows
reported population trends and is weighted by acres surveyed. Due to inconsistencies in methods and
reporting, it was not possible to estimate a numerical trend.
On track to meet SECAS goal
Unknown
Data source
10th Annual Gopher Tortoise Candidate Conservation Agreement report
Confidence in trend
Low. Due to inconsistencies in methods and reporting, it was not possible to estimate a numerical
trend. The organizations in the Candidate Conservation Agreement report collectively own and/or
manage more than 1.3 million acres of gopher tortoise habitat. Only approximately 35,000 acres of
that habitat was resurveyed in 2017. The areas resurveyed were also not a random sample of potential
habitat.
Interpretation
This is an indicator of both local and landscape conditions in part of the pine and prairie ecosystem.
Despite the low confidence in the trend, it does appear that gopher tortoise populations are
increasing overall. Significant effort has gone into restoration and habitat protection for this species
and, where trend data are available, it appears the species is responding positively to these actions.
14Longleaf pine area
Figure 7. Acres of longleaf pine in 2013 and 2016.
Yearly trend
Longleaf pine acres increased by about 4.5% per year from 2013-2016. Acreage increased during this
period in most states, except for Louisiana and Georgia, which had small overall declines. The latest
data from Georgia in 2017 shows an overall increase from 2013-2017. More recent data was not
available for Louisiana. Virginia also has longleaf pine, but it was not present in the samples used for
this analysis.
On track to meet SECAS goal
Yes. The increase of about 18% every 4 years is greater than the SECAS goal of 1% increase every 4
years.
Data source
Forest Inventory and Analysis (FIA) data from EVALIDator (last revised April 10, 2019)
Confidence in trend
Medium. While the longleaf sample size is small in some states, the statistically randomized design of
FIA, its long history of tracking trends, and the larger sample across all states with longleaf suggest
these data provide a reasonable estimate of the trend across the full longleaf range.
15Interpretation
This is an indicator of restoration for one part of the pine and prairie ecosystem. Longleaf pine acreage
continues to increase. Reported longleaf establishment numbers from 2017 and 2018 also show this
positive trend.
Pine and prairie birds
Figure 8. Percent of pine and prairie bird species that are increasing or declining by state from 2014-2019.
16Table 4. Species trend data from 2014-2019 for each state used in Figure 8 above. Brighter colors indicate
higher confidence.
Northern Grasshopper Loggerhead Bachman's
Prairie warbler
bobwhite sparrow shrike sparrow
Increase - Low Increase - Low Decline - Low Decline - Low Decline - Low
Alabama
confidence confidence confidence confidence confidence
Decline - Low Increase - Low Decline - High Decline - Low Decline - Low
Arkansas
confidence confidence confidence confidence confidence
Decline - Low Decline - Low Decline - Low Decline - Low
Florida
confidence confidence confidence confidence
Increase - Low Increase - Low Decline - High Decline - Low Increase - Low
Georgia
confidence confidence confidence confidence confidence
Decline - High Decline - High Increase - Low Increase - Low Decline - Low
Kentucky
confidence confidence confidence confidence confidence
Decline - High Decline - Low Decline - Low Decline - Low
Louisiana
confidence confidence confidence confidence
Decline - Low Decline - Low Decline - Low Decline - Low Decline - Low
Mississippi
confidence confidence confidence confidence confidence
Decline - Low Decline - High Increase - Low Decline - Low
Missouri
confidence confidence confidence confidence
Decline - High Decline - Low Decline - Low Decline - Low
Oklahoma
confidence confidence confidence confidence
North Decline - High Decline - Low Decline - High Decline - Low Increase - Low
Carolina confidence confidence confidence confidence confidence
South Decline - Low Decline - Low Decline - High Increase - Low Increase - Low
Carolina confidence confidence confidence confidence confidence
Decline - High Decline - Low Decline - Low Decline - Low
Tennessee
confidence confidence confidence confidence
Decline - High Increase - High Decline - Low Increase - Low Increase - Low
Texas
confidence confidence confidence confidence confidence
Decline - Low Decline - Low Decline - Low Decline - Low
Virginia
confidence confidence confidence confidence
West Decline - Low Decline - High Increase - Low Decline - Low
Virginia confidence confidence confidence confidence
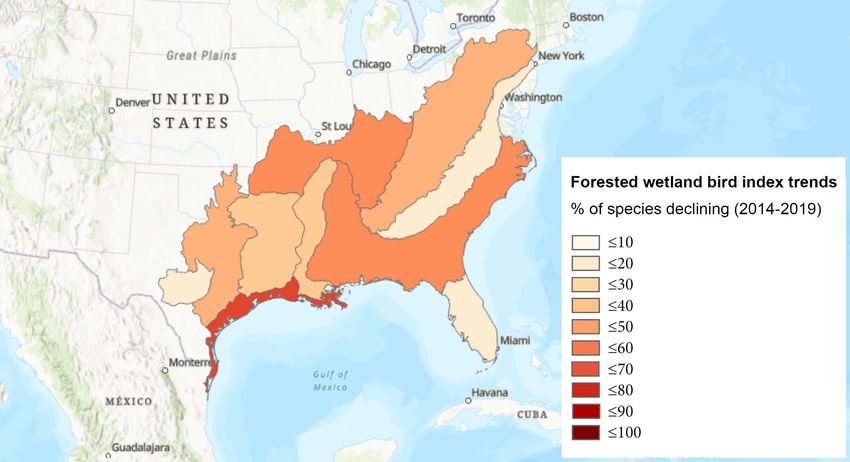
17Figure 9. Percent of pine and prairie bird species declining from 2014-2019 by Bird Conservation Region
(BCR).
Yearly trend
Most states showed declining trends for pine and prairie bird species from 2014-2019. Species
selected are Regional Species of Greatest Conservation Need for states in the Southeast, primarily
occur in this ecosystem, and have sufficient data for trend analysis in the Breeding Bird Survey. High
confidence trends were statistically significant while low confidence trends were not. Averaging
species trends across species and states results in an overall decline of 2.9% per year.
On track to meet SECAS goal
No. The decline of about 11.6% every 4 years is not on track to meet the SECAS goal of a 1% increase
every 4 years.
Data source
Breeding Bird Survey (BBS)
18Confidence in trend
Medium. Despite issues with roadside sampling and detectability for some species, the BBS is a
standardized and randomized sample regularly used to estimate bird population trends. While the
declines are only statistically significant (“high confidence”) for some of the states and species, the
number of declining trend predictions is very suggestive of overall declines in these species.
Interpretation
This is an indicator of both local and landscape conditions across the pine and prairie ecosystem.
Looking at trends within Bird Conservation Regions (BCRs) provides additional context for the state-
level results (see Figure 9). Recent trends for most BCRs had high percentages of declines. There are,
however, some differences in drivers of major trends in Western vs. Eastern BCRs in the Southeast.
For the Western BCRs, trends in arid regions can vary significantly based on yearly weather patterns.
Trends from the last few decades in pine and prairie bird species suggest that the recent declines are
part of larger cycles of increases and declines.
Declines in the Eastern BCRs seem to be driven more by long-term patterns in habitat loss. While there
are ongoing efforts in these regions to bring back open pine, pine/oak savanna, and other grasslands,
it doesn’t appear that they have yet been able to restore enough habitat to fully reverse declines
across the entire area. That said, there are indications in the data that some species trends are
starting to improve. In Alabama, Georgia, South Carolina, North Carolina, and Kentucky, at least 2 of
the 5 index species had increasing trends. Bachman’s sparrow populations had non-significant
increases across the Southeast Coastal Plain. This recent increase is likely due to the substantial
restoration efforts through America’s Longleaf and specific targeted management for this species.
19Prescribed fire in longleaf pine
Figure 10. Acres of prescribed fire in longleaf pine from 2015-2020.
Yearly trend
Prescribed fire in longleaf pine decreased by about 2% per year from 2014-2019.
On track to meet SECAS goal
No. The decline of about 8% every 4 years is not on track to reach the SECAS goal of a 1% increase
every 4 years.
Data source
America’s Longleaf Range-wide Accomplishment Reports
Confidence in trend
Medium. While the range-wide tracking system for prescribed fire in longleaf is not perfect, its strong
coverage of significant geographic areas means it likely documents a large percentage of prescribed
fire in longleaf over this period.
20Interpretation
This is an indicator of habitat management in one part of the pine and prairie ecosystem. Prescribed
fire is also important outside of the longleaf range, but sufficient trend data wasn’t yet available in
those areas. For the first time in the 3-year history of this report, prescribed fire in longleaf switched to
a declining trend. Despite the COVID-19 pandemic, prescribed fire did increase between 2019 and
2020—a major achievement. That said, the overall declining trend over the last 6 years suggests that
more work will be needed to maintain the restoration momentum in this important ecosystem.
Salt marsh area
Figure 11. Percent change per year in area of estuarine emergent wetland between 2010 and 2016.
Yearly trend
Salt marsh area declined across most states. Total salt marsh area in the SECAS region declined by
0.03% per year from 2010-2016.
On track to meet SECAS goal
No. The decline of about 0.12% every 4 years is not enough to reach the SECAS goal of a 1% increase
every 4 years.
21Data source
NOAA C-CAP Regional Landcover
Confidence in trend
Medium. The remotely sensed data used in this indicator provides full coverage of the region, but
yearly weather variations can influence how well it classifies estuarine emergent wetlands.
Interpretation
This is a coarse indicator of the overall extent of potential habitat in salt marshes. Sea-level rise is
having major impacts on salt marshes and this indicator tracks how well salt marshes are keeping up
with pressure from rising seas.
Salt marsh area declined across most states. Two exceptions were in Mississippi and Louisiana. These
increases are likely from the substantial amount of marsh restoration in these areas after the 2010
Deepwater Horizon oil spill in the Gulf of Mexico. Longer-term declines suggest that without continued
focus on marsh restoration these increases may be temporary. From 2006-2016 (not depicted), these
two states and all other Southeastern states had declines in salt marsh area.
Upland forest area
Figure 12. Millions of acres of various forest types in 2011 and 2016.
22Table 5. State-specific percent change in forest area from 2011-2016.
Evergreen Mixed Deciduous Overall
Alabama 3.36 1.95 0.52 2.01
Arkansas 1.12 0.62 0.18 0.49
Florida 0.67 -1.42 2.26 1.07
Georgia -1.75 0.62 -0.45 -0.48
Kentucky 1.75 1.74 0.56 0.79
Louisiana 5.69 -0.71 0.82 2.59
Mississippi 2.54 0.83 -1.26 0.98
Missouri -0.73 1.28 0.27 0.33
North Carolina 2.61 1.4 -0.49 0.74
Oklahoma 0.81 3.29 1.67 1.62
South Carolina -1.43 1.99 -0.01 -0.58
Tennessee 3.45 2.11 1.26 1.5
Texas 2.18 1.12 -0.43 1.3
Virginia -2.21 1.05 -1.3 -0.6
West Virginia 1.55 0.84 -0.47 -0.27
Yearly trend
Overall area of upland forest increased by approximately 0.14% per year from 2011-2016. While that
translates to a gain of approximately 280,000 acres per year, it is still a relatively small percent change
given the large forest area across the Southeast. Evergreen, mixed, and deciduous forest area all
increased during this time period. Forest area overall also increased for most states.
On track to meet SECAS goal
No. The increase of about 0.56% every 4 years is not enough to reach the SECAS goal of a 1% increase
every 4 years.
23Data source
National Land Cover Database (NLCD)
Confidence in trend
High. The remotely sensed data used in this indicator provides full coverage of the region and forests
typically have high classification accuracy.
Interpretation
This is a coarse indicator of the overall extent of potential habitat in the upland forest ecosystem.
Conversion back to forest, particularly from areas classified as hay/pasture, is outpacing conversion of
forests to urban and row crops. This estimate of forest area change may even be an underestimate of
forest area increase as the new NLCD classifies many small linear forest fragments surrounded by
development as developed open space. While more forest can be good for many upland species,
additional forest often comes at the expense of grassland and early successional habitat. For more
information on these possible impacts, see the pine and prairie bird indicator.
Upland forest birds
Figure 13. Percent of upland forest bird species that are increasing or declining by state from 2014-2019.
24Table 6. Species trend data from 2014-2019 for each state used in Figure 13 above. Brighter colors indicate
higher confidence.
Cerulean Louisiana Worm-eating
Wood thrush
warbler waterthrush warbler
Decline - Low Decline - Low Decline - Low
Alabama
confidence confidence confidence
Decline - Low Increase - Low Decline - Low Decline - Low
Arkansas
confidence confidence confidence confidence
Decline - Low Decline - Low
Florida
confidence confidence
Increase - Low Decline - Low Increase - Low
Georgia
confidence confidence confidence
Decline - Low Increase - Low Increase - Low Increase - Low
Kentucky
confidence confidence confidence confidence
Increase - High Decline - Low Increase - Low
Louisiana
confidence confidence confidence
Decline - Low Increase - High Decline - Low Decline - Low
Mississippi
confidence confidence confidence confidence
Increase - Low Increase - Low Increase - Low Increase - Low
Missouri
confidence confidence confidence confidence
Decline - Low Decline - Low Increase - Low Decline - Low
North Carolina
confidence confidence confidence confidence
Decline - Low Increase - Low Increase - Low
Oklahoma
confidence confidence confidence
Increase - Low Decline - Low Decline - Low
South Carolina
confidence confidence confidence
Increase - Low Increase - Low Decline - Low Decline - Low
Tennessee
confidence confidence confidence confidence
Increase - High Decline - Low Decline - Low
Texas
confidence confidence confidence
Decline - Low Decline - Low Increase - Low Increase - Low
Virginia
confidence confidence confidence confidence
Increase - Low Increase - Low Increase - Low Increase - Low
West Virginia
confidence confidence confidence confidence
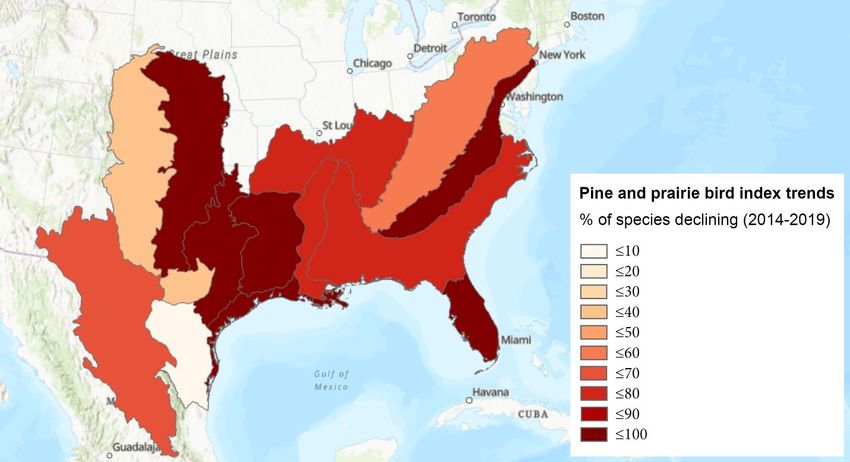
25Figure 14. Percent of upland forest bird species declining from 2014-2019 by Bird Conservation Region (BCR).
Yearly trend
A slight majority of states showed increasing trends for upland forest bird species from 2014-2019.
Species trends were mixed across states. Species selected are Regional Species of Greatest
Conservation Need for states in the Southeast, primarily occur in this ecosystem, and have sufficient
data for trend analysis in the Breeding Bird Survey. High confidence trends were statistically
significant while low confidence trends were not. Averaging species trends across species and states
results in an overall 0.23% increase per year.
On track to meet SECAS goal
No. The increase of about 0.92% every 4 years is not quite enough to achieve the SECAS goal of a 1%
increase every 4 years.
Data source
Breeding Bird Survey (BBS)
26Confidence in trend
Medium. Despite issues with roadside sampling and detectability for some species, the BBS is a
standardized and randomized sample regularly used to estimate bird population trends. The mixed
patterns across species and the low number of statistically significant (“high confidence”) trends
suggests that overall, upland forest birds may be stable, slightly increasing, or slightly decreasing,
with major variations in trends within species.
Interpretation
This is an indicator of both local and landscape conditions across the upland forest ecosystem. The
mixed trends across species highlight competing changes in this ecosystem: increasing forest area
and increasing forest fragmentation. Each species likely responds differently depending on where
those changes are occurring.
However, these species are all neotropical migrants, and threats to survival during migration (e.g.,
communication towers) and on their wintering grounds (e.g., habitat loss) are likely also impacting
population trends.
27Function
The benefits provided to people by species and ecosystems
Working lands conservation
Figure 15. Percent change in acres per year under all U.S. Department of Agriculture (USDA) conservation
practices from 2015-2020. Caribbean includes both Puerto Rico and the U.S. Virgin Islands.
28Table 7. Working lands conservation metrics for 2020 for each state used in Figure 15 above. Caribbean
includes both Puerto Rico and the U.S. Virgin Islands.
# of conservation
% of state composed of Acres of conservation
State practices/acre of
private land practices (2020)
private land (2020)
Alabama 95.24 2,384,324 0.07
Arkansas 88.56 6,211,121 0.21
Caribbean 95.10 37,226 0.01
Florida 75.57 1,437,251 0.04
Georgia 93.43 3,564,081 0.10
Kentucky 94.85 1,013,557 0.04
Louisiana 91.02 3,431,829 0.11
Missouri 93.49 11,963,013 0.29
Mississippi 91.26 3,164,320 0.11
North Carolina 90.58 624,856 0.02
Oklahoma 96.61 2,936,612 0.07
South Carolina 93.26 1,135,824 0.06
Tennessee 91.13 1,663,166 0.07
Texas 96.74 23,095,458 0.14
Virginia 89.40 868,485 0.04
West Virginia 88.86 389,941 0.03
Yearly trend
Most states and territories showed increasing trends for acres under conservation practices. Acres
under conservation practices across the entire SECAS area increased by 11% per year.
29On track to meet SECAS goal
Yes. The increase of about 44% every 4 years is on track to meet the SECAS goal of a 1% increase every
4 years.
Data source
USDA data reported as part of the Soil and Water Resources Conservation Act
Confidence in trend
Medium. A substantial amount of working lands conservation in the Southeast occurs through U.S.
USDA programs and the reported acres is likely a reasonable estimate of application of these
programs.
Interpretation
This is an indicator of conservation on working lands. It suggests both across the Southeast and in
most states, conservation on working lands has been increasing by a large amount over the last 5
years. Working lands is a large focus of conservation in the Southeast and it appears that extra effort
working with landowners is resulting in increased adoption of conservation practices.
While acres can vary widely from year to year, relative trends across states are broadly similar when
looking at trends going back to 2010 (not depicted).
Acreage of conservation practices by USDA programs does have a few limitations as an indicator. It
does not include working lands programs administered by states or other organizations and doesn’t
include voluntary actions on working lands not funded by a specific conservation program. Acreage
trends don’t always predict trends in conservation impact as some more expensive practices that
cover smaller areas can sometimes have a bigger overall impact that inexpensive practices covering
large areas.
30Connectivity
The ability of species and ecosystems to move over time
Undeveloped lands in corridors
Figure 16. Percent change per year in undeveloped land within Southeast Conservation Blueprint corridors
from 2013-2019. Overall depicts FL, GA, NC, and SC combined.
Yearly trend
All four states showed declining trends for undeveloped land in corridors. Undeveloped area within
corridors declined by 0.03% per year.
On track to meet SECAS goal
No. The decline of about 0.12% every 4 years is not enough to reach the SECAS goal of a 1% increase
every 4 years.
Data source
National Land Cover Database (NLCD) and Southeast Conservation Blueprint
31Confidence in trend
Medium. While the remotely sensed data used in this indicator provides full coverage of the corridors
within the 4 states, and developed areas have high classification accuracy, full corridor coverage in
the Southeast Conservation Blueprint for the other states in the Southeast is not yet available.
Interpretation
This is an indicator of terrestrial connectivity. Within the 4 states where corridor data is fully available,
it suggests development is continuing to occur in important movement corridors. Like many areas of
the Southeast, these 4 states are experiencing rapid population growth, and other states with similar
growth may have similar trends in undeveloped land within important movement areas. The 2022
version of the Southeast Conservation Blueprint will likely have corridor coverage for most Southeast
states in time for next year’s update of this report.
32Freshwater
Rivers and streams draining into the Atlantic Ocean and Gulf of Mexico
Function
The benefits provided to people by species and ecosystems
Water quality
Figure 17. Percent change in area not impaired from the three most recent 303(d) assessments available per
state/territory.
Yearly trend
When averaged across state trends, overall water quality increased by approximately 0.003% per year.
For all states and territories except North Carolina, the most recent data available was 2014, 2016, or
2018. For North Carolina, the most recent data was 2010. Florida did not report its data in a format
that allowed for trend estimates.
33On track to meet SECAS goal
No. The increase of about 0.012% every 4 years is not enough to reach the SECAS goal of a 1% increase
every 4 years.
Data source
Environmental Protection Agency 303(d) Clean Water Act reports
Confidence in trend
Low. Estimating water quality trends can be particularly challenging. While there are extensive survey
efforts and approaches for standardization across state-specific 303(d) reports, yearly weather
variation over multiple years and different state standards can complicate estimates of water quality
trends.
Interpretation
This is an indicator of overall water quality across the freshwater aquatic ecosystem. Given the low
confidence in the trends, it’s important to not read too much into these initial numbers. That said,
these numbers suggest mixed trends across different states and a lack of strong consistent
improvement or decline across the Southeast.
34Connectivity
The ability of species and ecosystems to move over time
Aquatic connectivity
Figure 18. Percent decrease in number of dams since 2013, from 2014-2018.
Yearly trend
Aquatic connectivity, based on overall number of dams, increased by 0.004% per year from 2013-
2018.
On track to meet SECAS goal
No. The increase of about 0.016% every 4 years is not enough to reach the SECAS goal of a 1% increase
every 4 years.
Data source
Southeast Aquatic Resources Partnership Aquatic Barrier Database (data available on request; contact
kat@southeastaquatics.net)
35Confidence in trend
Low. While a small increase in overall connectivity is likely, estimating the magnitude of that change is
difficult. Tracking dam removals and the year they are removed is still a challenge. Estimating the
overall number of dams in the region can also be a challenge. The current data are probably
underestimating both the number of dam removals and the total number of dams in the region.
Interpretation
This is an indicator of species’ ability to access habitat within the rivers and streams of the region.
While the increases are relatively small, this is another example of an ecosystem condition that is
improving over time. Maintaining improvements in aquatic connectivity may be a challenge in the
near future as coastal communities explore creating new dams and reservoirs in response to
increased flooding from intense storms and sea-level rise.
36Estuarine & marine
From estuaries to the open ocean at the edge of U.S. waters
Health
The condition of species and the ecosystems they depend on
Coastal condition
Figure 19. Percent of the Southeast rated “good” for various coastal condition metrics in 2010 and 2015.
Table 8. Change in percent “good” from 2010 – 2015 for each of the subregions used in Figure 19 above
(South Atlantic, Gulf of Mexico).
Eutrophication condition Sediment quality Biological condition Overall
South Atlantic -4 7 -1 .67
Gulf of Mexico 2 27 3 10.67
Yearly trend
When averaged across subregions, overall coastal condition increased by 1.1% per year from 2010 to
2015. Condition improved in the South Atlantic and Gulf of Mexico.
37On track to meet SECAS goal
Yes. The increase of about 4.4% every 4 years is on track to meet the SECAS goal of a 1% increase
every 4 years.
Data source
National Coastal Condition Assessment
Confidence in trend
Medium. While this is a well-designed, randomized survey, it is only a snapshot in time every few
years.
Interpretation
This is an indicator of the overall condition of the water and sediment in the estuaries and nearshore
marine areas of the Southeast. From 2005/2006 (not depicted in graph) to 2015, condition has been
declining in the South Atlantic and improving in the Gulf of Mexico. This new 2015 data suggest
continued improvements in the Gulf and a small recent improvement in the South Atlantic that
doesn’t offset previous declines.
38Function
The benefits provided to people by species and ecosystems
Fisheries
Figure 20. Percent of fisheries not overfished or overfishing from 2015-2018.
Yearly trend
Overall fisheries condition has improved by approximately 0.56% per year from 2015-2018. The
condition of highly migratory, Gulf, and Caribbean fisheries improved while South Atlantic fisheries
condition declined.
On track to meet SECAS goal
Yes. The increase of about 2.2% every 4 years is greater than the SECAS goal of a 1% increase every 4
years.
Data source
National Oceanic and Atmospheric Administration reports to Congress on the status of U.S. fisheries
39Confidence in trend
Medium. Stock status assessments can be challenging, but extensive work and data go into assessing
these statuses every year.
Interpretation
This is an indicator of management for the most important estuarine and marine fisheries of the
Southeast. Fishing is only one of the many stressors faced by the fisheries of the Southeast. Overall
improvements in fishery management make important contributions to the SECAS goal, but broader
ecosystem-based approaches will be important for sustaining fisheries at desired levels into the
future.
40Image credits
• Ecosystem icons (terrestrial, freshwater, estuarine and marine) from the University of
Maryland Center for Environmental Science Integration and Application Network
• Health, function, and connectivity icons from the Noun Project
o Health: Health by Alzam from the Noun Project
o Function: People by Kiran Shastry from the Noun Project
o Connectivity: Chain by Robert Bjurshagen from the Noun Project
41You can also read