RECOMMERCE - EXTENDING THE LIFE OF GOODS NYSE: ELA - Fall 2021 Investor Presentation - Envela
←
→
Page content transcription
If your browser does not render page correctly, please read the page content below
RECOMMERCE - EXTENDING
      THE LIFE OF GOODS

               NYSE: ELA
                       Fall 2021
              Investor Presentation
Cautionary Statements

This presentation contains “forward-looking statements” within the meaning of Section 27A of the Securities
Act of 1933 and Section 21E of the Securities Exchange Act of 1934, that is, statements that address future,
not past events. In this context, forward-looking statements often address our expected future business and
financial performance and financial condition. Forward-looking statements by their nature address matters
that are, to different degrees, uncertain. These statements are based on assumptions of future events that
may not prove accurate. They are also based on our current plans and strategy and such plans and strategy
could change in the future. Actual results may differ materially from those projected or implied in any forward-
looking statements.

Please refer to our most recent SEC filings, including our 2020 Annual Report on Form 10-K, subsequently
filed Quarterly reports on Form 10-Q, as well as our other filings with the SEC, for detailed information
regarding factors that could cause or contribute to actual results differing materially from those expressed or
implied in such forward-looking statements. We do not undertake to update our forward-looking statements,
except as required by law.

                                                                                                                   2
and its subsidiaries engage in diverse business
activities within the recommerce sector.
These include recommercializing luxury hard assets, consumer electronics and IT
equipment; and end-of-life recycling solutions.

•   Ticker Symbol – NYSE American: ELA
•   Company HQ: Irving, Texas
•   Number of employees: 220
•   Annual Revenue Run Rate: $126.8M

•   Two Primary Business Segments
•   DGSE Retail Locations: 6
•   ECHG Locations: 2
•   Year Founded: 1965

                                                                                  3
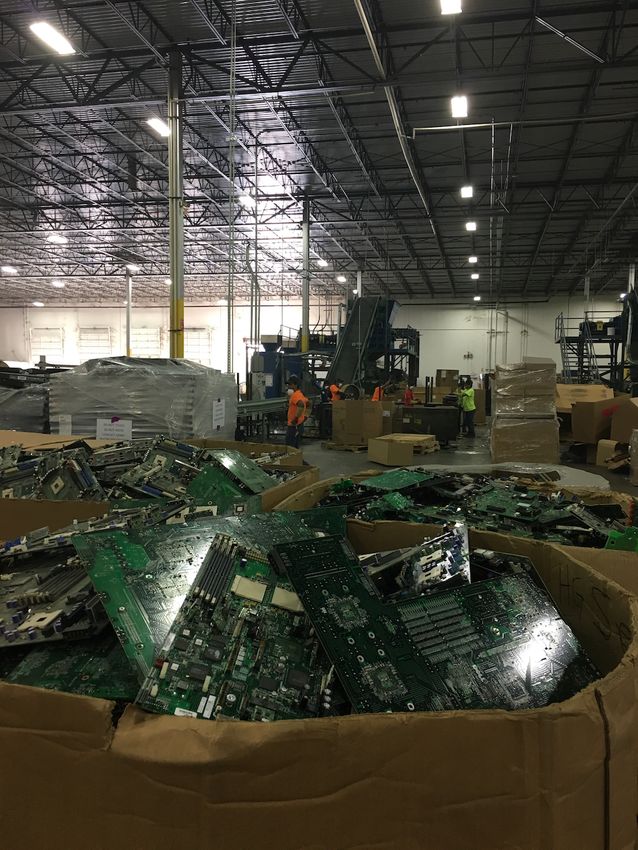
Industry Problems

Electronic waste is likely the fastest-growing waste stream in the world
• Estimated $60 billion (50 million tons) of global electronic waste generated annually
• Toxic chemicals from electronic waste (e.g., mercury, lead, beryllium, cadmium) are extremely harmful to
   people and surrounding environments
• Less than 20% of electronic waste is recycled

Private, individual ownership of devices fragments electronic waste
• Lack of proper recycling channels increases likelihood of improper disposal by individuals

Knowledge and experience required to authenticate jewelry, avoid buying fakes
• Fakes are getting better and more frequent as recommerce market grows
• Accurate authentication mitigates losses and prevents selling counterfeits to customers

                                                                                                             4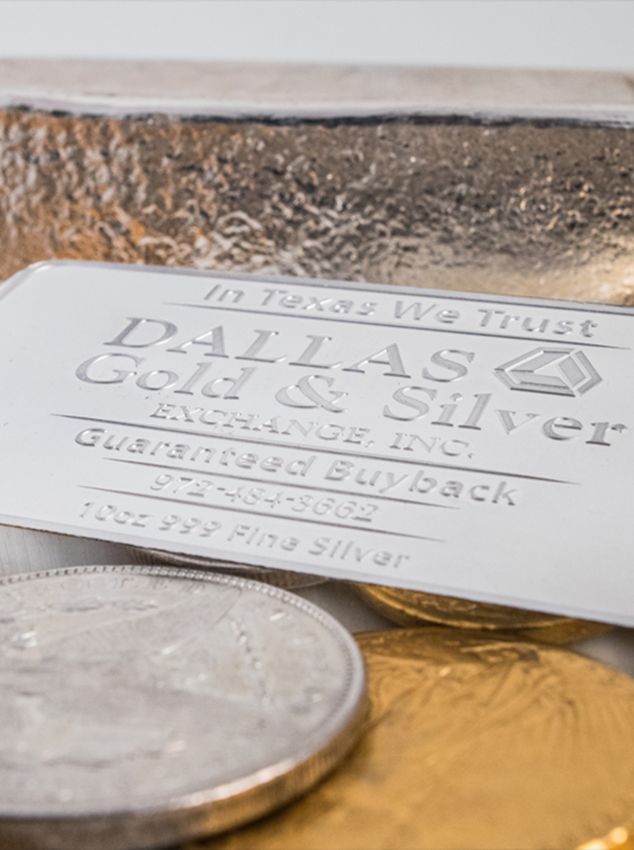
What is Recommerce?
Re·com·merce / rē kämǝrs / Recommercialization

The process of reselling previously-owned products
as whole goods, or recycling items’ components/
materials for reuse.

Recommerce is the foundation of the circular
economy — an economic system aimed at eliminating
waste and driving continued reuse of existing
resources.

                                                     5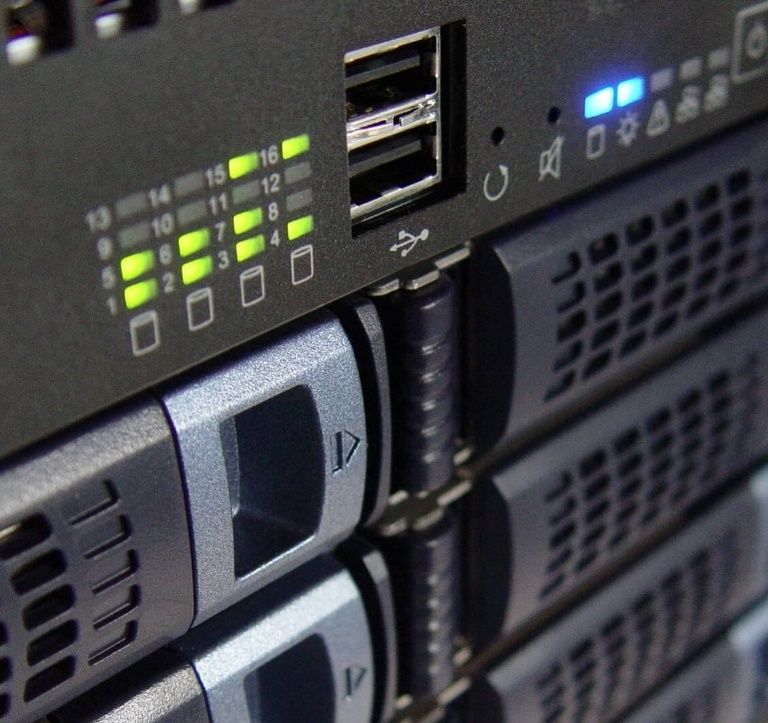
Our Recommerce Solutions: Extract – Resell - Reuse

End-of-life recycling includes traditional recycling performed by waste-management companies. But
for specialists like Envela, it also entails extracting, collecting, and reselling high-value components,
metals, and other materials.

        Jewelry styles change over time, but their high-value metals can be recycled for use in new, future
        designs

        Cellphone technology quickly becomes outdated, but the metals and materials used in their
        components are like those in newer phones. Recycling these metals and materials delivers value
        and preserves our environment

              Recommerce done right includes not only reselling whole goods, but also
                recycling end-of-life items to harvest their components or reuse their
                                           metals/materials

                                                                                                              6
Recommerce

                        Evaluating potential
                        recommerce inventory
Recommerce requires     includes:

accurately assessing    1
                        •   Determining resale value

prospective inventory       of items as a whole,
                            perhaps requiring

for resale, reuse, or       refurbishment or
                            upgrading

recycling               2
                        •   Calculating recycle value
                            of reusable product
                            components

                                                        7
Recommerce Consumer and Market Trends

                                               rate at which
             of 18-29-year-olds favor          recommerce merchants
   74%       sustainable, recycled,      4x    are growing faster than
             or reused products                retail

             women purchased pre-              estimated size of
   56M       owned handbags in          $58B   e-waste market by 2021
             2018

             of toxic, heavy metals            countries have already
   40%       in landfills are from       78    passed legislation to
             consumer electronics              control e-waste

                                                                         8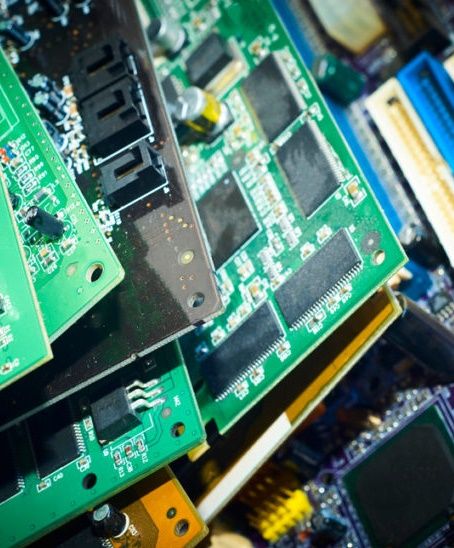
Growing Total Addressable Market
       Online
                                                               Most common recommerce items
                             Brick &
                             Mortar                        Sold as whole goods
                                                            • Cars
                                                            • Jewelry
                                                            • Clothing
                                                            • Electronics
                                                            • Gym equipment
                                                 ►          • Furniture
                                                            • Musical instruments

                                                           Recycled for component resale or refining
                                                            • Printer ink
                                                            • Jewelry (precious metals & gems)
                                                            • Electronics (copper, metals, and REEs)
                                                            • Steel
                       Recent
                      additions

                Global resale has grown into a trillion-dollar marketplace                             9
Our business operates in two primary divisions

Preserving the environment is at the heart of our business model. In a resource-constrained world, we must
optimize the use of natural resources. We are committed to help enable the circular economy through recommerce.

Principally operates a portfolio of three                  Two operating subsidiaries in the recommerce of
proprietary retail brands in the recommerce of             consumer electronics, IT equipment, and
luxury assets (jewelry, diamonds, watches,                 valuable components and materials
bullion, rare coins & currency)

                                                                                                                  10
DGSE Proprietary Retail brands
RETAIL EXCHANGE STORES
A leading marketplace for authenticated luxury hard
assets. Our retail stores offer a marketplace for the
public and dealers to buy, sell & trade fine jewelry,
watches, fine art, and luxury items. An in-house staff of
experts, including horologists, gemologists, and
authenticators, inspect items for authenticity and
resale value as whole goods or for recycling
11DGSE Proprietary Retail brands
ONLINE PRECIOUS-METAL SALES
Precious metals garnered from our retail locations are
sold through Bullion Express, one of the region’s largest
precious-metals dealers. Through this channel we offer
a wide selection of gold, silver, platinum, and palladium
coins, bars, bullion rounds, collectibles, and other
numismatic products from mints around the world
12DGSE entities recommercialize hard assets (jewelry, diamonds,
fine watches, rare coins and currency, precious-metal bullion,
collectibles) as refurbished whole goods or recycles them–
reusing their components or refining their metals.
Where we acquire recommerce inventory
Individuals selling items provide most of refurbished/repaired inventory of
whole goods, recycled components, certified gems, and precious metals (gold,
silver, platinum and palladium) for extraction/refining/resale
Inventory-assessment methods and ROI
Professional jewelers evaluate
customers’ items for ~35% gross profit resold whole goods
authenticity and their market at retail
value as whole goods, or the
recycled value of the items’ ~5% gross profit recycled components,
component parts, precious certified gems, or refined metals
metals or gems
13ECHG Subsidiaries
Sustainability is the
core of our business.
We help industries
• Custom-designed, • Tailored solutions return securely and
comprehensive end-of-life reusable whole responsibly reuse,
electronics-recycling products into the supply recycle and manage
solutions meet customers’ chain
specific needs the disposal of IT
• Electronics-trade-in equipment and
• Separation and shredding programs, IT asset
processes reduce materials disposition, OEM electronic products.
into their commodity electronics repair and Continually innovating
components (e.g., plastic, refurbishment, reverse to extract more value
metal, glass) for resale and logistics/consumer-returns
remanufacture into new liquidation
from end-of-life assets
products and ensure a more
sustainable future.
14ECHG’s Clients are some of Biggest & Most Valuable
Companies in the World
ECHG helps world-leading brands and retailers accelerate
We work with their sustainability transformations by extending their
companies that are assets’ life cycles.
committed to a low-
carbon future. They
appreciate our help in • Reverse Logistics
achieving their • Returns Management
sustainability goals. • Product Refurbishment
• Consumer Trade-Ins
This year we received • Product Demanufacturing
the 2021 Verizon • End-of-Life Recycling
Sustainability Award. • IT Asset Disposition
• Recommerce
15ECHG entities recommercialize consumer electronics and IT
equipment; and produce the highest values via resale as whole
goods, or recycling components or metals/materials.
Where we acquire recommerce inventory
Businesses Educational Manufacturers Individuals
that upgrade and other with returned with resale
software or organizations goods or raw items
systems that upgrade materials
systems
Inventory assessment and ROI
~60% gross profit refurbished goods
A team of industry experts assess
inventory for its whole-good or
~45% gross profit recycled
recycled-market value. Items that
components or refined materials
meet threshold requirements are
acquired by lots as recommerce
Fee-based services for disposing
inventory.
sundry items or materials
16Continually broaden our participation
in the environmental sector.
Focus on most profitable B2B and B2C segments for
1
reselling and recycling
Leverage economies of scale, develop interdivisional
2 synergies, reduce marketing costs for whole and recycled
goods
Growth Strategy 3
Utilize our extensive network to discover new
recommerce sectors
Consistently communicate and align with downstream
4 material/component recyclers to increase margins and
markets for our inventories
5 Capitalize on the expanding ESG movement
17Growth & Expansion Initiatives
DGSE
• Increase number of operating stores by opening new locations in current markets
(Dallas/Fort Worth and Charleston, SC) and new markets.
• New-store additions depends on internal-investment success, availability of preferred
sites, regulatory environments, zoning ordinances, capital access, and availability of
qualified personnel.
ECHG
• Expand organically and through acquisitions while building customer loyalty.
• Focus on increasing recurring revenues and expanding margins; help fund acquisitions.
18ESG
• Core focus of company is recycling, reusing and sustainability
• Reducing electronic waste helps reduce CO2 emissions and harmful chemicals in our
environment
• ECHG companies audited and certified to ISO 14001:2015 standard (environmental
management)
• Workforce gender and racial diversity
• ECHG subsidiary named Top 100 Places to Work in DFW
• ECHG companies audited and certified to ISO 45001 standard (Occupational Health & Safety)
• Help local homeless shelter provide jobs and transportation, get folks back on their feet
• Board is 40% Women
• Average board-member tenure less than six years
• Female lead independent director
• CEO receives no salary or stock compensation
19Valuation Benchmarking
Sales EPS EV / P/E
Company Ticker EV TTM TTM Sales TTM Sector Product focus Distribution
Luxury clothing for men and
THE REALREAL REAL $1.79B $320M $-1.81 5.59x - Recommerce Online and Retail
women
Consignment luxury clothing Online and Retail
THREDUP TDUP $2.34B $193M $-3.75 12.13x - Recommerce
for men and women (pending)
POSHMARK POSH $2.74B $286M $-2.37 9.59x - Recommerce Clothing and home goods Online
WINMARK
WINA $737M $73M $9.25 10.10x 21.95x Recommerce Clothing and sporting goods Retail
CORPORATION
LI-CYCLE HOLDINGS
LICY $2.05B $14M e $-8.79 146.4x - Recycling Lithium-ion battery recycling Wholesale
CORP.
Luxury hard assets,
Recommerce
ELA $131M $127M $0.33 1.03x 15.2x electronics, IT equipment, Online and Retail
& Recycling
end-of-life goods
At the current price, Envela trades well below the
multiple of other recommerce and recycling peers
Source: Yahoo! Finance 20Competitive Advantages
Deep exposure to both B2C Strong network of partners
and B2B segments and well-established
relationships
Online and brick & mortar
retail-distribution Highly experienced and
expertise disciplined teams
Economies-of-scale Revenue and cost
synergies between synergies between
business units business units
21The recommerce sector is growing 4x faster than retail and
expected to accelerate after coronavirus pandemic
Two divisions with operating companies focused on the
highest volume/value recommerce products
Robust network of partners to quickly sell valuable
inventory to wholesale customers and third-party refiners
Investment Online and brick & mortar retail-distribution expertise;
Highlights experienced evaluators quickly and accurately assess
recommerce values
Exposure to both B2C and B2B segments provides deep
insight into market demand and pricing
Knowledgeable management team with deep industry
experience and expertise
22Financial Performance
Total Sales Gross Margin
45000 7400
40000 7200
Dollars (Thousands)
Dollars (Thousands)
35000 7000
30000 6800
25000 6600
20000 6400
15000 6200
10000 6000
5000 5800
0 5600
Q2 2021 Q1 2021 Q4 2020 Q3 2020 Q2 2021 Q1 2021 Q4 2020 Q3 2020
Net Income EPS
3500 0.12
3000 0.1
Dollars (Thousands)
2500
Dollars/Share
0.08
2000
0.06
1500
0.04
1000
500 0.02
0 0
Q2 2021 Q1 2021 Q4 2020 Q3 2020 Q2 2021 Q1 2021 Q4 2020 Q3 2020
23ELA income statement
For the YEARS Ended December 31 For the THREE MONTHS Ended June 30
FY 2019 FY 2020 2Q 2020 2Q 2021
TOTAL SALES $ 82,024,497 $ 113,922,015 $ 20,545,607 $ 33,724,006
Cost of Sales 65,768,655 90,853,052 16,074,349 26,596,116
Gross Margin $ 16,255,842 $ 23,068,963 $ 4,471,258 $ 7,127,890
EXPENSES
Sales, General and Administrative Expenses 12,494,510 15,553,274 3,616,670 4,831,225
Loss on Disposal of Equipment - - - -
Depreciation and Amortization 520,298 728,626 179,706 216,219
Total Cost of Revenue 13,014,808 16,281,900 3,796,376 5,047,444
Operating Income/(Loss) 3,241,034 6,787,063 674,882 2,080,446
Other Income, net 49,756 306,997 51,866 283,055
Interest Expense (414,961) (620,499) 144,297 177,704
INCOME BEFORE TAXES 2,875,829 6,473,561 582,451 2,185,797
Income Tax Expense 95,116 89,618 16,277 32,685
NET INCOME $ 2,780,713 $ 6,383,943 $ 566,174 $ $2,153,112 Ó 280%
Earning Per Share 0.10 0.24 0.02 0.08
Basic 26,924,381 26,924,631 26,924,381 26,924,381
Diluted 26,924,631 26,924,631 26,924,381 26,924,381
2019 v. 2020 Sales Growth (in $ Millions) 2019 v. 2020 Gross Profit Growth (in $ Millions) 2021 Q2 Sales Growth (in $ Millions) 2021 Q2 Gross Profit Growth (in $ Millions)
$ 33.7 M $ 7.13 M
$ 23.1 M
$ 114 M
$ 82 M $ 20.5 M $ 4.47 M
Ó $ 16.3 M Ó Ó Ó
39% 42% 64% 59%
FY2019 FY 2020 FY 2019 FY 2020 2Q 2020 2Q 2021 2Q 2020 2Q 2021
24Division Sales Performance
Q2 2020 Margin Q2 2021 Margin Q2 2020 Margin Q2 2021 Margin
Resale of Whole Goods $ 13,421,969 10.8% $ 20,893,838 12.8% $ 4,257,032 47.5% $ 8,595,910 35.1%
Resale of Recycled Components / Materials $ 927,060 18.3% $ 2,118,486 19.7% $ 1,939,546 43.0% $ 2,115,772 47.8%
TOTAL $ 14,349,029 $ 23,012,324 $ 6,196,578 $ 10,711,682
Q2 2021 Quar ter Highlights DGSE 2021 Q2 Sales Growth (in $ Millions) ECHG 2021 Q2 Sales Growth (in $ Millions)
§ Gross Profit increased to $7.1 m illion
§ Net incom e w as $2.15 m illion, or $0.08 per basic and
$ 23.0 M $ 10.7 M
diluted share versus $0.02 per share in 2Q 2020. Ó Ó
$ 14.3 M 61% $ 6.2 M 73%
§ Consolidated Gross Profit Margin w as 21.1%
§ DGSE's operations increased by $8.7 m illion or 60% to
$23.0 m illion
§ Resale revenue at DGSE, such as bullion, jew elry, 2Q 2020 2Q 2021 2Q 2020 2Q 2021
w atches, and rare coins, increased $7.5 m illion, or 55%
com pared to the sam e period last year. DGSE 2021 Q2 Sales Mix ECHG 2021 Q2 Sales Mix
§ Recycled-m aterial sales at DGSE increased 128% to
$2.1 m illion.
§ Revenues related to ECHG's operations w ere $10.7
m illion.
§ Resale revenue at ECHG accounted for 80% of its total
sales at $8.6 m illion.
§ Recycled-m aterial sales at ECHG accounted for 20% of
its total sales at $2.1 m illion. Res ale Rec yc led Res ale Rec yc led
25Corporate Snapshot
$8.4M ~71% $104.3M
Total Cash and Cash
Insider Ownership Market Cap
Equivalents
(7-16-21) (7-16-21)
(3-31-21)
26.9M $139M 11
Shares Outstanding Forecasted 2021 Straight Quarters of
(5-4-21) Revenue Profitability
26Headquarters Campus: Investor Relations Contact:
Envela Corporation Matt Glover and John Yi
1901 Gateway Drive Gateway Investor Relations
Irving, Texas 75038 949-574-3860
ELA@gatewayir.comYou can also read