Reducing Perceived Risk and Promoting Digital Inclusion for Older Australians - ACCAN
←
→
Page content transcription
If your browser does not render page correctly, please read the page content below

Reducing Perceived Risk and Promoting Digital Inclusion for Older Australians
Reducing Perceived Risk
and Promoting Digital
Inclusion for Older
Australians

 Bernardo Figueiredo, Torgeir Aleti, Mike Reid, Diane M. Martin, Larissa Hjorth, Mark
                    Buschgens, Jozica Kutin, and Jacob Sheahan

Shaping Connections Research Program, School of Economics, Finance, and Marketing,
                                 RMIT University

                                    August 2021
Reducing Perceived Risk and Promoting Digital Inclusion for Older Australians

Authored by Bernardo Figueiredo, Torgeir Aleti, Mike Reid, Diane M. Martin, Larissa Hjorth, Mark
Buschgens, Jozica Kutin, and Jacob Sheahan

Published in 2021

This project was funded by a grant from the Australian Communications Consumer Action Network
(ACCAN).

The operation of the Australian Communications Consumer Action Network is made possible by
funding provided by the Commonwealth of Australia under section 593 of the Telecommunications
Act 1997. This funding is recovered from charges on telecommunications carriers.

Shaping Connections Research Program
School of Economics, Finance, and Marketing, RMIT University
Website: https://www.shapingconnections.org/
Email: bernardo.figueiredo@rmit.edu.au
Telephone: 03 9925 5866

Australian Communications Consumer Action Network (ACCAN)
Website: www.accan.org.au
Email: grants@accan.org.au
Telephone: 02 9288 4000

If you are deaf or have a hearing or speech impairment, contact us through the National Relay
Service: https://www.communications.gov.au/what-we-do/phone/services-people-
disability/accesshub/national-relay-service/service-features/national-relay-service-call-numbers

DOI: https://doi.org/10.25916/nwc7-7b81
ISBN: 978-1-921974-69-4
Image credits:
Cover image and images pp 33, 47, 51-53, 55: Peter Kindersley, courtesy of Centre for Ageing Better,
accessed 2021
Images of participants (pp17-22) were taken by the authors and are used with consent.

This work is copyright, licensed under the Creative Commons Attribution 4.0 International Licence.
You are free to cite, copy, communicate and adapt this work, so long as you attribute the authors,
RMIT University and University of the Third Age, supported by a grant from the Australian
Communications Consumer Action Network. To view a copy of this licence, visit
http://creativecommons.org/licenses/by/4.0/

This work can be cited as: Figueiredo, B., Aleti, T., Reid, M., Martin, D. M., Hjorth, L., Buschgens, M.,
Kutin, J., & Sheahan, J. 2021, Reducing Perceived Risk and Promoting Digital Inclusion for Older
Australians, Australian Communications Consumer Action Network, Sydney.
Contents
i.        Tables .............................................................................................................................................. 4

ii.       Figures ............................................................................................................................................. 5

iii.      Acknowledgements......................................................................................................................... 6

iv.       Glossary ........................................................................................................................................... 7

v.        Reading and Accessibility Guide ..................................................................................................... 8

       What makes a document ‘accessible’? ............................................................................................... 8
          Changing the size of text in a Word document............................................................................... 8
          Using a screen reader to explore a Word document ...................................................................... 8
vi. Executive Summary ............................................................................................................................ 9

       Overview ............................................................................................................................................. 9
       Methods .............................................................................................................................................. 9
       Findings ............................................................................................................................................. 10
1 Introduction ....................................................................................................................................... 11

       1.1 Purpose ....................................................................................................................................... 11
       1.2 Background ................................................................................................................................. 11
          1.2.1 Project Objectives ................................................................................................................ 11
       1.3 Research Partners ....................................................................................................................... 12
          1.3.1 University of the Third Age (U3A) Network Victoria ............................................................ 12
          1.3.2 RMIT Consumer Wellbeing Research Group........................................................................ 12
          1.3.3 RMIT Consumer Culture Insights Group .............................................................................. 12
          1.3.4 RMIT Digital Ethnography Research Centre (DERC) ............................................................. 12
          1.3.5 City of Whittlesea (CoW)...................................................................................................... 12
       1.4 Context ........................................................................................................................................ 13
          1.4.1 Perceived Risk ...................................................................................................................... 13
          1.4.2 Participatory Strategies ........................................................................................................ 13
          1.4.3 Digital Inclusion .................................................................................................................... 14
       1.5 Project Schedule ......................................................................................................................... 14
          1.5.1 Explore and Quantify ........................................................................................................... 14
          1.5.2 Understand .......................................................................................................................... 15
          1.5.3 Co-design.............................................................................................................................. 15

                                                            ACCAN GRANTS PROGRAM

                                                                                1
1.5.4 Disseminate.......................................................................................................................... 16
2 Methodology ...................................................................................................................................... 17

   2.1 Exploratory Interviews ................................................................................................................ 17
       2.1.1 Data Analysis ........................................................................................................................ 18
       2.1.2 Sample Characteristics ......................................................................................................... 18
   2.2 Survey.......................................................................................................................................... 18
       2.2.1 Recruitment and Survey Distribution .................................................................................. 18
       2.2.2 Data Analysis ........................................................................................................................ 18
3 Results ................................................................................................................................................ 19

   3.1 Exploratory Interviews ................................................................................................................ 19
       3.1.1 Interviewee Profiles ............................................................................................................. 20
   3.2 Survey.......................................................................................................................................... 24
       3.2.1 Demographics ...................................................................................................................... 24
       3.2.2 ICT Device Ownership and Use ............................................................................................ 27
       3.2.3 Digital Literacy...................................................................................................................... 29
       3.2.4 Perceptions & Experiences of ICT Use ................................................................................. 34
       3.2.5 Influences on ICT Use ........................................................................................................... 37
       3.2.6 Risk ....................................................................................................................................... 43
       3.2.7 Exposure to Fraud & Scams ................................................................................................. 49
4 Conclusions ........................................................................................................................................ 53

   4.1 ICT Use of Older Adults ............................................................................................................... 54
   4.2 Perceived Risks of Technology in Older Adults ........................................................................... 54
   4.3 Digital Literacy of Older Adults ................................................................................................... 55
5 Recommendations ............................................................................................................................. 57

   Recommendation 1 ........................................................................................................................... 57
   Recommendation 2 ........................................................................................................................... 57
   Recommendation 3 ........................................................................................................................... 57
6 Authors............................................................................................................................................... 58

Appendices............................................................................................................................................ 59

   Appendix 1. Device frequency of use (mean scores) ........................................................................ 59
   Appendix 2. Items and factors measuring digital literacy and internet skills ................................... 60
   Appendix 3. Digital Literacy (mean scores) ....................................................................................... 62

                                                         ACCAN GRANTS PROGRAM

                                                                             2
Appendix 4. Results from a factor analysis of ICT activity engagement items ................................. 63
   Appendix 5. Engagement factor mean scores .................................................................................. 64
   Appendix 6. Items and factors measuring the Technology Acceptance Model ............................... 65
   Appendix 7. Technology Acceptance Model scores ......................................................................... 68
   Appendix 8. Results from a factor analysis of risk and fear items .................................................... 69
   Appendix 9. Perceived risk factor scores .......................................................................................... 71
References ............................................................................................................................................ 72

                                                        ACCAN GRANTS PROGRAM

                                                                            3
i. Tables
Table 1. Online survey respondent demographics ............................................................................... 24

Table 2. Income and education............................................................................................................. 26

Table 3. Types of ICT owned ................................................................................................................. 27

Table 4. Experience of scams or fraud .................................................................................................. 49

                                                    ACCAN GRANTS PROGRAM

                                                                       4
ii. Figures
Figure 1. Device use frequency scores (mean) ..................................................................................... 28

Figure 2. Device use frequency scores for people with high or low digital literacy ............................. 29

Figure 3. Digital literacy scores and age................................................................................................ 31

Figure 4. Digital literacy scores and gender .......................................................................................... 32

Figure 5. Digital literacy scores and relationship status ....................................................................... 33

Figure 6. Activity engagement factor scores (mean) ............................................................................ 35

Figure 7. Activity engagement scores and gender ................................................................................ 35

Figure 8. Activity engagement scores and age ..................................................................................... 36

Figure 9. Activity engagement scores and digital literacy .................................................................... 37

Figure 10. Technology Acceptance Model factor scores ...................................................................... 38

Figure 11. Technology Acceptance Model factor scores by age........................................................... 39

Figure 12. Technology Acceptance Model factor scores by relationship status .................................. 40

Figure 13. Technology Acceptance Model factor scores by digital literacy .......................................... 42

Figure 14. Perceived risk factor scores (mean) ..................................................................................... 45

Figure 15. Perceived risk scores and gender......................................................................................... 46

Figure 16. Perceived risk scores and digital literacy ............................................................................. 48

                                                   ACCAN GRANTS PROGRAM

                                                                     5
iii. Acknowledgements
We would like to thank our partners for their ongoing support: U3A Network Victoria and RMIT
University’s Digital Ethnography Research Centre.

This project is proudly supported and funded by the Australian Communications Consumer Action
Network (ACCAN) and RMIT University.

                                   ACCAN GRANTS PROGRAM

                                                6
iv. Glossary
Definitions of terms commonly used in this document:

ABS                    Australian Bureau of Statistics

ACCAN                  Australian Communications Consumer Action Network

ASCCA                  Australian Seniors Computer Clubs Association

CALD                   Culturally and Linguistically Diverse: a term often used to describe people
                       living in Australia who were born overseas. They may also be people living in
                       Australia who have parent(s) or grandparent(s) born overseas and are
                       predominately from non-English speaking or non-Western countries.

COTA                   Council on the Ageing

COVID-19 Pandemic      A worldwide pandemic of the coronavirus disease 2019 (COVID-19) caused
                       by severe acute respiratory syndrome coronavirus 2 (SARS-CoV-2).

DERC                   RMIT Digital Ethnography Research Centre

ICT                    Information and Communication Technology

MARC                   Melbourne Ageing Research Collaboration

NBN                    National Broadband Network, an Australian national wholesale open-access
                       data network.

RMIT                   Royal Melbourne Institute of Technology

TAM                    Technology Acceptance Model

Telstra                An Australian telecommunications company that builds and operates
                       telecommunications networks, and markets voice, mobile, internet and
                       other products and services.

T-tests                A type of inferential statistic used to determine if there is a significant
                       difference between the means of two groups.

U3A                    University of the Third Age

                                    ACCAN GRANTS PROGRAM

                                                  7
v. Reading and Accessibility Guide
What makes a document ‘accessible’?
People with vision impairments can access the information and services we produce on an equal
footing if documents are accessible for them. Documents are presented by screen readers as a list of
sections, by heading, enabling the user to select which section to read, or more frequently, listen to.
To make use of the accessibility features for this report, we recommend reading it as a Word
document, rather than in a PDF format. This will allow you full functionality of screen readers,
alternative. text and Word functions such as Read Aloud. Below, we describe these functions and
how to use them.
Changing the size of text in a Word document
To increase the size of the text, you can either increase the document size on the screen or the font
size for the entire document.
• To turn on Magnifier, press the Windows logo key + Plus sign (+), or on a Mac device Option
+ Command + Equal sign (=). To turn off Magnifier, press the Windows logo key + Esc, or on a
Mac device use Option + Command + 8 to toggle zoom on and off.
• To zoom in or out, on the status bar (bottom right) of your Office app, click the zoom slider.
• To change the font of an entire Word document, select all of the text, then under Home –
Font, adjust the size of your text
Using a screen reader to explore a Word document
Use Word with your keyboard and a screen reader to explore and navigate the different views and
move between them (Vision Australia recommends the following for Windows: NVDA, JAWS ; and
for Mac: VoiceOver). For Word, Read Mode is designed to make reading text easier and includes
reading tools such as Read Aloud, which can be used without a screen reader if necessary.
• To enable Read Mode, press Alt+W, F, or from the View menu in Word
• To access the Read Mode toolbar, press Alt, and then press the Tab key until you hear the
name of the menu you want, and then press Enter to select it.
• Press the Down arrow key to move down on the list of available options, and press Enter to
select an option.
• To use Read Aloud, press Alt+W, R. To access the reading controls, press the Tab key until
you reach the option you want, and then press Enter to select it.
• To exit Read Mode, press Esc.
ACCAN GRANTS PROGRAM
8vi. Executive Summary1
Overview
This report examines risk perceptions—that is, beliefs about potential harm or
the possibility of a loss. It is a subjective judgment that people make about the
characteristics and severity of a risk.
The report describes the outcomes of stage one of the project, Explore and
Quantify. This includes an analysis of 22 exploratory interviews resulting in 22
video vignettes of older adults’ information and communication technology
(ICT) risk perceptions (March 2021), and findings from a survey of
approximately 400 members from the University of the Third Age (U3A) (June
2021)2
Methods
The focus of this research is to understand how older adults perceive risk
associated with ICT usage and ownership. We used two forms of data
collection:
• Interviews: We conducted 22 interviews with older adults from urban
and rural areas in Victoria, Australia. We asked them about the risks they
associated with ICT. We analysed this data and sorted the answers into
five broad categories. From there, we discovered a range of
subcategories of risk perceptions and how these manifest in beliefs,
feelings, and behaviours.
• Survey: We are conducting a survey (online and paper versions) with the
U3A community and have collected about 400 responses to date.
1 Please note the executive summary has a larger font and straight forward language to enable key
stakeholders, such as older Australians and members of the U3A community, to easily read and
review the contents.
2 Data collection and analysis are ongoing to reach our stated objectives of 20 remote interviews and
over 1,000 completed surveys.
ACCAN GRANTS PROGRAM
9Findings
The pandemic has highlighted and amplified the inequality of perceptions,
access, and digital literacy around ICT practices.
Our recommendations are:
• Deeper investigation and co-design around digital literacy.
• More nuanced methods in understanding barriers in everyday life.
• More extensive exploration into the diversity of women’s digital
practices.
ACCAN GRANTS PROGRAM
101 Introduction
1.1 Purpose
Social exclusion is a significant threat to the wellbeing of older adults. As the COVID-19 pandemic has
highlighted, digital engagement is crucial in fostering social inclusion. Perceived security risks are
one critical demotivator for older adults’ engagement with information and communication
technology (ICT) and the digital economy. While online threats exist, older adults often base security
concerns on perceptions of risk. This project adopts an innovative, multidisciplinary approach that
focuses on co-designing strategies with older adults to consider their lived experiences of ICT—
connecting practice with perceptions. By managing perceived risks, older adults are better equipped
to engage with the digital economy.
1.2 Background
This research is part of ‘Shaping Connections’—an ongoing research collaboration between the
University of the Third Age (U3A) Network Victoria and RMIT University. Shaping Connections is a
research program co-created by RMIT University’s School of Economics, Finance and Marketing, and
the University of Third Age. The program seeks to investigate how technology use supports older
adults’ connectedness and enhances social inclusion and participation. This program brings together
academics and stakeholders with expertise in consumer behaviour, social marketing, consumer
culture theory, and design innovation management.
1.2.1 Project Objectives
This project focuses on understanding older adults’ lived experiences, practices, and perceptions of
risk around ICT use and intervening in current knowledge and implementation strategies. The
multidisciplinary and multimethod project follows a four-stage process: Explore and Quantify,
Understand, Co-create, and Disseminate (see 1.5 Project Schedule for details).
ACCAN GRANTS PROGRAM
111.3 Research Partners
1.3.1 University of the Third Age (U3A) Network Victoria
U3As (Universities of the Third Age) provide lifelong learning to people who are retired or semi-
retired. There are 104 U3As throughout Victoria, offering courses and activities to over 39,000
members who make up the U3A Network Victoria. U3As provide opportunities for retired or semi-
retired people to engage in later life learning, meet new people and share their knowledge and skills
with others. Offerings range from physical fitness to desk-based classes, language studies, art and
craft classes, and social activities.
1.3.2 RMIT Consumer Wellbeing Research Group
The RMIT Consumer Wellbeing Research Group is a multidisciplinary group committed to providing
research and insights into consumer behaviours and influences that facilitate or inhibit consumers’
health, wellbeing, and quality of life. The group’s mission is to address real-world issues primarily
through a social marketing lens, using rigorous methodologies to produce insights, advice, and
interventions that lead to positive economic, social, and environmental impacts. The group works in
collaborative research partnerships with industry, health promotion agencies, government, and
community groups.
1.3.3 RMIT Consumer Culture Insights Group
The Consumer Culture Insights Group (CCIG) is a group of scholars who study consumer behaviour
and emerging markets using research methods based on interviews, observations, and focus groups.
CCIG examines how lived experiences offer important insights into consumers' values, beliefs,
behaviours, and identities, and the ways consumers buy and use products and services. The CCIG
also investigates how changes in everyday consumer culture offer insights for the future. Innovative
organisations, including firms, governments and non-profits, incorporate these insights into
marketing-related decisions in a wide range of ways, including product development, traditional
advertising, social media, and branding.
1.3.4 RMIT Digital Ethnography Research Centre (DERC)
The Digital Ethnography Research Centre (DERC) applies cutting-edge ethnographic approaches to
better understanding how digital tech impacts our present lives and potential futures. DERC’s
projects often involve local communities, with expertise ranging from studies of everyday lived
experience, workplace and organisational analysis, policy and strategy analysis, design ethnography,
co-design workshops, and creative collaborations with communities of practice. The centre has a
strong international base and a mission that impacts people’s lives, governmental policies, and
education methods globally. DERC maintains and develops partnerships with various institutions in
Australia and globally, including other universities, companies, and not-for-profit organisations.
1.3.5 City of Whittlesea (CoW)
Through the City of Whittlesea Positive Ageing Strategy, the Ageing Well department promotes the
many opportunities that an ageing population brings to society. In particular, it promotes the vast
benefits for individuals and the community when people continue to be active, healthy and
ACCAN GRANTS PROGRAM
12participate in the community as they age. It hopes to activate opportunities and choices to improve
wellbeing for people as they age and to achieve a positive change in the way residents live their
lives. The strategy has eight strategic focus areas: 1) Friends, connections and a welcoming
community; 2) Active – socially, mentally, physically; 3) Learning and sharing knowledge; 4) Getting
around; 5) Informed and having a say; 6) Feeling safe; 7) Housing, employment and financial
security; 8) Health and support services when required Through a series of Action Plans, the City of
Whittlesea aims to continuously improve the wellbeing of older people across these eight areas.
1.4 Context
Security concerns are critical reasons for older adults’ lack of engagement with ICT and the digital
economy (Mitzner et al., 2010; Wu, Damnée, Kerhervé, Ware, & Rigaud, 2015). Existing research has
identified and assessed risks involved in ICT engagement, and built programs that outline risks and
help older adults grow skills for ICT engagement. Programs for older adults often focus on enhancing
digital literacy. For example, ‘Be Connected’ encourages older adults to go online, offering resources
and in-person support to develop digital skills and confidence. However, older adults often base
their security concerns on perceptions of risk (Boise et al., 2013; Knowles & Hanson, 2018).
Perceived risks pose barriers to engagement with ICT (Young, Willis, Cameron, & Geana, 2014).
Existing programs have not acknowledged that perceptions of risk can be a significant barrier to
participation.
1.4.1 Perceived Risk
Risk perceptions are beliefs about potential harm or the possibility of a loss. It is a subjective
judgment that people make about the characteristics and severity of a risk. Consumer research has
long demonstrated that perceived risks can inhibit the adoption and usage of products and services
(e.g., Rehman, Baharun, & Salleh, 2020; Ross, 1975). Perceived risk manifests in many ways:
financial, performance, physical, social, time-related, and psychological risk (Stone & Grønhaug,
1993). In an earlier study we conducted with U3A older adults about ICT use, stories about scams,
cyberbullying, and general security threats supported various perceptions of risk, creating resistance
to adoption in some (Aleti, Figueiredo, Reid, Martin, & Wall, 2019). This survey of older Australians
also demonstrates a reluctance to engage with technology because of security concerns. According
to the eSafety Commissioner, 72% of older adults are concerned with devices’ vulnerability to
hacking, and 55% are concerned with having their details stolen when buying online. However, there
are no programs to directly address seniors’ risk perceptions with ICT engagement.
1.4.2 Participatory Strategies
Ethnography and co-design are participatory approaches that engage and empower those being
researched. Research respondents and stakeholders become collaborative experts in the outcomes.
As a result, the project can offer deeper understandings, learnings, and enhanced uptake of
interventions. Following a participatory approach, older adults will also collaborate with researchers
to co-design solutions that will help them to manage perceived risk. Co-design increases the uptake
of solutions as co-designers take ownership of solutions. This type of participatory design is vital to
create solutions that are perceived as relevant, helpful, and valuable by end-users and stakeholders,
building on their current efforts to engage older adults with ICT.
ACCAN GRANTS PROGRAM
131.4.3 Digital Inclusion
Although the number of digitally connected people continues to rise, around 2.5 million Australians
(13.5%) are not online (Thomas et al., 2020). Research from the UK, which has similar overall
connectivity rates, reveals that 90% of those offline are seniors (Lloyds Bank, 2021). Lloyds Bank
(2021) further suggests that the most common reasons for non-use related to concerns about
identity theft, privacy and security, ICT being too complicated or too expensive. This suggests that
seniors are likely to be amongst the most digitally excluded, and that their exclusion is related to
perceptions of risk associated with ICT and the internet.
The Australian Digital Inclusion Index (ADII) (Thomas et al., 2020) measures inclusion based on three
key dimensions: Access, Affordability, and Digital Ability. The ADII compiles numerous variables into
a score ranging from 0 to 100. The higher the overall score, the higher the level of inclusion. The ADII
score for the average Australian is 63. For Australians above 65 years, the score is 49.7 (13.6 points
below the national average). Moreover, the ADII score for those aged 80+ is 39.2, which is 16.7
points lower than those aged 65-69 years (55.9). The ADII data also reveals that 28.7% of those aged
65+ feel empowered by ICT and only 13.3% feel they can keep up with technological changes. Thus,
digital literacy, increased confidence and reduced perception of risk are essential aspects of older
Australians increasing their online presence.
With the impact of the COVID-19 pandemic and the requirement of physical distancing, the
importance of digital literacy and reducing barriers to ICT engagement has increased. The
unevenness of older adults’ digital literacy is a crucial issue that will shape the future wellbeing of all
Australians. The COVID-19 pandemic underscores the need for older adults to learn and engage with
ICT in a safe environment. Non-price factors such as consumers’ lack of confidence and the
perception of risks associated with privacy, security, and online safety create barriers for older
adults’ engagement with ICT. The road to effective ICT engagement in older adults requires
understanding the types and sources of perceived risk and developing strategies to mitigate them.
1.5 Project Schedule
1.5.1 Explore and Quantify
In this initial stage, we explore the language, contexts, and meanings associated with risk
perceptions and ICT use, and quantify the types of perceived risks associated with ICT and their
influence on ICT use and engagement in the digital economy. The exploration led to a survey
instrument and 22 video vignettes, in addition to this research report:
Survey Instrument: The survey was designed to assess and report older adults’ ICT risk perceptions,
motivations, and behaviours.3
Video Vignettes: Remote video interviews have been recorded and edited into a series of video
vignettes showcasing seniors’ perception and language usage around risk perception of ICT
engagement. Transcripts accompany these vignettes for accessibility. The vignettes are valuable
3 Critical survey items will be published in a peer review outlet to support validity and reliability, and
the final instrument will then be made available for others to use.
ACCAN GRANTS PROGRAM
14tools in the co-designing and dissemination stages.
Research Report: The current report explores the target audience’s language, experiences,
quantified findings of risk perceptions, and influence on older consumers’ participation in the digital
economy. This report shall be hosted at the Analysis & Policy Observatory (APO) website.
1.5.2 Understand
By understanding the lived experiences around ICT practices and risk perceptions through an
ethnographic approach, we focused on uncovering discrepancies between practice and perception.
Ethnography places a human face on data through rich real-life stories and emotional behaviour. In
this stage, we reveal critical stories and insights and seek to share them with stakeholders through
an academic paper, and an article for the general public.
1.5.3 Co-design
This stage focuses on developing co-design strategies with end-users and stakeholders to reduce
perceived risk and improve senior’s digital engagement. Co-design sees research respondents as
collaborators and ensures that the learnings and recommendations will be taken up in the end,
supplementing ongoing stakeholders’ efforts to address security issues and improve consumer
confidence. Workshops will result in a digital resource containing tools, including a risk assessment
simulation, guidelines for understanding perceived risk, and a set of strategies.
Co-design Workshops: We will conduct three workshops with end-users and three workshops with
stakeholders. End-users are older adults and users of ICT, and stakeholders are vital members of
older adult networks such as U3A and local councils (including the City of Whittlesea), and other
organisations for digital inclusion. The purpose is to work collaboratively to co-design strategies for
reducing perceived risk and improving digital engagement. These strategies complement
stakeholders with ongoing efforts to minimise security issues and enhance consumer confidence.
Workshops will contain from 12 to 24 respondents depending on the type of group.
Digital Resource with a set of tools: This resource will have web pages targeting end-users and
organisations working for older adults’ wellbeing and digital inclusion. The web pages will be hosted
under the Shaping Connections website. They will outline approaches to including, engaging, and
educating older adults and contain information and tools to overcome perceived risks associated
with ICT use and how to derive value from participation in the digital economy. The tools will
include:
1. A risk assessment simulation for end-users that will be based on risk scenarios uncovered in
all project stages. Users will respond with their risk perception to scenarios and receive
direct, immediate feedback on the actual risk associated with the scenario and how their
perceptions reflect this.
2. A risk perception information digital booklet with guidelines for understanding and
managing perceived risk for end-users.
3. A strategy toolbox for organisations working with older adults’ engagement with ICT.
ACCAN GRANTS PROGRAM
151.5.4 Disseminate
In this stage we will disseminate research findings, co-designed strategies, and the digital resource to
end-users and stakeholders to guarantee the uptake and scaling of findings and strategies. This stage
aims to educate key end-users, organisations working with older adults’ digital inclusion, and the
academic community. Dissemination will happen through two seminars to stakeholders, two
workshops, one webinar, and engagement with academic and partner networks.
Dissemination Seminars: We will invite key members of older adult networks, such as ASCCA, COTA,
organisations for digital inclusion (e.g., Good Things Foundation), research organisations (e.g.,
MARC), local government authorities (e.g., the City of Whittlesea) and insurance organisations to
participate in these seminars. We will embed an evaluation survey at the end to ensure that we can
assess the project’s impact. We will invite up to 30 people to each dissemination seminar.
Implementation workshops with U3A computer mentors: The implementation workshops will be
held with mentors who run computer courses at local U3A chapters. We will go through the digital
booklet and the strategies to support the management of perceived risk. Up to 15 people will be
invited to each implementation workshop.
Final Report: Overall report on risk perception. This report will build on the current report by
containing the research’s complete findings and recommendations for organisations supporting
older adults’ engagement with ICT and their inclusion in the digital economy. In addition, the
information from the report will be compiled to help support the content presented in the digital
resource. This report will be hosted both at the Shaping Connections webpage and ACCAN’s
webpage.
ACCAN GRANTS PROGRAM
162 Methodology
2.1 Exploratory Interviews
The initial phase of exploratory remote interviews was conducted from November 2020 to January
2021 and involved 22 respondents from the U3A Victorian Network. Respondents were recruited via
email and phone and were first inducted and prepared in short pre-interviews, during which
demographic and ICT perception data were collected. Subsequent semi-structured interviews
focused on different types of perceived risks alongside topics of safety and care, and ranged from 30
to 90 minutes. Interviews were video recorded for data analysis purposes. The content was also
used to produce vignettes to be deployed for the co-design workshop stage.
Given physical distancing regulations imposed during the COVID-19 pandemic, we designed all
qualitative interviews to be done online or over the telephone (an alternative to include those
unable or unwilling to go online). These semi-structured interviews were designed to explore pre-
selected themes. Analysis of interview data provided respondents’ own language and meaning to
the items operationalised for quantitative analysis in the survey (Stage 1b). Using appropriate
language has been identified as a challenge in older adults’ uptake of ICTs (Maccora, Rees, Hosking,
& McCallum, 2019). It assures the accuracy of shared meanings by using respondents’ language in
the survey. In addition to language use, it is also vital to understand who (or what) influences
perceptions of risk. Although risks are related to the degree of inter-family and inter-generational
support for ICT use, negative stereotypes of older adults and technology are also commonplace.
Older adults with access to younger family members may receive support, but the same family
members may fuel insecurity through stereotyping and thus increase risk perceptions at the same
time.
ACCAN GRANTS PROGRAM
172.1.1 Data Analysis
Analysis of interview transcripts involved initial risk coding and later thematic categorising of
responses. Categories based on the perceived risks were used to develop various subcategories that
present barriers for older adults in making full use of ICT.
2.1.2 Sample Characteristics
The interviews of 22 Victorian U3A respondents were recorded and transcribed. Thirteen were
women, and eight were men—four respondents self-reported as culturally and linguistically diverse
(CALD) persons. The cohort was between 59 and 85 years old, with a mean age of 71.8 and a median
of 71.
2.2 Survey
2.2.1 Recruitment and Survey Distribution
Members of U3A were emailed a link to and information about the ICT Survey. Three bulletin emails
were sent to the 105 member U3As of U3A Network Victoria, as well as a bulk email system. In
addition, notifications were placed in U3A Network Victoria publications (Network News, Facebook,
Network Council papers). The survey was promoted through the Social Seniors programs, and we are
aware of 10 U3As that had members complete the survey in Digital Literacy classes. U3A members
were contacted via email, newsletter, and nominated courses to complete the online survey, with
participation voluntary. It is important to note that some respondents did not answer all the survey
questions. Incomplete responses were deleted if the demographics section was not attempted.
Over about 12 weeks, close to 600 surveys were registered. Removing duplicates and invalid
responses yielded 426 valid surveys. This report is an interim report, and data collection will
continue until the end of October 2021 to increase the number of surveys returned.
2.2.2 Data Analysis
The survey data is analysed and reported in several ways. First, frequencies and means are used to
illustrate the usage and perceptions of respondents. Second, where items form composite variables,
the items were subjected to factor analysis to determine dimensionality. Third, items associated
with each factor were then assessed for reliability and validity. Fourth, composite variables were
then computed and used for reporting. Finally, the factors and variables were subject to t-tests to
assess differences between demographics characteristics of respondents.
ACCAN GRANTS PROGRAM
183 Results
3.1 Exploratory Interviews
The interviews directly inquired into perceptions of ICT and resulted in detailed analysis based upon
risk subcomponents. This analysis resulted in several vignettes for each, as several quotes were
collected around a specific aspect of the risk type. Analysis of interview transcripts involved initial
risk coding and later thematic categorising of responses. Categories based on the perceived risks
were used to develop various subcategories that present barriers for older adults in making full use
of ICT. These categories were formed from the initial literature review that highlighted the
complexity of the concept of ‘risk’ and identified several subcomponents (Mitchell, 1999).
These are:
1. Psychological risk (i.e., fear of making a wrong choice)
2. Financial risk (i.e., fear of wasting money)
3. Functional/Performance risk (i.e., fear of the product/service not working correctly)
4. Social risk (i.e., fear of negative opinions from significant other individuals on the
product/service)
5. Physical risk (i.e., fear of the product/service being a threat to the individual’s health).
Based on the literature, the research team analysed these 22 exploratory interviews with U3A
members and sorted their responses into the five broad categories of perceived risks associated with
ICT. These have led to a range of risk perceptions subcategories developed into short, curated
vignettes edited from recorded interview materials. Across the five risk perceptions categories
chosen (Psychological, Financial, Functional/Performance, Social, and Physical), 22 distinct risk
subcategories were identified, including the perspectives of three to four respondents in each.
ACCAN GRANTS PROGRAM
193.1.1 Interviewee Profiles
Through this exploratory stage – the online and semi-structured interviews – we covered the
different types of perceived risks alongside topics of safety and care. In framing these discussions,
interviewees are introduced below alongside a notable comment from their interviews.
Sue B. Aged 65, Female
“The one that I worry about failing when I really need it has been my
phone running out of battery because I’ve had issues with my iPhones,
the last one and this one, and I do use Google Maps as my sat map. ...
My phone was running out of battery as well, so I was quite distressed
by that.”
Greg B. Aged 68, Male
“I used to joke with other people that there’s no one single way you get
into Zoom. You have to be flexible, and you can go in different
pathways.
Jasmine T. Aged 66, Female
“I... took my grandson to the beach, and without knowing that my
phone is in my jacket pocket, and it’s not waterproof jacket, and when
the wave come through, gosh, it’s all wet, and that was just three days
old.”
Peter G. Aged 69, Male
“I get the impression that people who do so badly (with social media)
they’re retreating, and their whole life becomes their social media
platform, which is dangerous”.
Maggie L. Aged 70, Female
“We wonder about the phone thing in beside the bed and if it’s far
enough away from our heads and all that sort of stuff. And I don’t know
about that, but we understand it’s okay.”
ACCAN GRANTS PROGRAM
20Tony A. Aged 74, Male
“I only really interact with my bank on the internet. I think I’ve been to
an ATM once in six months. I’m not using cash anymore.”
Patsy M. Aged 74, Female
“I find that the people who program computers have a completely
different thought process to me. It’s worse than even speaking a
foreign language. I mean, it’s like I’m talking English, and they’re
talking algebraic equations.”
Graeme G. Aged 76, Male
“It’s a bit like the smart TV; when you want to watch something, you
have to work out how the damn thing works.”
Lee A. Aged 77, Female
“I think it is quite difficult to explain to people that are not really
familiar or haven’t had enough experience. And if you try to give too
much information too quickly, I think that’s confusing. So, I think you
probably have to go step by step.”
Paulina C. Aged 59, Female
“But she refused to join my Zoom classes because even to press that
link was difficult… until her daughter was there with her when we had a
Zoom celebration with all my family. Then she was comfortable with
someone there pressing it with her. But when that someone is not with
her, she goes into panic mode again.”
Lindsay G. Aged 78, Male
“We have a couple of members who will call and say, ‘My computer’s
gone down.’ And you usually have to go and just reboot it for them.
There’s a couple of those, but that’s only a handful.”
ACCAN GRANTS PROGRAM
21Eda R. Aged 77, Female
“But I also think that there’s a lot more misinformation on some of the
things I watch... So, I do worry about misinformation on that, and how
if you say something often enough, people tend to believe it.”
Carl T. Male
”If you’re trying to use the phone, people don’t explore all the functions
of the phone with you. They assume all you do is just talk with it.
Nothing else.”
Sally C. Aged 85, Female
“If I can’t fix something, I’ve always relied on somebody else, yes. I have
no hesitation in getting help, or inviting somebody, either friend or
family, to assist if I can’t find my way through it.”
Noel W. Aged 70, Male
“Older people have an expectation that if you buy it, it works. And if it
breaks, you get another one or you repair it. There's none of this, it's
got a bit old, so I need a new one”
Helen B. Aged 70, Female
“The daughter who keeps an eye on my bank account, she told me
recently I had to stop buying things online. I’m not buying a lot; I just
buy ...”
Marilyn B. Aged 78, Female
“I don’t know what it is actually. I suppose it’s because I’m not at all
confident, I don’t have a lot of self-confidence using technology, and I
feel quite inferior because of it, which is mad, but I do.”
ACCAN GRANTS PROGRAM
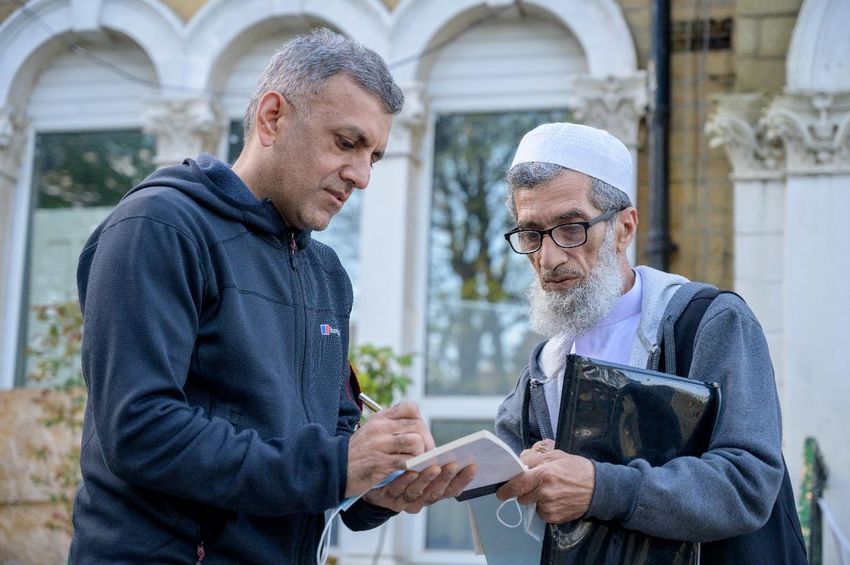
22Dawood S. Aged 64, Male
“I have my own account online, go online, do it, and I feel safe. There is
nothing to worry about. Some people say that ‘I don’t do it’, ‘I leave it
to my son because I’m afraid I do a mistake, and my money will go to
another account’ …”
Judy M. Aged 79, Female
“…as an older person, you can go one of two ways: you can take up
technology and go with it and learn with it, or else you can hide from it.
People like that don’t realise what they’re missing out in life.”
Framing the Survey data
Throughout the discussion of the risk (see 3.2.6 Risk) and fraud (section 3.2.7 Exposure to Fraud &
Scams) in the survey results, perspectives and opinions from the exploratory interviews are used to
support and enhance the insights gained. While the vignettes reflect the research team’s qualitative
analysis of the interviews, the quotes integrated within the following survey discussion were instead
compiled in response to the survey data itself. Considering the inherent limitations of interviews and
survey methods, this approach intends to offer readers a unique and invaluable framing of the
results.
ACCAN GRANTS PROGRAM
233.2 Survey
3.2.1 Demographics
Four hundred and twenty-six people completed the online survey. Over two-thirds of the survey
respondents were women (69%) and just under a third were men (30.8%). The larger proportion of
women reflects the proportion of women in the U3A membership. In general, the older Australian
population (65+) contains more women (60%) than men (40%) (ABS, 2020). Survey respondents
were predominantly over 60 years of age (only 2.1% were 59 years or younger). 31.9% were in their
60’s, over half in their 70’s and 12.2% were aged 80 years or more (Table 1). For the purposes of
analysis in this report, we have divided the survey cohort into two age groups: those 69 years or
younger (34.0%) and people who are 70 years or older (65.7%).
Table 1. Online survey respondent demographics
Characteristic Per cent
Gender
Female 69.0
Male 30.8
Other 0.2
Age group
Less than 50 years 1.2
50 – 54 0.0
55 – 59 0.9
60 – 64 8.0
65 – 69 23.9
70 – 75 35.4
75 – 79 18.1
80 – 85 10.3
85+ 1.9
Prefer not to say 0.2
Current relationship status
Never partnered and living alone 3.3
ACCAN GRANTS PROGRAM
24Characteristic Per cent
Widowed and living alone 17.1
Divorced and living alone 12.2
Married 46.5
Separated and living alone 2.8
De facto / partnered 11.7
Other 3.1
Prefer not to say 3.3
Current living arrangement
Live in own home 87.1
Live in rental accommodation 5.4
Live in a supported residential facility 0.7
Live in a retirement home/village 3.8
Other 1.2
Prefer not to say 1.9
Note. N = 426. Data from Older Adults and ICT Online Survey.
Most respondents were currently in relationships, either married (46.5%) or de facto or partnered
(11.7%). Many respondents were living alone (35.4%) either because of separation, divorce, or
widowhood. The majority live in their own homes (87.1%), with smaller proportions living in rental
accommodation (5.4%) or retirement villages (3.8%) (Table 1). This data is largely in line with
expected enrolments at U3A classes.
Respondents to the ICT Survey are highly educated: 59.3% have a bachelor's degree or above. A
small proportion did not complete secondary school (10.8%), 6.6% completed Year 12, and a further
21.4% completed a post-secondary certificate or diploma (Table 2). Over half of the respondents are
self-funded retirees (52.1%), 20.2% receive the full government pension, and 12.9% receive a part-
government pension. A very small proportion are still working (3.3%). The median income category
for the survey respondents is an income between $41,600 - $51,999 per year (Table 2).
ACCAN GRANTS PROGRAM
25Table 2. Income and education
Characteristic Per cent
Highest level of education
Year 11 or below 10.8
Year 12 6.6
Certificate I/II 1.2
Certificate III/IV 5.4
Advanced Diploma and Diploma 14.8
Bachelor’s Degree 21.8
Graduate Diploma and Graduate Certificate 19.0
Postgraduate Degree 18.5
Prefer not to say 1.9
Individual Income
$7,800 - $15,599 per year 4.7
$15,600 - $20,799 per year 8.2
$20,800 - $25,999 per year 11.0
$26,000 - $33,799 per year 10.3
$33,800 - $41,599 per year 8.9
$41,600 - $51,999 per year 8.0
$52,000 - $64,999 per year 6.8
$65,000 - $77,999 per year 4.7
$78,000 - $90,999 per year 2.6
$91,000 - $103,999 per year 1.4
$104,000 - $155,999 per year 1.9
$156,000 or more per year 0.9
Prefer not to say 30.5
ACCAN GRANTS PROGRAM
26Characteristic Per cent
Source of income
Salary or wages 3.3
Full government pension 20.2
Partial government pension 12.9
Self-funded retirement income or pension 52.1
Other 4.9
Prefer not to say 5.6
Note. N = 426. Data from Older Adults and ICT Online Survey. Demographic Items based on ABS.
3.2.2 ICT Device Ownership and Use
The types of devices owned are presented in Table 3. Almost all survey respondents had personal
access to the internet (92%) or owned a smartphone (90%). A laptop (71%) or an iPad or tablet (69%)
were the following most owned pieces of technology. Just over half owned an internet-enabled TV
or a desktop computer. Wearable devices and the iPod Touch (digital music player) were not
commonly owned items (24% and 13%, respectively).
Table 3. Types of ICT owned
Types of ICT owned Ownership %
Internet 92.0
Smartphone 90.4
Laptop 70.7
iPad/Tablet 69.0
Internet-enabled TV 57.5
Desktop computer 57.0
Wearable devices (e.g., Apple Watch, Fit-Bit) 24.2
iPod Touch or similar device 12.7
Other 6.6
Note. N = 426. Data from Older Adults and ICT Online Survey.
ACCAN GRANTS PROGRAM
27Respondents were also asked to rate how frequently they used each type of ICT device on a seven-
point scale: 1 ‘never’, 2 ‘once every few months’, 3 ‘about once per month’, 4 ‘several times per
month’, 5 ‘about once per week’, 6 ‘several times per week’, or 7 ‘daily’. Hence the higher the
frequency of use score, the more frequent the device use. This included devices shared with others
but not necessarily owned by the individual.
As shown in Figure 1, smartphones were on average used almost daily (a score of 7), and
iPads/tablets or laptops were used on average about once per week. Desktop computers, laptops
and internet-enabled televisions were used about once per week. Wearable devices were used
much less frequently (on average once per month) and iPod Touch or similar music devices – once
every few months.
Figure 1. Device use frequency scores (mean)
Smartphone 6.6
iPad/Tablet 5.3
Internet-enabled TV 4.9
Laptop 4.9
Desktop computer 4.8
Wearable devices 3.1
iPod Touch or similar device 1.9
Other 1.8
1 2 3 4 5 6 7
Never Once Once Several About Several Daily
every few per times a once a times a
months month month week day
Device use frequency score
Figure note. N = 426. Maximum score is 7.
To further explore these ownership and usage scores, we assessed them against several respondent
characteristics – age, gender, relationship status, and digital literacy (DL). There were no statistically
significant differences in device use frequency by gender or relationship status. In terms of age
group, desktop computers were more frequently used by older adults compared to younger adults.
The detailed frequency scores are presented in Appendix 1.
ACCAN GRANTS PROGRAM
28You can also read