Reducing trash is solution to CT's waste crisis - Jennifer Weymouth Sustainable Materials Management Planning and Implementation Bureau of ...
←
→
Page content transcription
If your browser does not render page correctly, please read the page content below
Reducing trash is solution
to CT’s waste crisis

Jennifer Weymouth
Sustainable Materials Management Planning and Implementation
Bureau of Materials Management and Compliance Assurance

Trash crisis: disposal capacity is unreliable
CT’s trash is burned at waste-to-energy
facilities
CT WTE facility capacity is becoming less
reliable
Unscheduled shut downs more frequent
Wallingford facility shut down a few years ago
Increased
Shipping wastetipping
out ofcosts means
state is costly and not
higher costs for towns and
sustainable
ultimately residents
2
Trash crisis: reduced capacity leads to increased
                    disposal costs

Not including collection costs                        3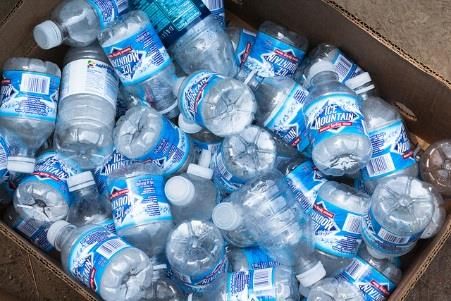
Trash crisis: reduced capacity leads to increased
municipal costs
Collection costs – RISING
(trash & recycling)
Trash disposal tip fees – RISING
Recycling – moved from no cost to RISING
Recycling fees for contamination – RISING
4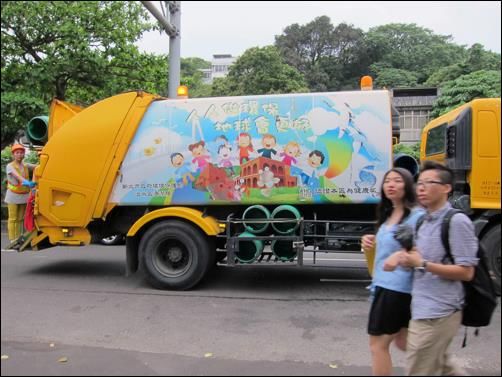
DEEP response to trash crisis is waste reduction

   Reduce waste to alleviate statewide
   capacity at waste to energy facilities

      Reduce waste to lessen burden on
      municipal budgets

          Reduce waste to create a sustainable
          system for municipalities and residents
                                                    5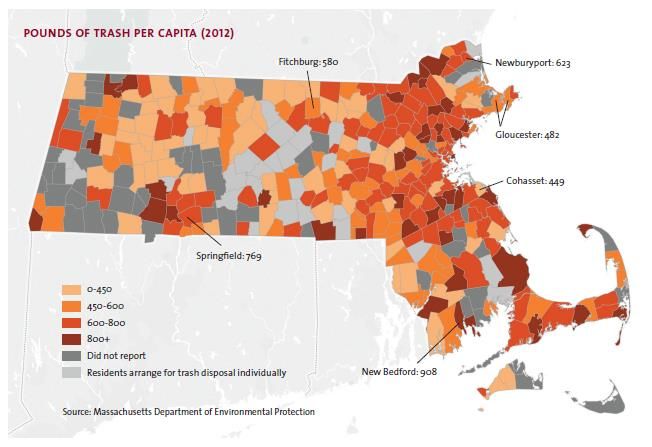
Driver for current DEEP initiatives
60% statewide diversion goal by 2024
Waste reduction is key action item in State Plan
CT must improve the performance of municipal
recycling systems, reduce waste, and increase
compliance with recycling statutes
Municipalities must implement waste reduction
initiative designed to reduce total waste by 10%
SMART is most effective strategy
6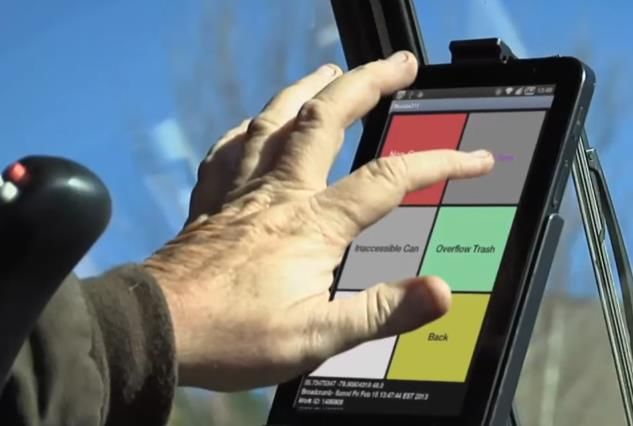
*SMART – Save Money and Reduce Trash
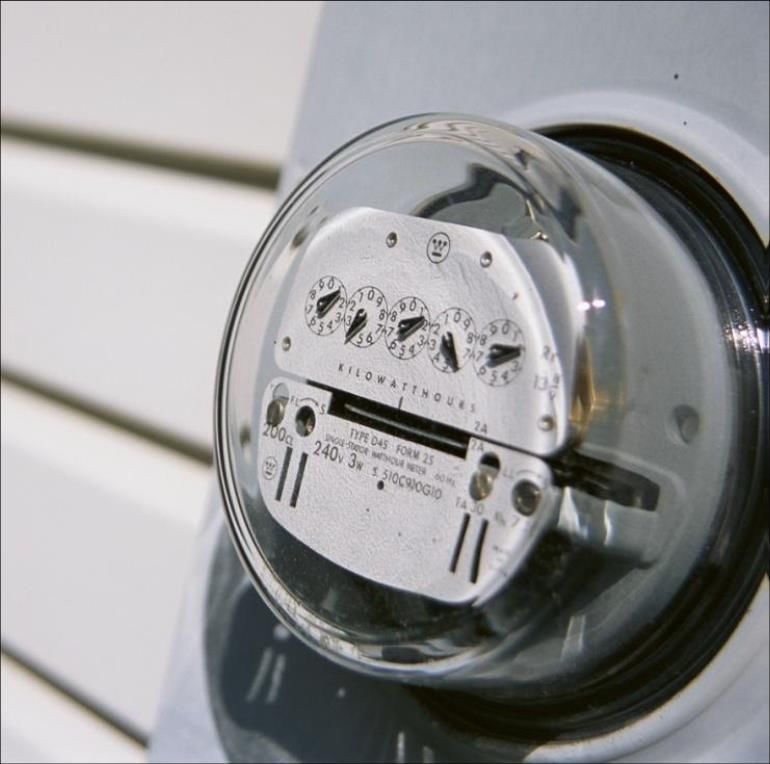
SMART programs meter trash like a utility
Provides a financial signal to users
to incentivize waste reduction
Results in cost savings for the
municipality
Results in a sustainable revenue
stream
Residents choose to recycle right,
divert textiles for reuse, and change
purchasing habits to save money
7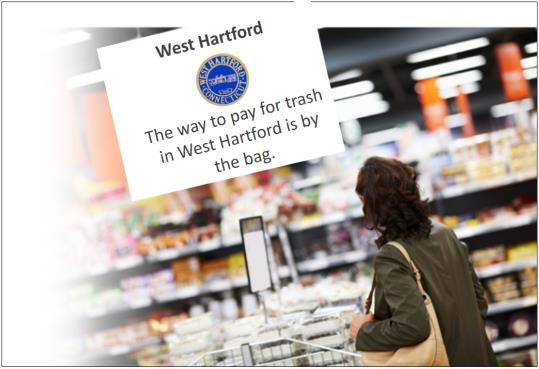
SMART is the solution to the trash crisis
SMART is single most effective action for municipal waste
reduction and savings
Education will compliment other initiatives and increase
participation, but not reduce waste
Weekly recycling is not proven to reduce waste
Organics collection programs compliment SMART
Residents in SMART communities generate half the waste
compared to residents in non-SMART communities (ILSR, 2018)
Less waste means avoided tipping costs (SAVINGS!) for
municipalities. 500 communities in New England have saved
money on disposal (WasteZero)
SMART is equitable
8
SMART is key priority in Northeast states
Massachusetts Rhode Island Maine
41% of MA’s cities and 6 of RI’s 39 31% of ME’s 1.33 million
towns use SMART municipalities have people live in SMART towns
SMART
Average waste Average waste reduction in
reduction in bag-based Rhode Island Resource bag-based communities has
communities has been Recovery Corporation, been 44%
44% which handles all of RI’s 33 additional towns
solid waste, is currently currently considering
designing a uniform SMART
statewide program
In addition, SMART/unit-based pricing for solid waste is mandatory in MN, OR, VT, and WA
9
SMART is solution to trash crisis
Municipalities are feeling the impact of the
trash crisis
Solution to trash crisis is SMART
DEEP and Waste Zero developing SMART plans
for 30+ municipalities
10December 2018 Projected Impact of SMART on South Windsor, CT Kristen Brown, VP of Municipal Partnerships, Waste Zero Prepared by WasteZero, Inc. for the CT Department of Energy and Environmental Protection (DEEP)
Today’s Discussion

  1   Current Situation

  2   What is SMART?

  3   How SMART Could Work in South Windsor

  4   Compliance with SMART

  5   Next Steps

                                              12   12
Current Situation
13 13South Windsor
High-Level SMART Benefits Analyses
Key Starting Data
Population 26,023 People, 10,008 in served households
Annual Trash Tonnage 7983
Annual Recycling Tonnage 2242
• Bi-weekly single stream recycling –automated collection
• Recyclables are brought to Murphy Road Recycling (2nd year of 3 year contract)
• Curbside refuse collection takes place once each week on the same day.
• Both trash and recycling are collected by All American Waste from 8,041 residential stops and
1608 condo units (serviced by dumpsters)
• Bulky waste is collected once each month on the first full week.
• South Windsor periodically offers:
• Household Hazardous Waste Collection Events
• Electronics Recycling Drop-Off Events
• Curbside Leaf Collection takes place in the fall.
• South Windsor’s curbside recycling rate is 22%
• The per capita disposal is 619lbs of trash per person per year.
• The trash tip fee is $71 per ton and will increase to $73 per ton in 2019/2020
• There is currently a rebate of $5 per ton for recyclables
14What Is SMART?
With SMART, people think twice about what they
throw away – and choose to reduce, reuse, donate,
recycle, or compost instead.
15 15Benchmarking Waste: Annual Residential Per Capita Disposal
For maximum accuracy, Annual Per Capita Waste Disposal is the best way benchmark the amount
of waste disposed after recyclables and other materials are diverted from the waste stream.
• EPA SMART BET
uses per capita
disposal.
• Zero Waste
Europe uses per
capita disposal.
• 432 lbs. per capita
is the MA average
for PAYT
communities.
Source: Seriously, Is This the Best We Can Do?, Commonwealth Magazine, Winter 2015
Using recycling rates as a benchmark can create a false sense of accomplishment.
16 16Forms of SMART
SMART programs can take many different forms.
Variable-
Residents choose from among different sizes 500-600 +
Rate Carts
of carts, paying more for larger carts pounds per capita
(VRCs)
Residents pay by the bag by affixing a pre- 500-600
Stickers/Tags
paid tag or sticker to each bag of trash. pounds per capita
Residents dispose of waste in official
Bags or Bags in Avg. 280-432
Carts
municipal bags. Bags can be used with
pounds per capita
manual or cart-based collection systems.
1 Cut taxes, increase services, close deficits
SMART 2 Pay per unit for trash
3 No extra fee for recycling
17Portland Maine ranked #1, disposing of less waste per person
and moving closer to Zero Waste than peer communities.
700
Institute for Local Self Reliance (ILSR) 2017 Research PAYT with Bags
(Average 344lbs
600 per capita)
500 PAYT with variable carts
Pounds per capita plus curbside food
Waste Disposal collection (Average
400 510lbs per capita)
PAYT with Variable
300 Carts no Curbside Food
Collection (Average
560 per capita)
200
100 64 gallon Overflow Cart
(Average 646lbs per
capita)
0
Average CT municipalities without
SMART – about 720 per capitaResults: MSW Reduction of 44% on Average
WATERVILLE, MAINE DARTMOUTH, MA
53% DECLINE IN WASTE 59% DECLINE IN WASTE
NATICK, MA SANFORD, ME
35% DECLINE IN WASTE 40%+ DECLINE IN WASTE…TWICE
19 19SMART – Decreases Overall Generation – 20+%
SMART’s price signal produces source reduction and moves materials into all other programs,
increases donations and home composting.
Duxbury MA before
Duxbury MA after
Marshfield MA before
Marshfield MA after
Malden MA before
Malden MA after
Natick MA before
Natick MA after
Raymond NH before
Raymond NH after
0 5000 10000 15000
Waste Commodity Recycling
20 201000
1200
0
200
400
600
800
Bridgeport
Waterbury
Hartford
North Haven
Waterford
New Britain
Old Saybrook
Westport
Groton City
Disposal /Capita
Plainville
Bristol
740
Middletwon
Farmington
CT Average
Burlington
Meriden
Ledyard
Berlin
Torrington
Griswald
Ellington
Annual Pounds of MSW Disposed per Capita
Branford
619
South
New London
Windsor
East Haddam
Note: Figures are calculated using MSW tonnage data provided by the municipalities themselves
West Hartford
Manchester
Norwich
Fairfield
Milford
CT
513
Shelton
Harwinton
Mansfield
EastLyme
Enfield
North Stonngton
New Haven
Montville
South Windsor
432
Town of Groton
Stamford
MA SMART
SMART Communities dispose of less residential MSW per capita than many other Connecticut cities.
Communities
Mansfield
SMART MA
Stonington
CT
389
Worcester
Stonington
21
MA
324
WorcesterAccording to EPA, 75% of what we throw away is not trash
• 2.5 million plastic bottles every hour
• Enough office paper to build a 12-foot
wall from Los Angeles to NYC each year
• 82 pounds per person each year of used
clothing (textiles)
• Enough single use plastic film and bags to
shrink wrap the state of Texas each year
Even though most of us claim to recycle all that we can, Americans are
still throwing away more than what is sustainable.
22Similar Efforts in Other States
SMART has a strong presence in the Northeast. The experience of municipalities in this region can
be productively applied in Connecticut.
Massachusetts Rhode Island Maine
• 41% of municipalities use • 6 of RI’s 39 municipalities have • 31% of ME’s 1.33 million people
SMART. some form of SMART. live in SMART towns.
• Average waste reduction of 44% • Rhode Island Resource Recovery • Average waste reduction of 44%
with bag-based SMART. Corporation (RIRRC) is designing with bag-based SMART
a statewide SMART option.
In addition, unit-based pricing for solid waste is mandatory in Minnesota, Oregon, Vermont, &
Washington.
23Global SMART Efforts (Selected Examples)
Europe South Korea & Japan Taiwan
• ZeroWaste Europe’s 1st Category • Seoul reduced waste 42%. • Taipei uses bag-based SMART.
Municipalities must use SMART.
• Kyoto reduced waste more − Reduced waste by 33%
• Low per capita disposal (300-500 than 40%.
lbs./yr) with SMART in − Recycling rate is >50%
− Austria
− Belgium • Best Environmental
− Estonia Management Practices in the
SMART – Zurich Reduced Waste 41% Waste Management Sector.
− France
− Italy − Report to the European
Commission’s Joint
− Switzerland
Research Center
− Others
− May 2016 24How Would SMART Work in South Windsor
25 25How SMART Works: It’s Simple!
1 2 3 4
Purchase official SMART trash Put trash in official Place trash in container, Place recycling in
bags at the same stores where SMART trash bags. same as today. container, same as
you shop today. today.
1. Trash collection works the same as today (from the municipality or hauler).
2. Recycling collection remains free and works the same as today (from the municipality or hauler).
3. SMART trash bags would be available at convenient locations (all grocery, hardware, drugs stores)
4. The SMART bag draws attention to waste while providing residents an economic incentive to
recycle more and throw away less.
1. 8 gallon (.80 cents each)
5. Bags would be available in three different sizes. 2. 13 gallon ( $1.25 each)
3. 33 gallon ($2.00 each)
26 26Number of SMART Bags the Average Home will Use per Week
With SMART, the average home will use less than one 33-gallon bag per week.
The average home will use… …less than one bag per week
Based on data collected from hundreds of SMART programs:
• Residential trash will drop by 44% (from 7,982 tons/yr. to 4,470 tons/yr.)
• 4,479 tons per year equals
− 8.93 lbs. per home per year
− 17.18 lbs. per home each week
• A 33-gallon bag collected through a SMART program contains 21.25 lbs. of trash
• That’s less than one bag per week per hh
27South Windsor
Projected Waste Stream Shift with SMART
In South Windsor, SMART would reduce annual trash tonnage by 44%, or about 3,513 tons. This equates to
annual tip fee savings of $249,389 at $71 per ton.
Waste Stream Shift w/SMART (Annual Tons)
12,000
10,000
2,242
8,000
22%
45%
3,647
6,000
4,000 7,983 78% 55%
2,000 4,470
0
No SMART SMART
Trash Recycling
With SMART, annual pounds of trash per capita (PPC) would drop from 614 to 344.
28Now is the Best Time for SMART
Recycling markets have been weak for the past few years due to a combination of single stream contamination
and China’s policy. The recycling infrastructure in the US is adjusting and markets are predicted to rebound.
Recycling is a commodity and there will always be highs and lows; however, SMART is the best way to manage
waste regardless of the recycling costs because it promotes source reduction and reuse. The recycling tip fee
could go as high as $170 per ton, and a SMART system will still cost less money.
No SMART SMART No SMART SMART No SMART SMART No SMART SMART
Waste Tonnage 7,983 4,470 7,983 4,470 7,983 4,470 7,983 4,470
Recycling Tonnage 2,242 3,647 2,242 3,647 2,242 3,647 2,242 3,647
Waste Tip $71 $71 $71 $71 $71 $71 $71 $71
Recycling Tip $0.00 $0.00 $45.00 $45.00 $80.00 $80.00 $170 $170
Trash Disposal $ $566,793 $317,404 $566,793 $317,404 $566,793 $317,404 $566,793 $317,404
Recycling $ $0 $0 $100,888 $164,114 $179,357 $291,757 $381,133 $619,985
Total Cost $566,793 $317,404 $667,681 $481,518 $746,150 $609,162 $947,926 $937,389
Savings - Comparison $249,389 $186,164 $136,988 $10,538
The waste tip fee is expected to rise significantly over the next decade. The current waste tip is $71 per ton, but
increasing to $73 this year. The tip could easily exceed 100 per ton over the next decade.
29 29How SMART Works: How the Bags Pay for Trash
33 – gal.
13- gal
$2.00 per Bag $1.25 per Bag
Bag & Bag Distribution $0.31 Bag & Bag Distribution $0.21
Trash Incineration+ some Trash Incineration + some
$1.69 $1.04
operational costs operational costs
Total $2.00 Total $1.25
30Estimated Annual Financial Impact of SMART*
Bag purchase price:
Mini: $0.80
Small: $1.25
Large: $2.00
1 Year 3 Years 5 Years 10 Years
Revenue $713,083 $2,139,248 $3,565,413 $7,130,827
Bag Sales1
Savings $249,389 $748,167 $1,246,945 $2,493,889
Tipping Fees
Net Program Impact $962,472 $2,887,415 $4,812,358 $9,624,716
Notes:
1. Benefits and Savings for Years 3,5, and 10 are cumulative
2. Revenues are net of program services and supplies
3. Assumes no tip escalation
South Windsor would realize nearly $10 Million in benefits and savings over the next ten years.
31 31Switching to SMART Saves the Department 13%
SMART is a more efficient and fiscally responsible way to fund solid waste services. Residents pay
for trash services differently: Partly through taxes and partly through a bag fee.
Options for Meeting Financial Target
$2,000,000
$249,389 Tip Savings Fairer for
residents
$713,083
Bag Revenue More fiscally
responsible
$2,046,843 OR
$1,000,000
General Fund Less
dependence on
property tax –
$1,084,371 Saving
General Fund
$962,000
$0
Status Quo With SMART
Source: South Windsor 2018 Budget
Total Expense $2,046,843 $1,797,454 32Financial Savings for Households
Residents using the average number of SMART bags—or even slightly more than that—would still
pay less for solid waste services with SMART than with the current system.
Baseline Tax
Baseline Tax $108
$205
+
Regular Trash Bags +
$27 OR Small Bags Only Average Large Bags Only
=
232 $65 $84 $104
$173 $192 $212
Annual Cost per Household
SMART gives residents control over their costs, and makes it easy to save money on trash services.
Bag purchase price: Small: $1.25 Large: $.2.00 33SMART provides a return on investment (ROI) of 67%
A SMART program asks residents for less. The annual benefit to the town is $962,472 (tip savings
and bag revenue), but the total cost to residents is only $577,477
Average HH SMART bag annual expense $84,70
Average HH regular trash bag annual minus
$27.00
expense (-)
Average additional out of pocket (since equals
$57.70
regular trash bags are no longer needed) (=)
Total out of pocket cost from all 8,567 times
$577,577
homes (x)
Return on investment for residents 67%
The average household will spend an additional $57.70, and
Receive $96.16 in positive community impact
34 34Number of SMART Bags the Average Home will Use per Week
With SMART, the average home will use less than one 33-gallon bag per week.
The average home will use… …less than one bag per week
Based on data collected from hundreds of SMART programs:
• Residential trash will drop by 44% (from 7,982 tons/yr. to 4,470 tons/yr.)
• 44,479 tons per year equals
− 8.93 lbs. per home per year
− 17.18 lbs. per home each week
• A 33-gallon bag collected through a SMART program contains 21.25 lbs. of trash
• That’s less than one bag per week per hh
35South Windsor
Annual Environmental Impact of SMART
CO2e (Greenhouse Gas) BTUs (Energy Used)
Annual 6,600 Annual 55,000
Reduction Metric Tons Reduction Million Units
• Reduced carbon footprint • Reduced costs
• Less pollution • Reduced carbon footprint
• Healthier environment for residents • Increased energy security
Equivalent to: Equivalent to:
Removing Powering
1299 490
passenger vehicles from the road residential homes
or or
Reducing gasoline consumption by Installing
742,000 6,800
gallons rooftop solar panel arrays
Source: EPA WARM Model
36Next Steps
1. Answer questions
2. Work with DPW to tweak design
3. Work with DEEP to reach the following Sustainable CT milestones:
o Build a SMART Task Force to work through evaluation steps for SMART
o Use Task Force visit SMART communities in New England, educate all council members
and get feedback from councilors, evaluate objections and gain support from
environmental groups, local AARP, district groups, or other advocacy groups, brief media
o Hold public public meetings to gain resident general feedback
o Tweak final design plan and make recommendation to council.
4. Develop key message and FAQ documents for public and media
5. Write ordinance or adapt current ordinance
37Enforcement
All residential loads arriving at the transfer station must contain only SMART bags. Loads are easy to assess. The
town will provide a tiered fee structure for haulers / tolerance for non-compliant loads.
There are two ways that the town transfer station will receive residential trash:
1. Trucks with curbside waste from haulers with residential material: Loads must contain 95%+ official bags or
vehicle will be fined a pre-determined amount (or be required to pay the normal tip fee). The program can
ultimately be enforced through specific language in permitting of private haulers or multi-family or through
contract with town hauler. Haulers can monitor compliance in two ways:
- Standard loads from residential trucks with manual collection or semi-automated collection: Drivers are required to check
for compliance and the curb and follow enforcement protocol. There are a few options depending on the available
technology.
- Loads from trucks with automated collection: A camera and camera and GPS system can be used. (this is a common
practice in the Northeast. Most automated trucks are already equipped with a camera).
2. Drop-Off – Traditional bag at the “Drop Off” center protocol or alternative.
Bulky Waste should be discussed. Pre-paid stickers for bulky waste that is disposed of in the same
truck as household waste could be used or cars could be required to weigh in at scale.
38How Does Enforcement Work with Automated Collection? See video
Official bags are placed in Trucks have video Camera shows driver
the carts cameras on the hopper what goes into hopper
Driver pushes button on app if Non-compliant addresses Loads easily spot checked
non-compliant bags are spotted auto-upload to database during start up phase
39 39Common Concerns Raised on Social Media
40 40Frequent Objections
There must be a better way. We should study this more
thoroughly and try other solutions first.
The State of Connecticut, as well as other states and cities around
the country have worked for decades to find programs that increase
recycling and reduce waste.
SMART is the single most effective way to reduce trash while also
saving money.
41 41West Hartford Switch from Bi-weekly to Weekly Recycling
12000
10000 26%
26%
8000
6000
74% Compared to SMART
74%
4000
2000
0 Year to date comparison
2016 2017 SMART
MSW RecyclingSMART: Big Impact
Westport banned plastic bags about 10 years ago. Banning plastic bags is also a difficult political
action. Although the ban was important for multiple reasons, it’s effect on waste volume is
minimal.
10-Year Estimated Plastic Bag Ban Results:
390 tons
$27,300 in disposal savings
10 Year Estimated SMART Results:
80,000 tons
$7 million in disposal savings
43 43Frequent Objections
This is unfair to the good recyclers because they will pay
more.
This is not the case. Currently the good recyclers are subsidizing
everyone else and as the cost of waste increases the subsidy
increases.
44 44Consumer Profile - Sustainability
Curbside Value Partnership
• When trash is hidden in
the taxes, the ‘Always
Recyclers’ are covering up
the behavior of those
that are not
participating.
• The as tip costs rise the
Sometimes ‘Always Recyclers’ will be
paying disproportionally
more per ton for trash
than the sometimes
recyclers.
Always Never
2.5% are always recyclers, another 13.5% are frequent recyclers but 68% are only
recycling sometimes.
45Frequent Objections
This information does not tell the entire picture. What about
all the programs that failed?
There are hundreds of SMART bag programs around the world.
Only a handful of programs that have been discontinued. Two
are located in Connecticut. The programs were discontinued for
political reasons, not because of poor results.
46 46Case Study: East Lyme, CT
The East Lyme Selectman Decided to Discontinue the Program in 1998 for political reasons
• When East Lyme’s Selectman discontinued the program, trash went up from
4,571 tons (1997) to 7,179 tons (1998).
• East Lyme’s current per capita trash is 650.
• Stonington implemented the program at the same time as East Lyme, has a
similar demographic make up, and nearly the same population. Stonington’s
current per capita trash is 389.
• Stonington had a referendum and the strong majority of residents chose to
keep the program.
• Stonington has saved approximately 6.5 Million dollars since the program’s
inception.
47Case Study: Columbia CT
Columbia voted at a Town Hall Meeting to Eliminate the Program
Program Results: MSW Hauling Costs & Tipping
Fees (Sept. thru Dec)
Municipal Solid Waste Decreased by 54%
30,000.00
MSW Hauling Costs and tipping fees reduced by 29,439.62
49%
25,000.00
Recycling hauling costs and tipping fees reduced
by $7,481.72 in just four months
Costs & Fees in Dollars ($)
20,000.00
Bag Revenue exceeded previous expectations:
o $25,000 was budgeted for the entire 6
15,000.00
month trial and, only 4 months into the
trial, net bag revenues exceeded this
12,947.05
number at $28,000 10,000.00
Recycling rate increased from 27% to 41%
Despite the SWRAC recommendations, and 5,000.00
overall program results, the town of Columbia
voted to eliminate the program at a local town
0.00
meeting in February 2011 2009 2010
48Frequent Objections
My neighbors will not comply and therefore it will cost me more and
not them.
Compliance from neighboring state programs, as well as
Stonington, is approximately 99%.
Studies also show that there is no notable increase in illegal
dumping.
49 49How Can the Town Enforce the SMART Program?
SMART compliance is very high and enforcement is usually not a challenge.
Most compliance issues happen during the first 6 weeks of a new program.
Most communities manage these with existing staff.
• Additional support can be provided if compliance is a concern.
A tiered enforcement system is recommended where one is not in place.
In all instances, the cost of enforcement has been a fraction of the financial
savings related to SMART.
Sanford, ME – City-Reported Compliance Rates
Week 1 96.3% Week 6 99.65%
Week 2 98.52% Week 7 99.79%
Week 3 99.52% Week 8 99.76%
Week 4 99.38% Week 9 99.94%
Week 5 99.43% Week 10 99.86% 50 50Automated Collection
Typical Ongoing Compliance Process See video
Official bags are placed in Trucks are equipped with video Camera clearly shows what goes
automated carts for collection cameras mounted to the hopper into hopper – driver can easily see
(standard on most automated trucks) bags on camera inside truck
Driver pushes one button on Tablet / Non-compliant addresses are auto- Loads can easily be spot checked
app (or similar solution) if non-compliant uploaded to central database so during start up phase.
bags are spotted notices (or citations) can go out.
51Frequent Objections
Residents will not like it.
Actually, residents like the program once
they have given it a try.
52 52Strong Support for Pay-as-You-Throw
In a Public Policy Polling survey of ~1,000 PAYT participants from 10 communities, significant
majorities said they are satisfied with PAYT, see it as fair and easy, and believe it is effective.
• Favorability
79% have either a very or somewhat favorable
opinion of PAYT, with an outright majority (52%)
having a very favorable opinion.
• Fairness
More than two-thirds—68%—see the program as
fair.
• Ease of Participation
74% think it is not difficult to take part in PAYT.
• Effectiveness
89% said PAYT is performing better than or as well
as they expected.
• Minimal Political Impact
77% said they are either more likely to vote for
leaders who brought in PAYT or that it does not
make a difference in their vote.c
53‘Kicking the Cans’ July 29, 2008
Should people who throw out more trash
pay higher disposal bills?
84% - YES 16% - NOYou can also read