USE OF EUROPEAN SATELLITE PRODUCTS FOR DATA COLLECTION (FOREST FIRE MAPPING) - Forcip+
←
→
Page content transcription
If your browser does not render page correctly, please read the page content below
USE OF EUROPEAN SATELLITE PRODUCTS FOR DATA
 COLLECTION (FOREST FIRE MAPPING)

Rémi SAVAZZI / Jean-Luc Kicin - ONF Agence DFCI Méditerranée
 Sadri HAOUET / Mathilde Caspard – laboratoire ICube SERTIT

 FORCIP+ Final Conference
 7 - 8 June 2017, Valladolid, Spain
Plan of presentation
• Introduction
• Use of SENTINEL and PLEIADES for contour and severity
 mapping
• Use of PLEIADES images for precise cartography
• Use of SENTINEL for risk mapping
• Conclusion

 2
Plan of presentation
• Introduction
• Use of SENTINEL and PLEIADES for contour and severity
 mapping
• Use of PLEIADES images for precise cartography
• Use of SENTINEL for risk mapping
• Conclusion

 3
SERTIT

 • Sertit is an ICube Laboratory Platform, University of Strasbourg
 • Operational 24/7/365 rapid mapping service
 – SERTIT’s Rapid Mapping Service

• Activities on a national/international scale
 • International Charter Space and Major Disasters
 • Copernicus Emergency Management Service – Mapping (EMS)

 • Rapid (6-12hrs) provision, processing and analysis of remote sensing data in case of :
 – natural and environmental disasters
 – humanitarian relief activities
 – civil security issues

• Support to decision makers :
 – Civil security services
 – Humanitarian Institutions, NGOs
 – Prevention and forecasting services
• Anticipation, prevention, crisis, feedback, mitigation

 4
• ONF (National Forestry Board) is a State Public Body, under the joint supervision of the Ministries of Forestry and the Environment • Is responsible for forest management for both the state and local government, and has a public service remit to aid the State and local authorities, in particular in the role of protecting forests against fire • Has a specialized agency in the Midi-Mediterranean area to protect forests against fires that performs the following tasks: Operational - monitoring, detection, first response, support to control activities Development and maintenance work - roads, water points, areas cleared of undergrowth Expertise support - hazard and fire mapping and risk of fire management plans, mapping equipment… Project management 5
SENTINEL-2

Sentinel-2 is an Earth observation mission developed by
ESA as part of the Copernicus Programme to perform
terrestrial observations in support of services such as forest
monitoring, land cover changes detection, and natural
disaster management. It consists of two identical satellites,
Sentinel-2A and Sentinel-2B launched in 2015 and 2017
• Multi-spectral data with 13 bands in the visible, near
 infrared, and short wave infrared part of the spectrum
• Revisiting every 5 days.
• Spatial resolution of 10 m, 20 m and 60 m
• 290 km field of view
PLEIADES

The Pléiades constellation is composed of two very-
high-resolution optical Earth-imaging satellites.
Pléiades-HR 1A and Pléiades-HR 1B. Designed as a dual
civil/military system, Pléiades will meet the space
imagery requirements of European defence as well as
civil and commercial needs.
• Multi-spectral (including near infrared) and panchromatic
 data / stereoscopic images
• Revisiting every 26 days.
• Spatial resolution of 50cm and 2 m
• 100 km field of view
Illustrations on Rognac forest fire
near Marseille August 10th , 2016
 (area burnt more than 2600 ha)

Photography by cosmonaut Oleg Skripochka from ISS
Plan of presentation
• Introduction
• Use of SENTINEL and PLEIADES for contour and severity
 mapping
• Use of PLEIADES images for precise cartography
• Use of SENTINEL for risk mapping
• Conclusion

 9
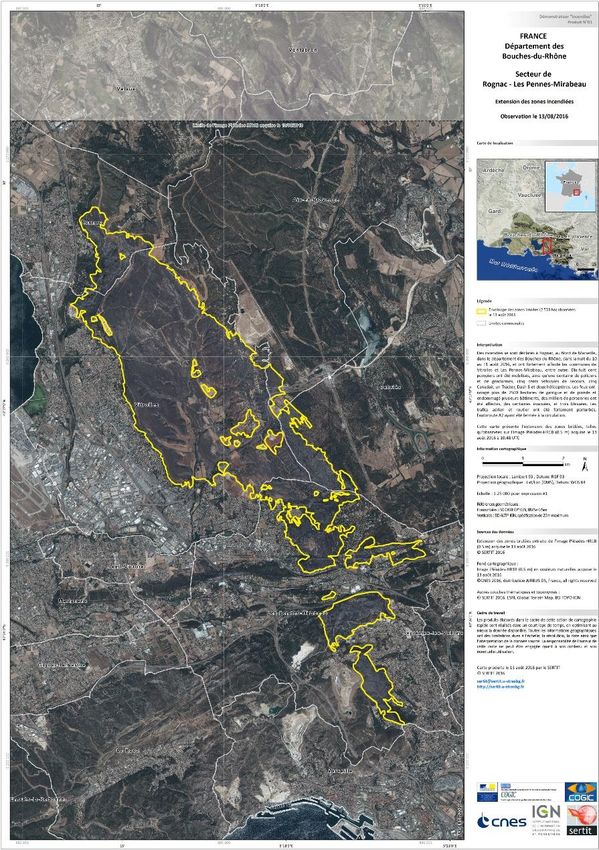
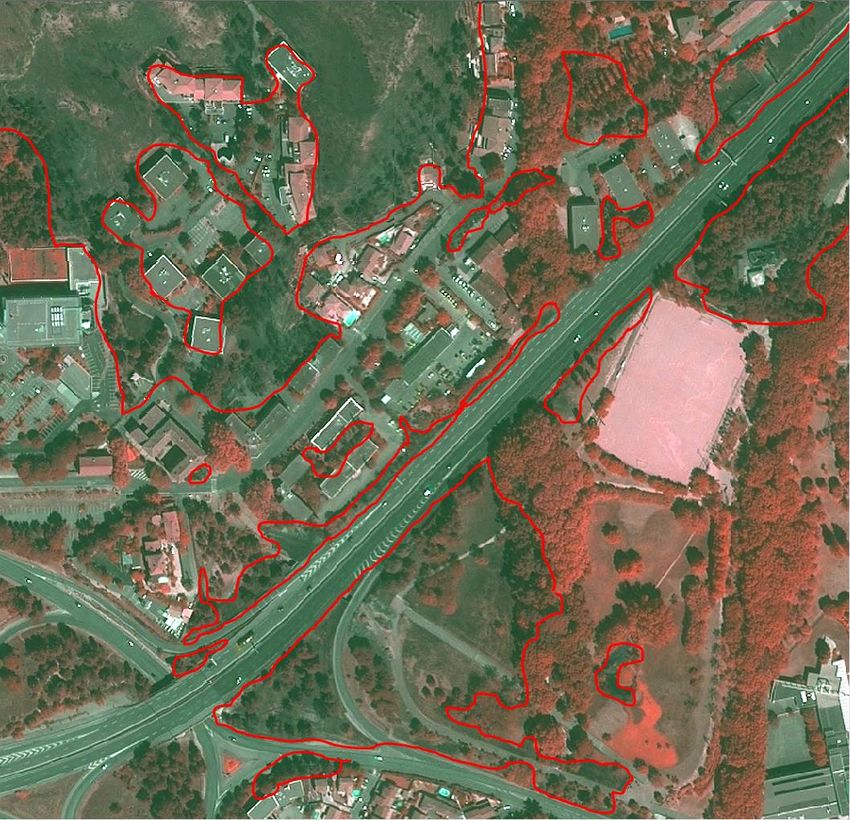
Contour mapping : Pléiades data

 Contour digitized by photo-
 interpretation

7/12/2017 10
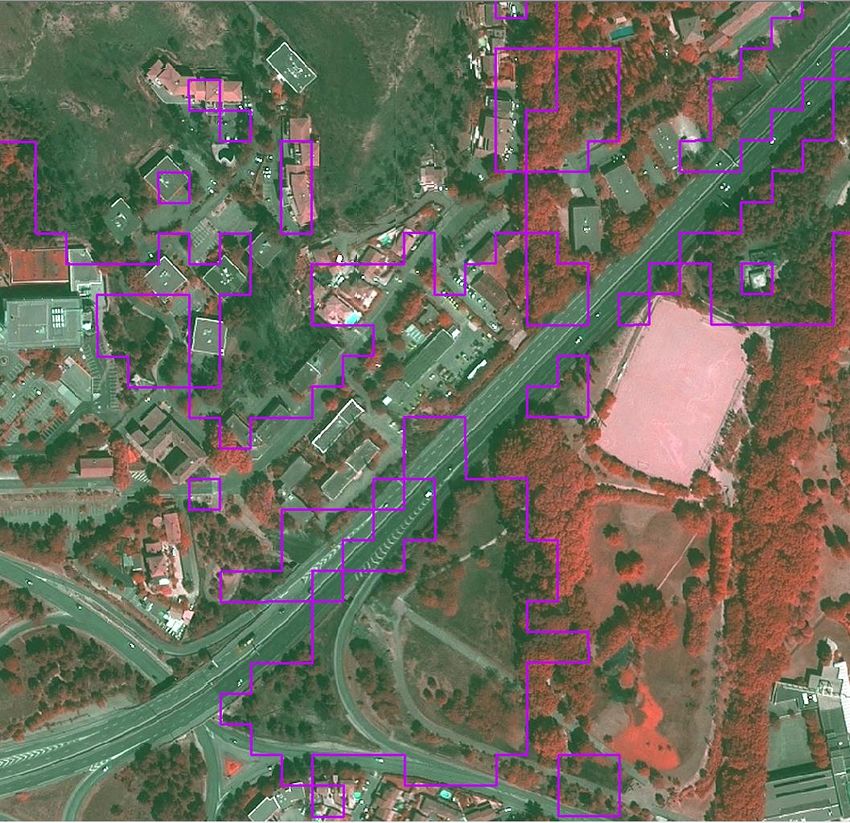
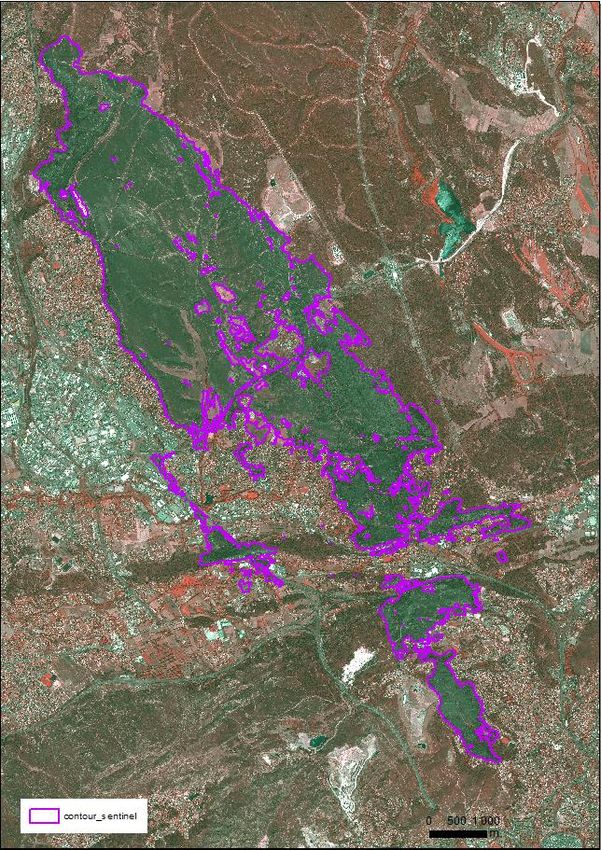
Contour mapping : Sentinel-2 data
 Burnout :
 fully automatic tool for burn
 scar mapping on Sentinel-2 and
 Landsat-8 data.

 FULL TILE PROCESSED

 >90% accuracy

7/12/2017 11
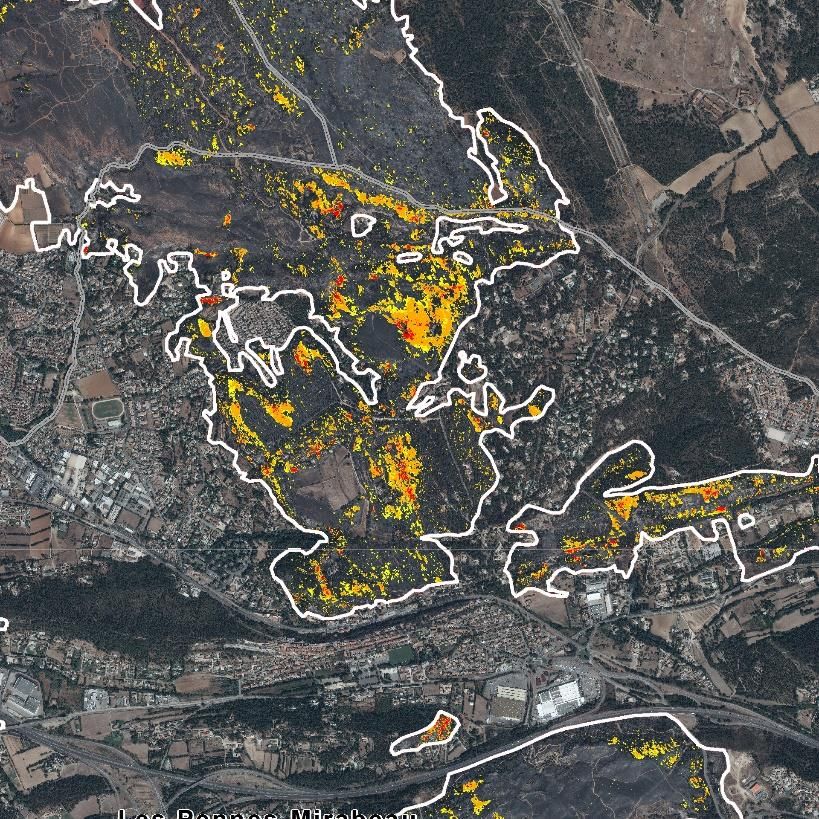
Severity : Sentinel-2
 ΔNBR Burn Severity −
 < 0.1 Unburned NBR =
 NBR pre +
 0.1 to 0.27 Low-severity burn
 Moderate-low
 0.27 to 0.44 NBR pre ; NBR post ; dNBR
 severity burn
 Moderate-high
 0.44 to 0.66
 severity burn
 > 0.66 High-severity burn

 All calculated by Burnout tool

 dNBR = NBR(pre-fire) - NBR(post-fire)

 dNBR

 NBR post
7/12/2017 12
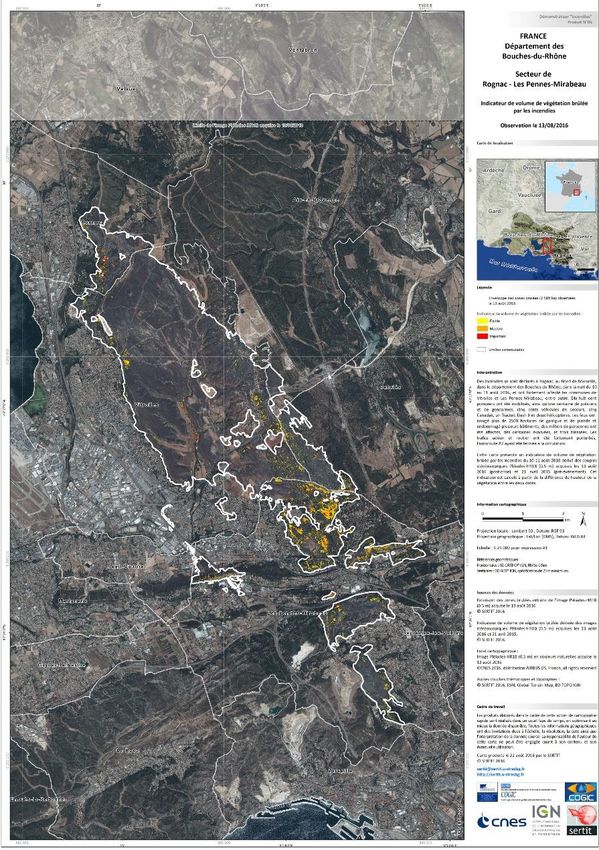
Volume : burned vegetation
 The map presents an indicator of vegetation volume
 loss after the August 2016 fires.

 It’s derived from Pléiades stereoscopic data acquired
 on the 13th August 2016 and 21st April 2015.

 The method is currently under development at ICube-
 SERTIT.

7/12/2017 13
Contour and severity mapping : Sentinel-2 data
• Method of calculation using the Near InfraRed (NIR) and Shortwave Infrared bands (SWIR) of images from the Sentinel 2 satellite (EU
 Copernicus Project) made available by ESA and CNES
• Resolution of pixel images of 20m x 20m
• 10 days between 2 images with 1 satellite (Sentinel 2A) but will be reduced to 5 days in 2017 with Sentinel 2B

 −
 NBR =
 +

 NBR post fire NBR pre fire
 Post-fire image of 13/08/2016 Pre-fire image 03/08/2016
 Sentinel 2A © ESA 2016 © CNES 2016 Sentinel 2A © ESA 2016 © CNES 2016

 dNBR = NBR(pre-fire) - NBR(post-fire)
 14
Contour mapping methodology
Result of the dNBR calculation (raster format)
 Value > 0.1

 Vectorization without
 smoothing pixels

 15
Severity mapping methodology
• The Severity of the fire on the vegetation is defines as being the loss of aerial and subterranean organic matter
 due to the fire, by combustion or mortality.
• The classes of the severity index are defined from US fires, but can be used as first approximation to interpret
 the dNBR in Mediterranean conditions.

 ΔNBR Burn Severity Categories
 (USGS Firemon)
 ΔNBR Burn Severity
 < 0.1 Unburned
 0.1 to 0.27 Low-severity burn
 0.27 to 0.44 Moderate-low severity burn
 0.44 to 0.66 Moderate-high severity burn
 > 0.66 High-severity burn

 Map of severity index Map of severity index
 (continue datas from value -2 to +2) (datas with US classification)

 16
Evaluation of the impacts of the fire on
 the vegetation using severity index
 • Fields measurements on the Rognac fire indicate that:

 – For a same severity index, the impacts on the vegetation vary with the type of vegetation in place before fire:
 • Wooded type (forest) : Végétation > 3m
 • Brush type (moor, garrigue, maquis) végétation < 3m
 • Herbaceous type

 – For a same severity index, the impacts on the vegetation vary with the density of the vegetal cover
 – Test of a composite index of impact on the vegetation function of the type of végetation and of the severity
 index
Sévérité : Moyenne
 Densité /
Mélange houppier couvert de
roussi ou Sévérité du feu sur la végétation (dNBR)
 la
partiellement roussi.
Présence de sujet végétation
vert possible
 Faible Moyen Fort
 Houppier vert ou
 Etage arborée
 légèrement roussi sur la Houppier totalement roussi
 totalement ou
 Forêt partie inférieure (présence de quelques
 partiellement brulé
 (Sous étage et litière sujets encore vert possible)
 (feu de cime)
 brulée)
 Source : Google Earth (mode bâtiment 3D)
 Source : ONF 2016 Agence DFCI
Sévérité : Moyenne Faible Végétation totalement brulé

Houppier roussi
 Arbustif Moyenne Strate arbustive roussie Végétation totalement brulée

 Strate arbustive verte et Strate arbustive brulée et Végétation
 Dense
 roussie (en mélange) roussi (en mélange) totalement brulé
 Végétation rase Végétation haute
 Herbacée
 totalement brulée totalement brulée

 Source : Google Earth (mode Street View) Source : ONF 2016 Agence DFCI
 17
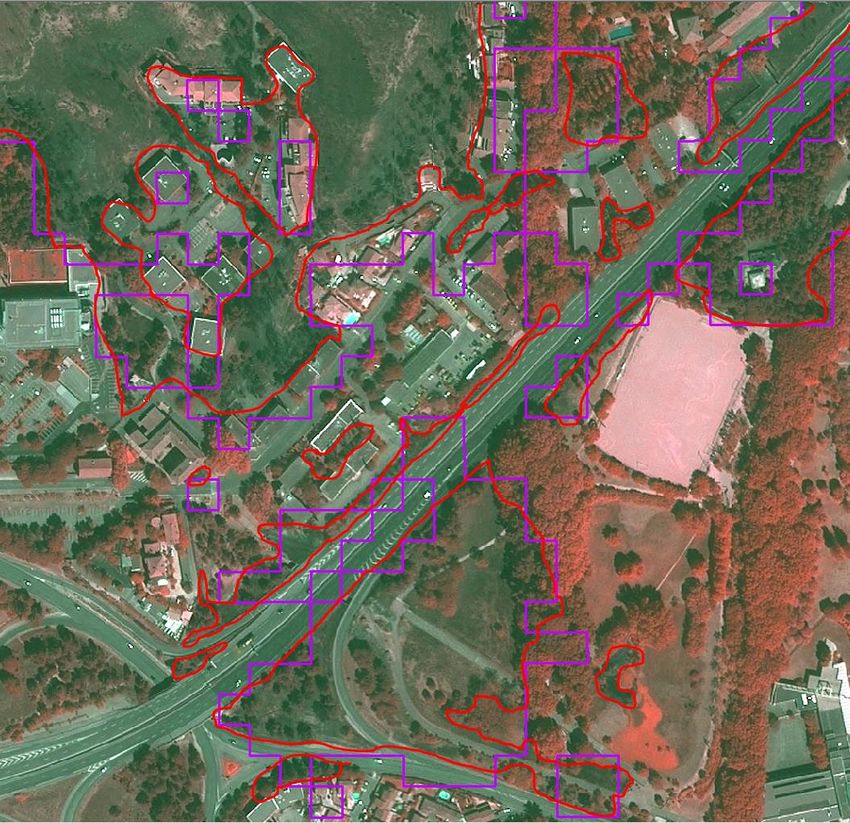
Comparison of the results

• Shapes of the fire slightly differents
 • Contour digitized by photo-
 interpretation of Pleaides by SERTIT
 • Automatic burn scar mapping on
 dNBR of Sentinel-2 for ONF

 18
Comparison of the results
• Severity index:equivalents results
 • Generalisation and vectorisation by SERTIT (less variability)
 • Calculation and mapping by pixel by ONF (maintained variability)

 Severity Index ONF Severity Index SERTIT 19
Plan of presentation
• Introduction
• Use of SENTINEL and PLEIADES for contour and severity
 mapping
• Use of PLEIADES images for precise cartography
• Use of SENTINEL for risk mapping
• Conclusion

 20
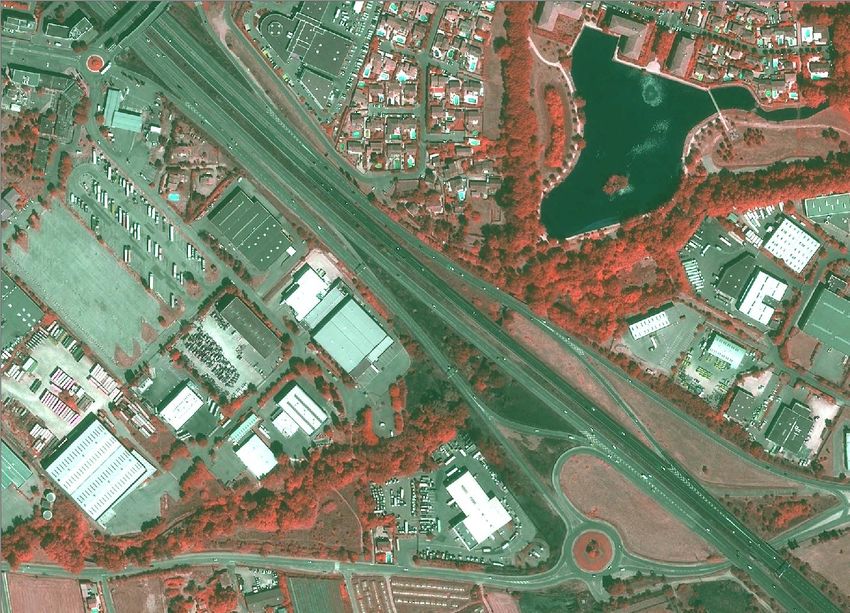
PLEIADES image 8/13/2016 (no treatment)

(Image supplied by SERTIT) (Image supplied by SERTIT)
 21
Treatment of PLEIADES image 8/13/2016 (NDVI)
 NDVI = normalized difference vegetation index (NDVI)
 VIS and NIR stand for the spectral reflectance measurements acquired in the visible
 (red) and near-infrared regions

 22
PLEIADES images 8/13/2016 vs 21/04/2015 (visual comparison)

 (Image supplied by SERTIT) (Image supplied by SERTIT)
 23
Treatment of PLEIADES images 8/13/2016 vs 21/04/2015 (DNDVI)

 24
Contour mapping : Pléiades data difficulties
– Perturbations in dNDVI due to the too large delay between the 2 images and
 differents seasons
– Problems with drop shadows due to the pixel resolution (50cm)
– => automatic treatment of the burn scar very difficult

 Pre fire Post fire
 (unburned)

 Drop shadow DNDVI

 25
This images allow to sharpen the outline of the burnt area in
 complex interfaces

(Image supplied by SERTIT) (Image supplied by SERTIT)

 26
Drawing the outline can only be made manually, by visual
 analysis on different displays

(Image supplied by SERTIT)

 27
These results are very useful for return of experience

 The analysis can enhance different ways of propagation

 Propagation by little
 leaps (30-40m)
 Propagation by
 long leaps
 (500m)

 Propagation by
 long leaps
Propagation by (350m)
« wick effect »
along banks
and edges

 28
Truck garage and highway

(photo B. Horvart / AFP)
 29
Truck garage and highway

before fire
 (Image supplied by SERTIT)

 30
Truck garage and highway

after fire (Image supplied by SERTIT)

 31
Truck garage and highway

DNDVI treatment

 32
Plan of presentation
• Introduction
• Use of SENTINEL and PLEIADES for contour and severity
 mapping
• Use of PLEIADES images for precise cartography
• Use of SENTINEL for risk mapping
• Conclusion

 33
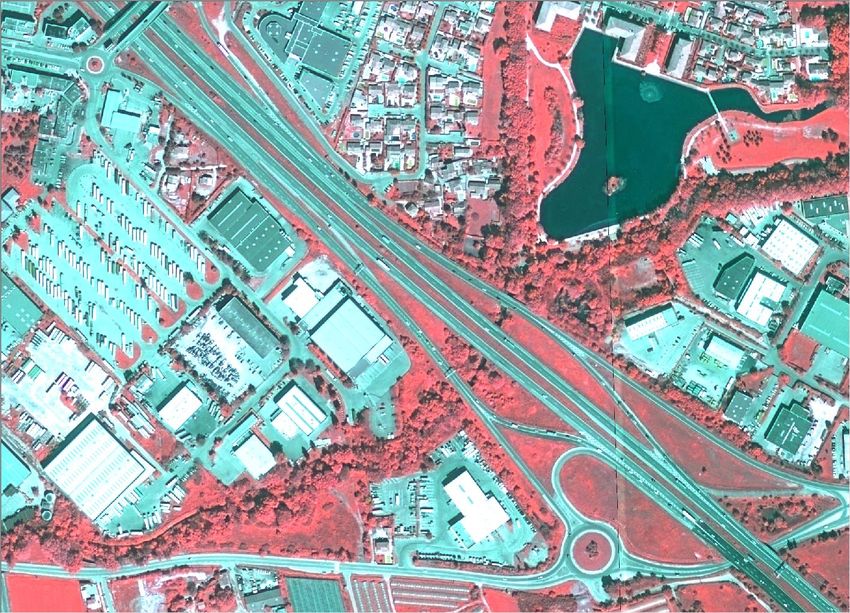
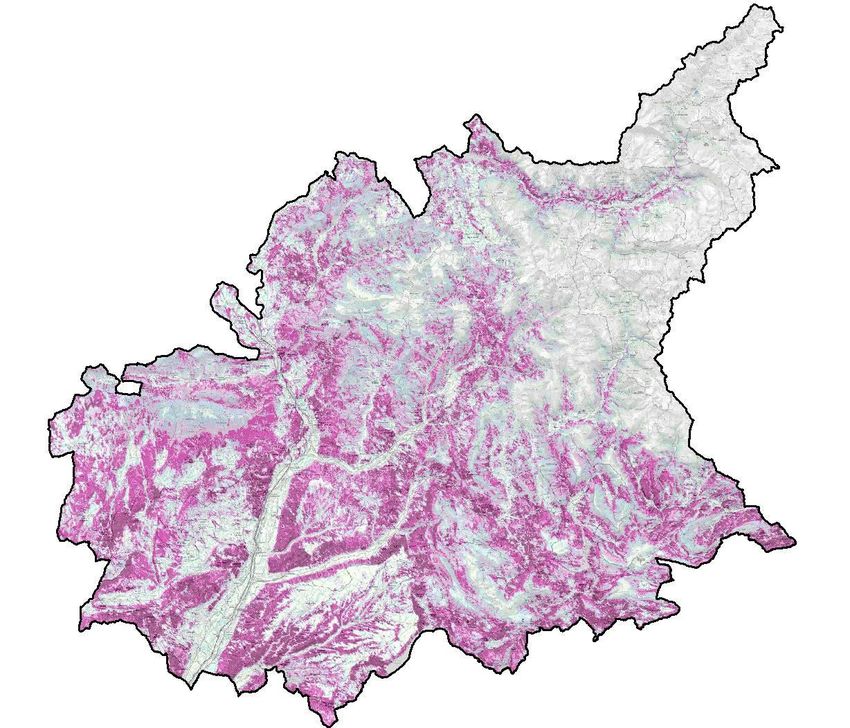
RISK mapping

These images make it possible to obtain many different types
of vegetation or land use. For this purpose the images are
combined with other sources of information on the nature of
the forest stands, the agricultural occupation of the territory
or the distribution of urbanization.

This types are traduced in a level of combustibility then
combined to slopes and wind simulations to calculate the
power of the flame front
Satellite image
Vegetation /land use
Power of the flame front
Plan of presentation
• Introduction
• Use of SENTINEL and PLEIADES for contour and severity
 mapping
• Use of PLEIADES images for precise cartography
• Use of SENTINEL for risk mapping
• Conclusion

 38
Conclusions and perspectives
• Different images for different uses
• Big progress in precision

• further developments
 – ONF
 • Pleiades in WUI (before and after fire)
 • Mapping indicator of impacts on vegetation after fire (vegetation typology x
 severity)
 • Contour mapping and severity for hivernal fires in mountain (surface fires)
 • Post fire erosion indicator (DEM + field+ satellite images + soil datas)

 – SERTIT
 • Mapping from RADAR data available at SERTIT for rapid recognition of burn
 scar area
 • Indicator of vegetation volume loss after fire
 • Post fire erosion indicator

 39
You can also read