Remuneration April 2019 Shareholder Engagement - Royal Dutch Shell plc

Page created by Yolanda Farmer
 
CONTINUE READING
Remuneration April 2019 Shareholder Engagement - Royal Dutch Shell plc
Remuneration
April 2019 Shareholder Engagement

Royal Dutch Shell plc

Gerard Kleisterlee
Chair of the Remuneration Committee
Remuneration April 2019 Shareholder Engagement - Royal Dutch Shell plc
Gearing is defined as net debt as a percentage of total capital. With effect from 2018, the net debt calculation includes the fair value of derivative financial instruments used to hedge foreign exchange and interest rate risks

Definitions &                      relating to debt, and associated collateral balances. Free Cash Flow is defined as the sum of “Cash flow from operating activities” and “Cash flow from investing activities”. Cash flow from operating activities excluding
                                   working capital movements is defined as “Cash flow from operating activities” less the sum of the following items in the Consolidated Statement of Cash Flows: (i) (increase)/decrease in inventories, (ii) (increase)/decrease in
                                   current receivables, and (iii) increase/(decrease) in current payables. Organic free cash flow is defined as free cash flow excluding inorganic capital investment (acquisitions) and divestment proceeds. ROACE (Return on

cautionary note                    Average Capital Employed) is defined as the sum of current cost of supplies (CCS) earnings attributable to shareholders excluding identified items for the current and previous three quarters, as a percentage of the average
                                   capital employed for the same period. Capital employed consists of total equity, current debt and non-current debt. Capital investment comprises capital expenditure, exploration expense excluding well write-offs, new
                                   investments in joint ventures and associates, new finance leases and investments in Integrated Gas, Upstream and Downstream equity securities, all of which on an accruals basis. Divestments comprises proceeds from sale of
                                   property, plant and equipment and businesses, joint ventures and associates, and other Integrated Gas, Upstream and Downstream investments, reported in “Cash flow from investing activities (CFFI)”, adjusted onto an
                                   accruals basis and for any share consideration received or contingent consideration recognised upon divestment, as well as proceeds from the sale of interests in entities while retaining control (for example, proceeds from sale
                                   of interest in Shell Midstream Partners, L.P.). Headline divestments is a non-GAAP metric. Divestment cash proceeds in 2016-2018 were equal to $26.7 billion (in Cash flow from investing activities) and $2.1 billion (“Change
                                   in non-controlling interest” in Cash flow from financing activities, primarily related to Shell Midstream Partners, L.P.). Additionally certain contingent payments associated with these divestments are expected to be received in
                                   the future. This presentation contains the following forward-looking Non-GAAP measures: Organic Free Cash Flow, Free Cash Flow, Capital Investment, CCS Earnings less identified items, Operating Expenses, ROACE,
                                   Capital Employed and Divestments. We are unable to provide a reconciliation of the above forward-looking Non-GAAP measures to the most comparable GAAP financial measures because certain information needed to
                                   reconcile the above Non-GAAP measure to the most comparable GAAP financial measure is dependent on future events some which are outside the control of the company, such as oil and gas prices, interest rates and
                                   exchange rates. Moreover, estimating such GAAP measures with the required precision necessary to provide a meaningful reconciliation is extremely difficult and could not be accomplished without unreasonable effort. Non-
                                   GAAP measures in respect of future periods which cannot be reconciled to the most comparable GAAP financial measure are calculated in a manner which is consistent with the accounting policies applied in Royal Dutch Shell
                                   plc’s financial statements. As the projects are expected to be multi-decade producing the per barrel projection will not be reflected either in earnings or cash flow in the next five years. The financial measures provided by
                                   strategic themes represent a notional allocation of ROACE, capital employed, capital investment, free cash flow, organic free cash flow and underlying operating expenses of Shell’s strategic themes. Shell’s segment reporting
                                   under IFRS 8 remains Integrated Gas, Upstream, Downstream and Corporate. All outlook on financial metrics and/or alternative performance measures excludes the effect of IFRS 16 implementation.
                                   Also, in this presentation we may refer to “Shell’s Net Carbon Footprint”, which includes Shell’s carbon emissions from the production of our energy products, our suppliers’ carbon emissions in supplying energy for that
                                   production and our customers’ carbon emissions associated with their use of the energy products we sell. Shell only controls its own emissions but, to support society in achieving the Paris Agreement goals, we aim to help and
                                   influence such suppliers and consumers to likewise lower their emissions. The use of the terminology “Shell’s Net Carbon Footprint” is for convenience only and not intended to suggest these emissions are those of Shell or its
                                   subsidiaries.
                                   The companies in which Royal Dutch Shell plc directly and indirectly owns investments are separate legal entities. In this presentation “Shell”, “Shell group” and “Royal Dutch Shell” are sometimes used for convenience where
                                   references are made to Royal Dutch Shell plc and its subsidiaries in general. Likewise, the words “we”, “us” and “our” are also used to refer to Royal Dutch Shell plc and its subsidiaries in general or to those who work for
                                   them. These terms are also used where no useful purpose is served by identifying the particular entity or entities. ‘‘Subsidiaries’’, “Shell subsidiaries” and “Shell companies” as used in this presentation refer to entities over
                                   which Royal Dutch Shell plc either directly or indirectly has control. Entities and unincorporated arrangements over which Shell has joint control are generally referred to as “joint ventures” and “joint operations”, respectively.
                                   Entities over which Shell has significant influence but neither control nor joint control are referred to as “associates”. The term “Shell interest” is used for convenience to indicate the direct and/or indirect ownership interest held
                                   by Shell in an entity or unincorporated joint arrangement, after exclusion of all third-party interest.
                                   This presentation contains forward-looking statements (within the meaning of the U.S. Private Securities Litigation Reform Act of 1995) concerning the financial condition, results of operations and businesses of Royal Dutch
                                   Shell. All statements other than statements of historical fact are, or may be deemed to be, forward-looking statements. Forward-looking statements are statements of future expectations that are based on management’s current
                                   expectations and assumptions and involve known and unknown risks and uncertainties that could cause actual results, performance or events to differ materially from those expressed or implied in these statements. Forward-
                                   looking statements include, among other things, statements concerning the potential exposure of Royal Dutch Shell to market risks and statements expressing management’s expectations, beliefs, estimates, forecasts, projections
                                   and assumptions. These forward-looking statements are identified by their use of terms and phrases such as “aim”, “ambition’, ‘‘anticipate’’, ‘‘believe’’, ‘‘could’’, ‘‘estimate’’, ‘‘expect’’, ‘‘goals’’, ‘‘intend’’, ‘‘may’’,
                                   ‘‘objectives’’, ‘‘outlook’’, ‘‘plan’’, ‘‘probably’’, ‘‘project’’, ‘‘risks’’, “schedule”, ‘‘seek’’, ‘‘should’’, ‘‘target’’, ‘‘will’’ and similar terms and phrases. There are a number of factors that could affect the future operations of Royal
                                   Dutch Shell and could cause those results to differ materially from those expressed in the forward-looking statements included in this presentation, including (without limitation): (a) price fluctuations in crude oil and natural gas;
                                   (b) changes in demand for Shell’s products; (c) currency fluctuations; (d) drilling and production results; (e) reserves estimates; (f) loss of market share and industry competition; (g) environmental and physical risks; (h) risks
                                   associated with the identification of suitable potential acquisition properties and targets, and successful negotiation and completion of such transactions; (i) the risk of doing business in developing countries and countries subject
                                   to international sanctions; (j) legislative, fiscal and regulatory developments including regulatory measures addressing climate change; (k) economic and financial market conditions in various countries and regions; (l) political
                                   risks, including the risks of expropriation and renegotiation of the terms of contracts with governmental entities, delays or advancements in the approval of projects and delays in the reimbursement for shared costs; and (m)
                                   changes in trading conditions. No assurance is provided that future dividend payments will match or exceed previous dividend payments. All forward-looking statements contained in this presentation are expressly qualified in
                                   their entirety by the cautionary statements contained or referred to in this section. Readers should not place undue reliance on forward-looking statements. Additional risk factors that may affect future results are contained in
                                   Royal Dutch Shell’s Form 20-F for the year ended December 31, 2018 (available at www.shell.com/investor and www.sec.gov). These risk factors also expressly qualify all forward-looking statements contained in this
                                   presentation and should be considered by the reader. Each forward-looking statement speaks only as of the date of this presentation, April 1, 2019. Neither Royal Dutch Shell plc nor any of its subsidiaries undertake any
                                   obligation to publicly update or revise any forward-looking statement as a result of new information, future events or other information. In light of these risks, results could differ materially from those stated, implied or inferred
                                   from the forward-looking statements contained in this presentation. We may have used certain terms, such as resources, in this presentation that the United States Securities and Exchange Commission (SEC) strictly prohibits us
                                   from including in our filings with the SEC. U.S. Investors are urged to consider closely the disclosure in our Form 20-F, File No 1-32575, available on the SEC website www.sec.gov.

  Royal Dutch Shell   April 2019                                                                                                                                                                                                                                                  2
Remuneration April 2019 Shareholder Engagement - Royal Dutch Shell plc
Agenda                             Themes for today

                                     Our approach to remuneration and its alignment to our strategy

                                     2018 pay outcome

                                     2019 developments

                                     2020 policy review

  Royal Dutch Shell   April 2019                                                                      3
Remuneration April 2019 Shareholder Engagement - Royal Dutch Shell plc
Alignment                          Strategy          How the strategy links to the CEO’s 2018 variable pay elements

with 2018
strategy                                              CEO
                                                                       The vision for thriving in the energy transition is led by
                                         Thrive in    INDIVIDUAL
                                       the energy     PERFORMANCE      the CEO and embedded in his individual performance targets.
                                        transition

                                      World-class     LONG-TERM        World-class investment metrics such as cash generation and capital
                                      investment      INCENTIVE        discipline, as well as value created for shareholders, are included
                                         case         PLAN
                                                                       in the LTIP.

                                         Strong                        Licence to operate measures such as operational excellence and
                                         licence      ANNUAL           sustainable development are included in the scorecard. The measures are
                                       to operate     BONUS            key building blocks to being a world-class investment
                                                                       case and support our journey to thrive in energy transition.

  Royal Dutch Shell   April 2019                                                                                                             4
Remuneration April 2019 Shareholder Engagement - Royal Dutch Shell plc
2018 and                                                         Base salary

historical pay                                                   €’000        Peter Voser on seat
                                                                                  from July 1
                                                                  2,000
outcomes                                                                                                0%              +3.3%               +3.2%     +2.5%
                                                                                                                                                                Ben van Beurden
                                                                                                                                                                     on seat
                                                                                                                                                                                              +2.1%                     +2.1%                     +2.1%                        +2.5%
                                                                  1,500            1,750
                                                                                                                        1,550               1,600      1,640
                                                                                                     1,500                                                                                                                  1,460                 1,490                        1,527
                                                                                                                                                                      1,400                   1,430
                                                                  1,000

                                                                     500

                                                                         0
                                                                                    2009[A]          2010               2011                2012       2013           2014                    2015                          2016                  2017                         2018

                                                                 Annual Bonus Scorecard outcome                                                                LTIP vesting outcome
          Base salary
                                                                     2                                                                                         200%
          developed at                                                                                                                              10-year
                                                                                                                                                    average:
          consistent pace                                         1.5                                                                               1.24
                                                                                                                                                               150%

          Scorecard on
                                                                                                                                                               100%                                                                                                              Target
          average above                                              1                                                                                                                                                                                                           10-year
                                                                                                                                                                                                                                                                                 average:
          target                                                                                                                                                50%                                                                                                              89% of
                                                                                                                                                                                                                                                                                 target
          LTIP vesting                                            0.5
                                                                                                                                                                0%
          on average

                                                                                                                                                                                                                                                                      16-'18
                                                                                                                                                                         '07-'09

                                                                                                                                                                                    '08-'10

                                                                                                                                                                                              '09-'11

                                                                                                                                                                                                        '10-'12

                                                                                                                                                                                                                  '11-'13

                                                                                                                                                                                                                              '12-'14

                                                                                                                                                                                                                                        '13-'15

                                                                                                                                                                                                                                                  '14-'16

                                                                                                                                                                                                                                                            '15-'17
                                                                     0
          below target                                                       2009 2010 2011 2012 2013 2014 2015 2016 2017 2018
                                                                              Discretion applied                                                                              TSR             EPS             CFFO               Production/ROACE

[A] Peter Voser on seat from July 1. Figure shown is the proration of salary for Jeroen van der Veer (€2 mln) and Peter Voser (€1.5 mln).

          Royal Dutch Shell        April 2019                                                                                                                                                                                                                                             5
Remuneration April 2019 Shareholder Engagement - Royal Dutch Shell plc
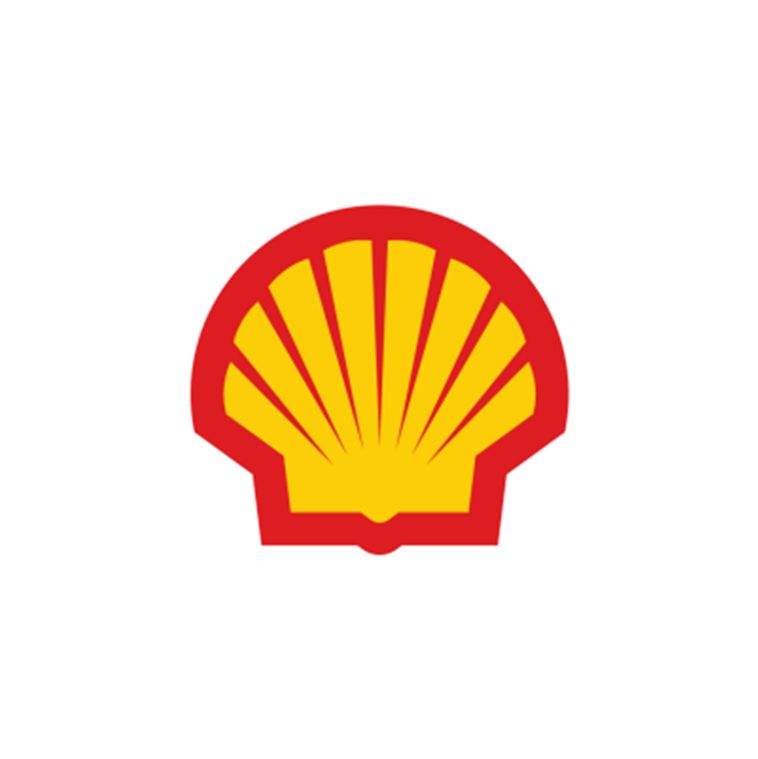
2016 LTIP –                                                    Total shareholder return [A]                                                                         Earnings per share growth [B]

vesting outcome                                                          Shell                                                                                                Shell

                                                                            BP                                                                                                   BP

                                                                    Chevron                                                                                              Chevron

                                                                         Total                                                                                                Total

                                                                ExxonMobil                                                                                           ExxonMobil

                                                                                 0%            20%              40%             60%              80%                                  0%            100%            200%             300%            400%

                                                               Cash flow from operations growth                                                                     ROACE growth

                                                                         Shell                                                                                                   BP

                                                                    Chevron                                                                                                   Shell

                                                                         Total                                                                                           Chevron

     World class investment                                                 BP                                                                                                Total
     case: metrics above                                        ExxonMobil                                                                                           ExxonMobil
     target
                                                                                 0%         20%           40%          60%          80%          100%                                 0%        2%         4%         6%         8%         10%        12%
[A] TSR measured from 1 January 2016 to 31 December 2018 using a share price averaged over 90 days (45 days either side of the relevant date).
[B] Calculated on Current Cost of Supplies (CCS) basis, and EPS replaced by FCF for awards granted from 2017 onwards.
LTIP measures are based on relative performance compared with the other oil majors. Growth is measured and ranked based on the 2018 full year data points compared with those at the beginning of the period (financial year 2015 for earnings per share
growth, cash flow from operations growth and ROACE growth) using published financial information.

          Royal Dutch Shell      April 2019                                                                                                                                                                                                                  6
Remuneration April 2019 Shareholder Engagement - Royal Dutch Shell plc
Performance                                                      Performance and delivery

                                                                    Delivery                                                                           Gearing reduced to 20.3%
                                                                                                   Financial
                                                                    in 2018                                                                            All-cash dividend paid
                                                                                                   Framework
                                                                                                   Delivery                                            Started $25 billion buyback programme

                                                                                                   Portfolio                                           Cash Flow From Operations (CFFO) of $53 billion
                                                                                                   & projects                                          Realised $10 billion CFFO from new projects in 2018
                                                                                                   delivery
                                                                                                                                                       Continued to lead the way in energy transition debate

                                                                    Delivery                       Financial                                           Disciplined & efficient capital allocation
                                                                    in 2016-                       Framework
                                                                    2018                           Delivery                                            Canceled scrip dividend

     On track to deliver
     organic FCF of $25-                                                                           Portfolio                                           Realised BG synergies
                                                                                                   & projects                                          Delivered $30 billion divestment programme
     $30 billion by 2020 as
                                                                                                   delivery
     announced in 2017                                                                                                                                 Reduced underlying operating expenses

Divestments: headline. 2020 organic free cash flow outlook at $60 per barrel real terms 2016, mid-cycle Downstream. Share buybacks: subject to further progress with debt reduction and oil price conditions.
CFFO from new projects in 2018 and 2020 compared with 2014, at $60 per barrel real terms 2016, mid-cycle Downstream.

          Royal Dutch Shell       April 2019                                                                                                                                                                    77
Remuneration April 2019 Shareholder Engagement - Royal Dutch Shell plc
CEO pay                                                           Pay outcome

 outcome                                                            Fixed
                                                                    remuneration
                                                                                                                      Base salary:
                                                                                                                     = € 1,527,000
                                                                                                                                                         Benefits:                                              €1,559,050
                                                                                                                                                        = € 32,050

                                                                                                                                                           2018
                                                                    Annual                                           Target bonus:                                             Individual performance           €3,000,000
                                                                                                                                                         scorecard
                                                                    bonus                                            = € 2,290,500                                                   factor = 1.0                (196% of base salary)
                                                                                                                                                        result = 1.31

                                                                                                           Vesting outcome: [A]                 Increase in share price: [B]   Accrued dividends: [C]
                                                                    LTIP                             236,302 x 190% = 448,974 RDS A                 448,974 x €7.215             107,432 x RDS A                € 15,209,358
                                                                                                               (€9,033,353)                           (€3,239,346)                 (€2,936,659)

                                                                    Pension                                                                                                                                     € 369,400

                                                                                                                                                                                                        Total   € 20,137,808

                                                                   Shareholding level
                                                                                                                                                                                                                       11.8x base salary

       2016 vested LTIP shares
       were subject to two-year                                                                                                                                                 6x base salary
       holding period. CEO                                                                                                           4.5x base salary

       voluntarily extended to                                                     2x base salary

       three years.

[A] Based on the share price at grant of €20.12.
                                                                                      Dec-16                                            Dec-17                                     Dec-18                                   Mar-19
[B] Calculated as the share price at vesting minus the share price at the date of grant €27.335 - €20.12 = €7.215.
[C] Based on the share price at vesting of €27.335.

           Royal Dutch Shell        April 2019                                                                                                                                                                                             8
Alignment: comparative pay ratio approaches indicate that Shell is in line with peers and FTSE 30
Pay levels
                                                                       Consistency: jobs at all levels in Shell are benchmarked externally

                                                                       Competitiveness: packages are set in the context of the relevant market to ensure we attract and retain talent

                                                                       Sharing in success: 55,000 employees are on the same annual bonus scorecard as the CEO. 16,000
                                                                       employees receive share awards with similar performance measures

                                                                  Target pay 2019 [A]                                                                                   CEO: pay ratio
                                                                   Internally proportionate                                                                             FTSE 30 CEO single total figure against actual average global employee
                                                                   Base salary, plus on-target bonus and long-term incentive,                                           costs [B]
                                                                   benchmarked externally against relevant market
                                                                                                                                                                     Lower quartile     Median

                                                                   CEO

          Competitive                                              CFO

          in market
          Proportionate                                              EC                                                                                                 Lowest CEO pay ratio                                    Highest CEO pay ratio

          internally                                                                                                                                                       Shell minimum pay ratio [D]
                                                                             Fixed remuneration           Annual incentive         Long-term incentive                     Shell 2017 CEO single total figure pay ratio [C]
          Staff shares in
                                                                                                                                                                           Shell maximum pay ratio [D]
          success                                                                                                                                                          Shell 2018 CEO single total figure pay ratio [E]

[A] EC refers to Executive Committee excluding CEO and CFO. SE refers to Senior Executive, the top-level of Shell management below the Executive Committee. [B] Based on average global employment cost using employee numbers and staff costs (excluding
social security costs) as disclosed in the financial statements (n.b. this is not a CEO pay ratio defined under any UK requirement). [C] See “Single total figure of remuneration for Executive Directors’ on page 101 of the 2017 Annual Report. [D] Calculated based
on CEO pay scenarios as illustrated on page 143 of the Annual Report against 2018 actual average global employee costs. The 2018 single figure ratio exceeds this theoretical maximum as the theoretical maximum does not include share price appreciation and
dividends. [E] See “Single total figure of remuneration for Executive Directors’ on page 131 of the 2018 Annual Report.

          Royal Dutch Shell        April 2019                                                                                                                                                                                                                            9
2019                               Key changes in 2019 – anticipating 2020 Policy proposals

Developments
                                    2019 Policy
                                    We engaged shareholders early in preparation for 2020 Policy review. Having listened to
                                    views we have decided to accelerate some changes. Our shareholder approved policy is
                                    broad enough to make these changes without waiting until the vote in 2020 and we are
                                    accelerating the following three changes to take effect from 2019:

  Engaged with
  shareholders
  Listened to their
                                       Energy transition            Bonus simplification             CEO target bonus
  views
  Accelerating changes                   Inclusion of energy         Removal of individual       Target annual bonus reduced
  to 2019, from our                  transition condition in LTIP    performance element            to 125% of base salary
  2020 Policy work

  Royal Dutch Shell   April 2019                                                                                               10
Remuneration                       Evolution of GHG and energy transition-related metrics

developments –
energy transition

                                           2017                   2018                 2019              2020 Policy review

                                     GHG management in      Evolved GHG          Energy transition in
                                     Group Annual Bonus     management           LTIP:
                                     Scorecard:             in Group Annual         3-year NCF target
   Measures are
                                       ~60% of operated     Bonus Scorecard         (energy products
   evolving                            scope 1&2            (intensities)           sold), and
   Introduction of                     emissions            Close to 90% of         Measures promoting
   energy transition                   Applies to ~55,000   operated scope 1&2      NCF reduction in
   metric in LTIP in                   people               emissions               long-term
                                                                                 GHG management in
   2019
                                                                                 Group Annual Bonus
                                                                                 Scorecard

  Royal Dutch Shell   April 2019                                                                                              11
Remuneration                                                  Energy transition LTIP metrics

developments –                                                       The energy transition condition will contain a mix of measures that set the foundations to contribute to
                                                                     Shell’s strategic ambitions in the longer run:
energy transition
                                                                         Net Carbon Footprint (NCF): a target for reducing the NCF of the energy Shell sells [A]

                                                                         Growth of our power business

                                                                         Advanced biofuels technology

                                                                         Development of systems to capture and absorb carbon

          10% weighting                                           25% Absolute           2018 LTIP structure                                                                      2019 LTIP structure
                                                                  measures
                                                                                                                                                            32.5% Absolute
          expected to increase                                                                                                                              measures
                                                                                                      75%
                                                                                                                                                                                          67.5%
          over time                                                                                   Comparative
                                                                                                                                                                                          Comparative
                                                                     25%                   25%
                                                                                                      measures                                                       10.0%                measures
          Applies to 150                                                                                        TSR
                                                                                                                                                                                  22.5%                 TSR

          senior executives                                                                                     ROACE
                                                                                                                                                                                                        ROACE
                                                                                                                                                          22.5%
          Key collaboration                                                                                                                                                                             CFFO
                                                                                                                CFFO
                                                                                                                                                                                                        FCF
          with CA100+ and                                                                                       FCF
                                                                     25%                   25%                                                                                     22.5%                Energy transition
          major shareholders
                                                                                                                                                                    22.5%

[A] For the 2019 award, the target is a 2-3% reduction in NCF from the 2016 baseline NCF disclosed in the 2018 Climate Change section on page 77 of Shell’s 2018 Annual Report.

         Royal Dutch Shell       April 2019                                                                                                                                                                                 12
2020                               Process

Developments
                                     2020 Policy
                                     Continue Policy review in preparation for the 2020 AGM

                                       No further change in policy proposed in 2020 for: LTIP structure, threshold vesting level or
                                       bonus structure
                                       Areas for consideration: balance of LTIP measures following introduction of energy
 Remuneration
                                       transition, comparator group, best practice policies around shareholding requirements,
 Committee continues
 its Policy review                     pensions and malus and clawback
 for the 2020 AGM

  Royal Dutch Shell   April 2019                                                                                                      13
Summary                            2018 Remuneration outcomes

for 2019                             Above target Annual Bonus Scorecard outcome

AGM Voting                           Outstanding relative LTIP performance for 2016-2018 across four key financial metrics
                                     Improved disclosures on REMCO’s decision-making
                                     2018 variable pay mainly in shares
                                     CEO pay: 2016 vested LTIP shares subject to two-year holding period. CEO voluntarily
                                     extended to three years, in accordance with holding policy introduced in 2017

                                   Changes in 2019 Remuneration
                                     Salary increase in line with broader workforce
                                     Reduction in CEO’s target bonus opportunity so target is now 50% of maximum
                                     Removal of individual performance factors for the Executive Directors
                                     New energy transition condition in LTIP

  Royal Dutch Shell   April 2019                                                                                             14
Questions & Answers

Royal Dutch Shell   April 2019
Benchmarked against 4 oil majors
Directors’                                      Fixed
                                                                        and 15 European companies

remuneration                                    remuneration
policy

                                   Short term
                                                                        Short-term operational delivery         30%
                                                                                                                                         50% Operational
                                                                                                                CFFO
                                                           50% cash     targets                                                          excellence

                                                Annual                  50% bonus in shares, subject to
                                                                                                                20% Sustainable
                                                                                                                                         12.5% Project delivery
                                                                        3-year holding period which                                      12.5% Production
                                                bonus                                                           development              12.5% LNG liquefaction
                                                           50% shares   remains in force post-leaving                                    volumes
                                                                                                                10% Safety               12.5% DS availability
                                                                                                                10% GHG

                                                                        World-class investment financial
                                                                                                                    22.5% TSR                22.5% FCF
                                                                        metrics
                                                Long Term
                                                                        3-year performance + 3-year
                                                Incentive Plan                                                    22.5% ROACE            22.5% CFFO growth
                                                                        holding period which remains
                                                2019                                                                 growth
                                   Long term

                                                                        in force post-leaving
                                                                                                                             10% Energy Transition

                                                Shareholding &          Shareholding requirement: CEO: 7 x base salary; CFO: 4 x base salary
                                                holding periods

                                                Malus & clawback        Malus and clawback provision apply to bonus and LTIP

  Royal Dutch Shell   April 2019                                                                                                                             17
2018
Annual bonus
                                                                                                12.5%
                                                                                                LNG liquefaction
                                                                                                                                        50%                                                   10%
                                                                                                                                                                              10%
                                                                                                                                                                                              GHG
                                                                                                                                                                              Environment
                                                                                                                                                                                              management
                                                                                                12.5%
                                                                                                Production
                                                                                                                                                                  20%

                                                                                                12.5%                                                                                         5%
                                                                                                DS availability                                                                               Personal safety
                                                                                                                                                 30%                          10%
                                                                                                                                                                              Safety
                                                                                                12.5%                                                                                         5%
                                                                                                Project delivery                                                                              Process safety

                                                                                                  Cash flow from operating activities    Operational excellence     Sustainable development
     Rewards delivery of
     short-term operational
                                                                                                     Upstream and Integrated Gas GHG intensity: tonne CO2-equivalent per tonne of production
     targets as well as                                            10%
                                                                                                     Refining GHG intensity: tonne CO2-equivalent per UEDCTM [B]
                                                                   GHG management [A]
     individual contribution                                                                         Chemicals GHG intensity: tonne CO2-equivalent per tonne of steam cracker high value chemicals production
     to Shell

[A] GHG metrics have evolved in 2018 [B] Solomon’s utilised equivalent distillation capacity.

          Royal Dutch Shell       April 2019                                                                                                                                                                    18
Shareholder                                                                      1 year
                                                   Annual
alignment and                                      bonus
                                                                                 performance       Net shares held for 3 years

longer time                                                                      period

horizons                                                                                       50% delivered in cash
                                                                                               50% delivered in shares

                                                   Long Term                     3 year
                                                                                                                                   Net shares held for 3 years
                                                   Incentive Plan                performance period

                                                                                                                            100% delivered in shares [A]

                                                   Performance period followed by a 3-year holding period that remains in force post-leaving

                                                 Executive Directors’ shareholding
                                                 % of base salary

     3 year bonus and                             CEO, Ben van Beurden
                                                                                                                                              Value of shares counting towards
     LTIP holding periods                                                                                                                     guideline at December 31, 2018
                                                         CFO, Jessica Uhl
                                                                                                                                              Shareholding guideline

                                                                            0%   100%   200%       300%     400%     500%   600%      700%
[A] Vesting subject to performance conditions.

          Royal Dutch Shell       April 2019                                                                                                                                     19
(€ Thousands)                                                                                                   Ben van Beurden                                    Jessica Uhl [A]
Single total                                                                                                                                                                     2018                         2017                   2018                    2017
figure of                                                           Salaries                                                                                                    1,527                        1,490                     995                     796
remuneration                                                        Taxable benefits                                                                                                  32                          30                     49                      44
for Executive                                                       Total fixed remuneration                                                                                    1,559                        1,520                  1,044                      840
Directors                                                           Annual bonus [B]                                                                                            3,000                        3,000                  1,550                  1,050

                                                                    LTIP [C]                                                                                                  15,209                         4,021                  1,783                      623

                                                                                                                                                                              18,209                                                3,333
                                                                    Total variable remuneration                                                                                                              7,021                                         1,673

                                                                    Total direct remuneration                                                                                 19,768                         8,541                  4,376                  2,513

                                                                    Pension [D]                                                                                                     369                         368                    196                     287

                                                                    Tax equalisation [E]                                                                                                 -                           -                 289                     194

                                                                    Total remuneration including pension                                                                      20,138                         8,909                  4,862                  2,994

                                                                                          in dollars                                                                        $23,790                      $10,067                  $5,744                 $3,383

                                                                                          in sterling                                                                       £17,817                        £7,811                 £4,302                 £2,625

[A] Jessica Uhl was appointed as an Executive Director with effect from March 9, 2017 and her remuneration for 2017 is pro-rated accordingly. [B] The full value of the bonus, comprising both the cash and bonus delivered in shares. [C] Remuneration for
performance periods of more than one year, comprising the value of released LTIP (in respect of 2016). [D] For Ben van Beurden, the amount reported for pension consists of a net pay defined contribution amount of €369,400. The amount to be reported for his
defined benefit pension accrual is zero, calculated in accordance with UK reporting requirements. For Jessica Uhl, the amount report for pension consists of a defined contribution amount of €94,050 and a defined benefit pension accrual of €102,436.[E] Includes
tax equalisation of pension contributions to foreign pension plan(s), when they are taxable above a certain pensionable salary threshold or once double tax treaty exemption ceases, under Dutch law. Tax equalisation is applied for the loss of pension relief for
members of a foreign pension plan(s) in their host country.

          Royal Dutch Shell        April 2019                                                                                                                                                                                                                          20
Result
                                                                   Measures                                                                                 Weight (% of scorecard) Target set                            Score (0-2)
                                                                                                                                                                                                             achieved
2018
                                                                   Cash flow from operating activities ($ billion)                                                         30%                        42       53            2.00
Annual bonus                                                       Operational excellence                                                                                  50%                                               1.04

                                                                   Production (kboe/d)                                                                                     12.5%                     3,750    3,666           0.25

                                                                   LNG liquefaction volumes (mtpa)                                                                         12.5%                     33.5      34.3           1.82

                                                                   Refinery and chemical plant availability (%)                                                            12.5%                     92.1      91.9           0.90

                                                                   Project delivery on schedule (%)                                                                        6.25%                      80       75             0.75

                                                                   Project delivery on budget (%)                                                                          6.25%                     100       97             1.65

                                                                   Sustainable development                                                                                 20%                                               0.95

                                                                   Total recordable case frequency (injuries/million hours)                                                  5%                       0.7      0.9            0.00

                                                                   Operational Tier 1&2 process safety events (number)                                                       5%                      125       121            1.13
                                                                   Upstream and Integrated Gas GHG intensity (tonne CO2-equivalent per
                                                                                                                                                                             4%                      0.164    0.155           1.75
                                                                   tonne production)
                                                                                                                                        TM
                                                                   Refining GHG intensity (tonne CO2-equivalent per UEDC                     [A])                            4%                      1.05      1.05           1.00

                                                                   Chemicals GHG intensity (tonne CO2-equivalent per tonne of steam
                                                                                                                                                                             3%                      0.97      0.96           1.20
                                                                   cracker high value chemicals production)

                                                                                                                                                                          100%

                                                                   Mathematical scorecard outcome                                                                                                                            1.31

                                                                                                                                                                                                                        CEO: € 3,000,000
                                                                   Final bonus [B]
                                                                                                                                                                                                                        CFO: € 1,550,000

[A] Solomon’s Utilised Equivalent Distillation Capacity [B] Annual bonus = (base salary x target bonus % x scorecard result x individual performance factor). Rounded down to the nearest €50,000.

          Royal Dutch Shell       April 2019                                                                                                                                                                                               21
2018 HSSE                                    Goal Zero on safety                                                          Operational spills

performance                                  Injuries – TRCF [A] (per million working hours)      million working hours   Thousand tonnes                                          #

context

                                                    TRCF        TRCF Target         Working hours (RHS)                           Volume of spills        Number of spills (RHS)

                                             Upstream flaring                                                             Process safety
                                             Million tonnes CO2-equivalent                                                Number of incidents

          Overall good
          performance
          Second-best TRCF
          performance on
          record (best 2017)
                                                                                                                                   Tier 1 incidents   Tier 2 incidents

[A] Total Recordable Case Frequency.

         Royal Dutch Shell      April 2019                                                                                                                                         22
You can also read