Reporting System User Guide
←
→
Page content transcription
If your browser does not render page correctly, please read the page content below
Oregon Statewide Assessment System

               Reporting System User
                               Guide
                         For Summative and Interim Assessments

                                                                                 2021–2022

                                                                          Published October 14, 2021

                                                               Prepared by Cambium Assessment, Inc.

Descriptions of the operation of the Reporting System and related systems are property of Cambium
Assessment, Inc. (CAI) and are used with the permission of CAI.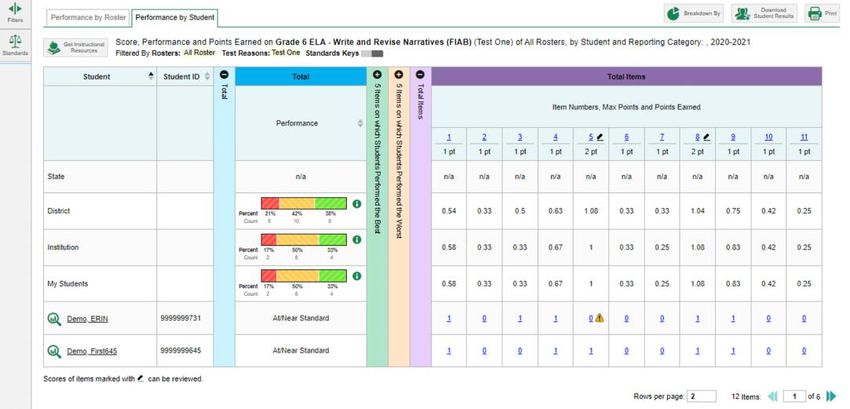
Reporting System User Guide

Table of Contents
Reporting System User Guide.................................................................................................. 1
   Introduction to the User Guide................................................................................................. 6
      Key Changes ....................................................................................................................... 6
   How to Navigate Reports for Summatives and Interims .......................................................... 7
      How to Understand Which Students Appear in Your Reports .............................................. 7
      How to View High-Level Aggregate Test Results................................................................. 7
         How to Use the Dashboard to View Aggregate Test Results ........................................... 7
         How to View More Detailed Data on a Particular Test Group ........................................... 8
      For District-Level Users: How to View Test Results for a District on a Particular Test .......... 8
         How to Access Test Results for a District ........................................................................ 8
         How to See Which Schools in the District Performed Well on This Assessment .............. 9
         How to See How Well Schools in the District Performed in Each Area of the Test ......... 10
      For Teachers, School- and District-Level Users: How to View Test Results for a
      School on a Particular Test................................................................................................ 10
         How to Access Test Results for a School ...................................................................... 10
      For Teachers and School-Level Users: How to View Student-Level Data for All Your
      Classes (Rosters) .............................................................................................................. 11
      How to View Test Results for Classes (Rosters) on a Particular Test ................................ 12
         How to Access Test Results for All Your Classes (Rosters) ........................................... 12
         How to See Which Classes (Rosters) Performed Well on This Assessment .................. 13
         How to See Which Classes (Rosters) Had the Highest Test Completion Rates ............. 13
         How to See How Well Classes (Rosters) Performed in Each Area on the Test .............. 13
         How to View and Interpret Standard Measures Within Reporting Category Sections ..................... 13
         How to View and Interpret Writing Dimension Measures ............................................... 15
         How to Access Test Results for an Individual Class (Roster) ......................................... 17
         How to See How Well Students in Your Class (Roster) Performed in Each Area of the
         Test ............................................................................................................................... 17
      How to Track Student Performance Over Time ................................................................. 18
         How to Access a Longitudinal Report Comparing Related Assessments ....................... 18
         How to View Students’ Overall Performance on These Assessments Over Time .......... 20
         How to Switch Between Score Data and Performance Level Data ................................ 20
         How to See Students’ Performance in Different Areas Over Time ................................. 20
         How to Distinguish Different Types of Tests in the Graphs ............................................ 21
         How to Modify the Test Groupings You’ve Selected ...................................................... 21

                                                                      ii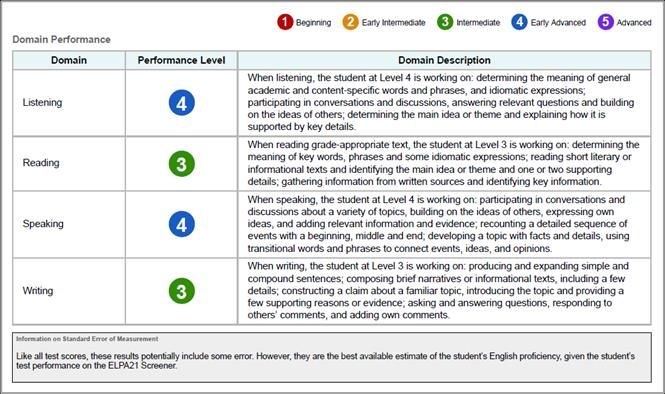
Reporting System User Guide

        How to Filter Test Opportunities to Show Some and Not Others.................................... 21
     How to View Test Results Broken Down by Demographic Sub-Groups ............................. 23
        How to View Test Results Broken Down by Demographic Sub-Groups ......................... 24
        How to View Test Results for a Particular Demographic Sub-Group or Combination ..... 25
     How to View Test Results for Individual Students .............................................................. 25
        How to Access Test Results for an Individual Student on a Particular Test ................... 26
        How to View a Report for All the Assessments a Student Has Completed Over Time ... 27
        How to Use the Student Portfolio Report to View Only the Tests You’re Interested In ... 27
        How to View a Student’s Performance on Tests Taken in a Previous School Year or
        Years............................................................................................................................. 28
     How to Use Individual Student Reports (ISR) .................................................................... 29
        What an Individual Student Report (ISR) Looks Like and How to Read It ...................... 29
        How to Generate and Export Individual Student Reports (ISR) ...................................... 31
     How to Generate and Export Student Data Files ............................................................... 34
     How to Compare Students’ Data with Data for Your State, District, School, and/or
     Total Students ................................................................................................................... 37
        How to Compare All Your Students’ Performance on Any Test with Larger Groups’ ...... 37
        How to Compare a Student’s Performance on Any of Their Tests with Larger Groups’.. 38
  How to Set Up Your Reports for Summatives and Interims So They Make Sense................. 40
     How to Filter Tests to Display ............................................................................................ 40
     For Teachers and School-Level Users: How to Filter Classes (Rosters) to Display ........... 41
     For District-Level Users: How to Filter Schools to Display ................................................. 42
     How to View Data from a Previous Point in Time ............................................................... 44
  How to Export and Print Data on Summatives and Interims .................................................. 46
     How to Export or Print a Report You’re Viewing ................................................................ 46
     How to Export an Assessment Report Directly from the Performance on Tests
     Report ............................................................................................................................... 48
  More About How to Use Interim Reports ............................................................................... 51
     How to Access Item-Level Data on Interims ...................................................................... 51
        How to View Item Scores............................................................................................... 51
        How to Find Out Which Items Students Performed on the Best or Struggled with the Most............ 52
        How to View Standards for Each Item ........................................................................... 52
        How to View an Item...................................................................................................... 53
        How to View Items with and without the Students’ Visual Settings ................................. 56
        What It Means When a Student Response Contains Highlighted Text ........................... 57
        How to Navigate to Other Items from the Item View Window ......................................... 57

                                                                    iii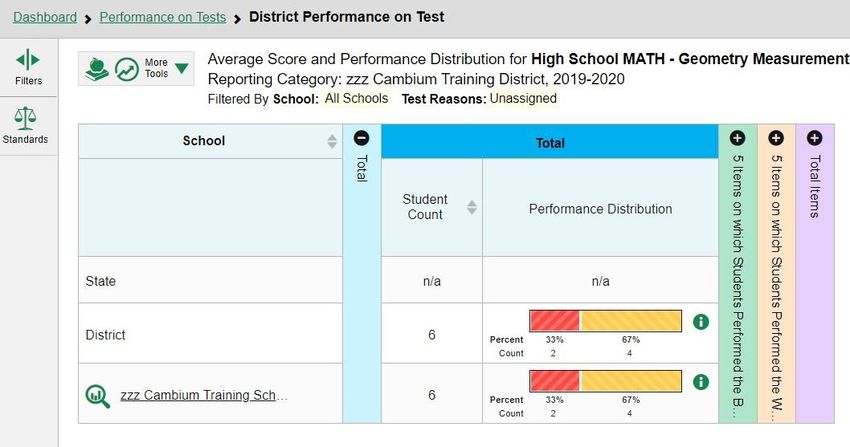
Reporting System User Guide

         How to View Another Student's Response to the Current Item ...................................... 58
         What It Means When Items Are Labeled “1-1”, “1-2”, and So On ................................... 58
         What It Means When an Item Score Reads “n/a” ........................................................... 59
     How to Score Items on Interims ......................................................................................... 59
         How to Score Unscored Items ....................................................................................... 59
         How to Modify Scores for Items ..................................................................................... 62
     How to Set Up Your Interim Reports So They Make Sense ............................................... 65
         How to Assign Test Reasons (Categories) to Interim Test Opportunities ....................... 65
         How to Filter Tests to Display ........................................................................................ 68
         How to Filter Item-Level Data by Standards and Clusters of Standards ......................... 69
  Appendix ............................................................................................................................... 72
     C ....................................................................................................................................... 72
         Class (Roster) Management .......................................................................................... 72
            How to Add a Class (Roster) .....................................................................................72
            How to Modify a Class (Roster) .................................................................................74
            How to Upload Classes (Rosters) ..............................................................................77
         Condition Codes ............................................................................................................ 81
     H ....................................................................................................................................... 83
         Help and User Support .................................................................................................. 83
            How to Access the Online User Guide .......................................................................83
            How to Get User Support...........................................................................................83
     I ......................................................................................................................................... 84
         Inbox ............................................................................................................................. 84
            How to Access and Manage Files in the Inbox ..........................................................84
            How to Use the Inbox to Send Files to Other Users’ Inboxes .....................................85
     L ........................................................................................................................................ 87
         Login Process................................................................................................................ 87
            How to Log In to the Reporting System .....................................................................87
            How to Set or Reset Your Password..........................................................................89
     M ....................................................................................................................................... 91
         Multiple Interim Test Opportunities ................................................................................ 91
     N ....................................................................................................................................... 91
         Non-Scorable Test Opportunities................................................................................... 91
     P ....................................................................................................................................... 92
         Performance Data ......................................................................................................... 92

                                                                      iv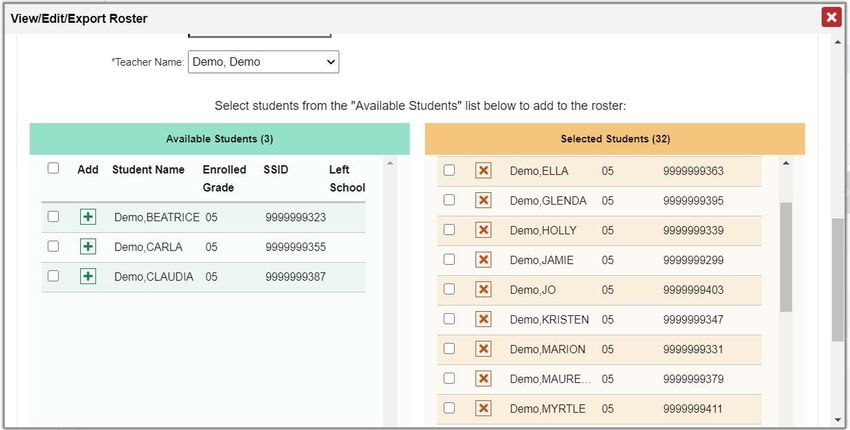
Reporting System User Guide

     R ....................................................................................................................................... 94
         Report Tables ................................................................................................................ 94
            How to Sort a Table ...................................................................................................94
            How to Specify the Number of Rows Displayed .........................................................94
            How to View Additional Table Rows ..........................................................................94
            How to View Additional Table Columns .....................................................................94
            How to Expand All Accordion Sections in a Table ......................................................94
     S ........................................................................................................................................ 95
         State-Level Features.......................................................................................................... 95
            How to Access Overall Test Results for Your State .............................................................95
            How to Access Reporting at the District Level....................................................................97
     T ........................................................................................................................................ 97
         Test Resources ............................................................................................................. 97
  Change Log .......................................................................................................................... 98

                                                                      v
Reporting System User Guide

                                                                                                       Introduction to the User Guide
Introduction to the User Guide
This user guide gives instructions on using the Reporting System for the following:

•   Accessing summative assessment data.
•   Accessing interim and benchmark assessment data.
•   Scoring interim and benchmark assessments.
It includes the following sections:

•   How to Navigate Reports for Summatives and Interims
•   How to Set Up Your Reports for Summatives and Interims So They Make Sense
•   How to Export and Print Data on Summatives and Interims
•   Appendix
The guide also includes additional information on accessing your interim data and scoring interims:

•   How to Access Item-Level Data on Interims
•   How to Score Items on Interims
•   How to Set Up Your Interim Reports So They Make Sense

Key Changes
The list below describes key changes to the document for the 2021-2022 school year.

•   Expanded document to include information on both interim and summative reporting.
•   In "How to Log in to the Reporting System" section, added step for the Terms and Conditions page
    that may appear.
•   In "User Support" section, updated the examples of OS and browser versions.
•   In "How to Access Item-Level Data", added comment about suppression of item view for some roles.

                                                    6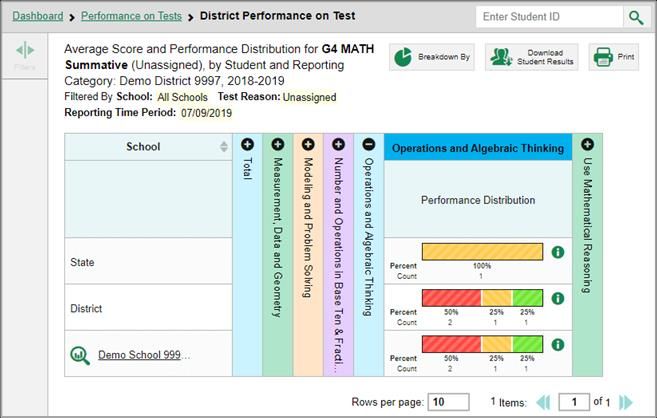
Reporting System User Guide

                                                                                                                How to Navigate Reports for Summatives and Interims
How to Navigate Reports for Summatives and Interims
This section explains how to navigate your reports for both summative and interim assessments.

How to Understand Which Students Appear in Your Reports
•   Teachers and School-level users can view data for all students in their schools who have completed
    assessments.
•   District-level users can view data for all students in their districts who have completed assessments.

How to View High-Level Aggregate Test Results
When you log in to the Reporting System, the first thing you see is the dashboard where you can view
overall test results for some or all of your test groups. From there, you can navigate to a report listing
individual tests.

How to Use the Dashboard to View Aggregate Test Results
All users except state-level users see the standard dashboard. It displays an aggregation card for each
test group. A typical test group comprises a single test type, a single subject, and all grades (for example,
the first card shown in Figure 1 is for Interim Assessment Blocks (IAB) Math).

Each aggregation card displays the test group name, a list of grades included, the number of tests taken
in the group, the date of the test last taken, and a performance distribution bar displaying both
percentages and student counts below it. You may sometimes see the message “Data cannot be
aggregated together for this group of tests” instead of the performance distribution bar for tests that do
not report performance distribution, or that use different sets of performance levels. Test group cards
are sorted by date last taken.

Clicking the  button beside the performance distribution bar displays a legend with more information
about performance levels.

                                            Figure 1. Dashboard

By default, the dashboard is filtered to display only summative assessments, unless no summatives are
available, in which case all assessments are displayed. You can change the test groups and test reasons
that appear using the Filters panel on the left. For more information on filtering, see How to Set Up Your

                                                     7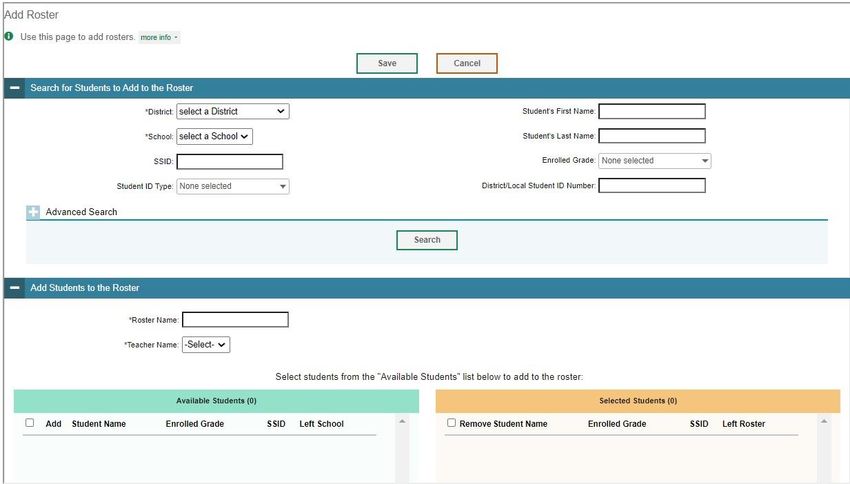
Reporting System User Guide

                                                                                                             How to Navigate Reports for Summatives and Interims
Reports for Summatives and Interims So They Make Sense and How to Set Up Your Interim Reports So
They Make Sense.
If a message appears saying “There are no assessments to display”, there may be no assessments taken
in your current reporting time period, or you may have filtered out all data.

How to View More Detailed Data on a Particular Test Group
To view more detailed data for a particular test group, click the name of the group (or      beside it).
The Performance on Tests report appears. It is filtered to display only the test group you selected.

In the Performance on Tests report, users see one table, as in Figure 2. This table lists all the
assessments in the test group.

              Figure 2. Teacher and School-Level User View: Performance on Tests Report

For each test, the assessments table shows the test group, test grade, test reason (the name of the test
window of a summative assessment, or a category assigned to an interim assessment), number of
students who took the test, average score, performance distribution, and date the test was last taken.
You can use the filters to view a different set of assessments. For more information on filtering, see How
to Set Up Your Reports for Summatives and Interims So They Make Sense and How to Set Up Your
Interim Reports So They Make Sense. If a message appears saying “There are no assessments to display”
or “There are no students to display”, there may be no assessments taken in your current reporting time
period, or you may have filtered out all data.

For District-Level Users: How to View Test Results for a District on a
Particular Test
You can view test results for a district on a particular test. This gives you a high-level view of how the
district is performing.

How to Access Test Results for a District
    From the dashboard that appears when you log in, click a test group name (or           beside it).

    Click a test name (or      beside it) in the table of assessments. The District Performance on Test
    report appears, listing schools in the district (see Figure 3).

                                                      8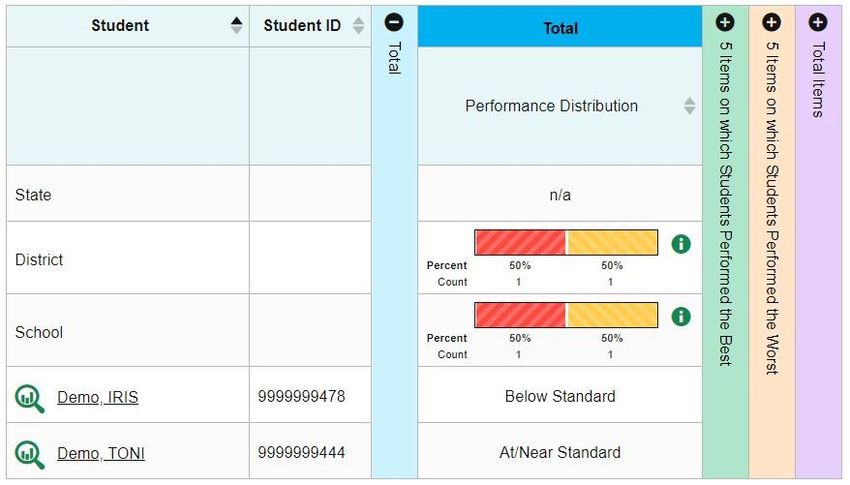
Reporting System User Guide

                                                                                                         How to Navigate Reports for Summatives and Interims
                              Figure 3. District Performance on Test Report

How to See Which Schools in the District Performed Well on This Assessment
Look at the score column and/or Performance Distribution column, and click the score column to sort by
it (as in Figure 4).

                    Figure 4. District Performance on Test Report Sorted by Score

                                                   9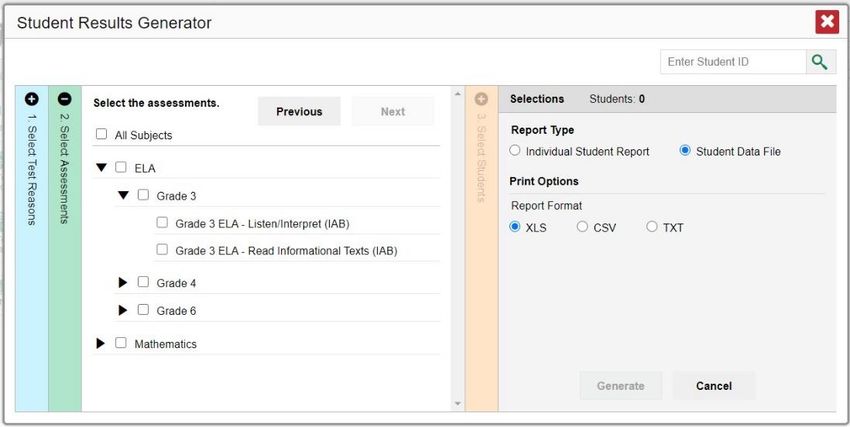
Reporting System User Guide

                                                                                                                How to Navigate Reports for Summatives and Interims
How to See How Well Schools in the District Performed in Each Area of the Test
Click the vertical section bars to expand the reporting category sections (as in Figure 5).

        Figure 5. District Performance on Test Report with Expanded Reporting Category Section

For Teachers, School- and District-Level Users: How to View Test Results
for a School on a Particular Test
You can view test results for all the students in a school on a particular test. This gives you a high-level
look at how the school is performing.

How to Access Test Results for a School
Teachers and School-level users:

    From the dashboard that appears when you log in, click a test group name (or            beside it).

    Click a test name (or      beside it) in the table of assessments. The School Performance on Test
    report appears.

District-level users:

    From the dashboard that appears when you log in, click a test group name (or            beside it).

    Click a test name (or      beside it) in the table of assessments. A table listing test results by school
    appears.

    Click the name of the school (or       beside it) for which you would like to see results. The test
    results for the school appear.

    Note that district-level users can also access the test results from a school directly from the
    Performance on Tests report, by first filtering by school.

The Performance by Roster tab is open by default, as in Figure 6.

                                                     10
Reporting System User Guide
How to Navigate Reports for Summatives and Interims
Figure 6. School Performance on Test Report: Performance by Roster Tab
For Teachers and School-Level Users: How to View Student-Level Data for
All Your Classes (Rosters)
The Performance by Student tab displays test results for each of your students across classes (rosters).
In order to see the results for all your students, follow the instructions below.
Starting from the dashboard that appears when you log in, click a test group name (or beside
it).
Click a test name (or beside it) in the assessments table at the top of the page.
In the report that appears, select the Performance by Student tab, as in Figure 7. You will see results
listing all your students. The first few rows also show aggregate performance data for your state,
district, and school.
11Reporting System User Guide
How to Navigate Reports for Summatives and Interims
Figure 7. School Performance on Test Report: Performance by Student Tab
To see which students performed best, click the Performance Distribution column to sort them.
You can view your students’ performance in each area of the test by clicking the reporting category
section bars to expand them.
How to View Test Results for Classes (Rosters) on a Particular Test
You can view a list of classes (rosters) that took a particular test, and you can also view the test results
for a particular class.
How to Access Test Results for All Your Classes (Rosters)
The Performance by Roster tab (see Figure 6) displays test results for each class (roster). To view this
tab, follow the instructions for your user role below.
Teachers and school-level users:
From the dashboard that appears when you log in, click a test group name (or beside it).
2. Click a test name (or beside it) in the table of assessments. The School Performance on Test
report appears. It is open to the Performance by Roster tab.
District-level users can view all classes (rosters) in a school. To do so, follow these instructions:
From the dashboard that appears when you log in, click a test group name (or beside it).
2. Click a test name (or beside it) in the table of assessments. A page of district test results
appears, listing schools within the district.
12Reporting System User Guide
How to Navigate Reports for Summatives and Interims
3. Click a school name (or beside it). The School Performance on Test report appears, open to the
Performance by Roster tab.
Figure 8. School Performance on Test: Performance by Roster
Tab
How to See Which Classes (Rosters) Performed Well on This Assessment
• To see which classes performed best on the test, look at the bars in the Performance Distribution
• column to see where the percentage of students at or above proficient is high.
How to See Which Classes (Rosters) Had the Highest Test Completion Rates
To see which classes had the highest test completion rate, click the Test Completion Rate column header
to sort the column.
How to See How Well Classes (Rosters) Performed in Each Area on the Test
For tests with reporting category sections, you can compare the performance of your students in each
area of the test. Click each vertical section bar to expand or collapse it.
Summative and interim tests cover multiple reporting categories, while a benchmark test covers only
one.
How to View and Interpret Standard Measures Within Reporting Category Sections
Aggregate test results for adaptive tests may include detailed performance measures within standards
within reporting categories.
An educational standard, sometimes called an assessment target, describes the skill the item measures.
Standards are nested within clusters or claims (groups of standards).
13Reporting System User Guide
How to Navigate Reports for Summatives and Interims
The Targets sub-section (shown in Figure 9) contains the following:
Claims within the reporting category.
▪ Targets within each cluster.
− Measures within each standard.
To learn more about each standard, click the more information button to the right of the standard
name.
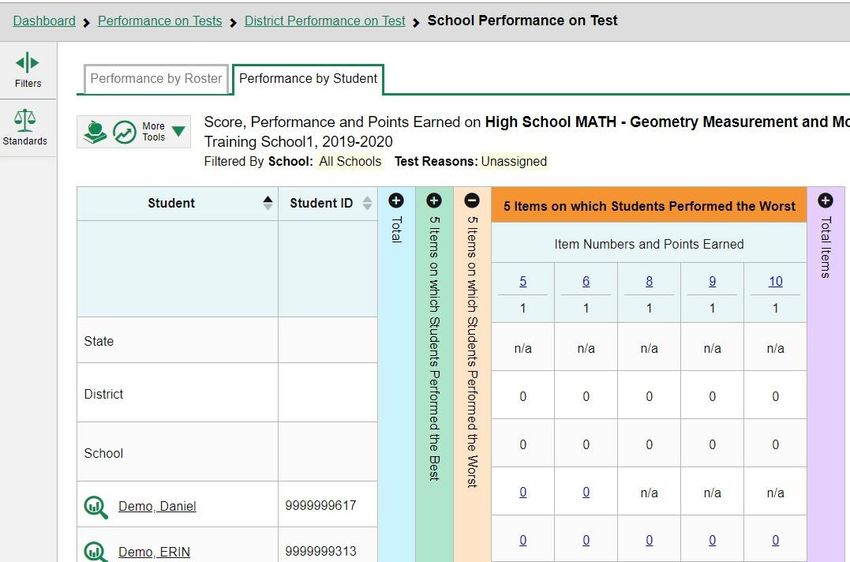
Figure 9. School Performance on Test Report: Performance by Roster Tab with Expanded Reporting
Category Section
Each target column consists of sub-columns displaying performance measures:
Weak or Strong?: You may want to identify strengths and weaknesses in different targets within the
reporting category so you can focus instruction on very specific areas where improvement is
needed. This column displays icons indicating how students’ average performance on the target
compares with their average performance on the overall test. Note that these icons indicate only
relative performance and not proficiency.
Proficient: This column displays icons indicating whether students have on average attained
proficiency in the assessment target.
Figure 10. District Performance on Test Report: Reporting Category Section
14Reporting System User Guide
How to Navigate Reports for Summatives and Interims
Each target column contains a sub-column displaying the performance measure % Correct (see Figure
10). It shows the average percentage of points students earned out of the maximum points possible in
the target. A highlighted cell with a warning icon indicates that students responded to enough items
aligned to the target to detect a statistically significant weakness. Low percentages in cells that are not
highlighted may not be statistically significant.
To learn more about these measures and the symbols they use, click the more information button to
the right of each measure.
How to View and Interpret Writing Dimension Measures
Aggregate test results for some assessments may also include a Writing Dimensions section to the right
of the expandable sections in the report table. You can expand it by clicking the vertical bar, just as with
the reporting category sections. This section helps you understand how students performed on different
aspects of writing.
The Writing Dimensions section (see Figure 11) contains the following under the Essay header:
• Essay type. For example, Informative/Explanatory, Opinion, and Narrative.
▪ Writing dimension within the essay type, as listed in item rubrics. For example, Purpose,
Focus, and Organization; Evidence and Elaboration; and Conventions of Standard English.
− Point value. A sub-column for each possible item point value for the writing dimension.
Each point value sub-column displays the percentage of students who earned that
number of points.
For each dimension, the lowest and highest point values are sometimes highlighted
and marked with arrow icons in the rows with the highest percentages. This allows you to
quickly identify groups of students who are performing well and those who may need
additional support.
Note that highlighting and arrow icons do not appear where they are not useful. A report
containing only one row of data does not have them, and neither does a row in which the
percentages are “n/a” or are all the same.
15Reporting System User Guide
How to Navigate Reports for Summatives and Interims
Figure 11. District Performance on Test Report with Expanded Writing Dimensions Section
To learn about the highlighting and arrow icons, click the more information button in the Essay
header. A legend expands, as in Figure 12.
Figure 12. District Performance on Test Report with Expanded Legend
16Reporting System User Guide
How to Navigate Reports for Summatives and Interims
How to Access Test Results for an Individual Class (Roster)
Prior sections explained how to access test results for all your classes (rosters). To view results for one
specific class, click the name of a class that appears in the first column of the report (or beside it).
The class results listed by student appear (see Figure 13).
Figure 13. Roster Performance on Test Report
How to See How Well Students in Your Class (Roster) Performed in Each Area of the
Test
You can compare the performance of your students in each area of the test using the reporting category
sections, as shown in Figure 14. Click the vertical section bar to expand each section.
Figure 14. Roster Performance on Test Report with Expanded Reporting Category Section
17Reporting System User Guide
How to Navigate Reports for Summatives and Interims
How to Track Student Performance Over Time
You can view your students’ performance over time across multiple related assessments or across
multiple test opportunities of a single assessment. This lets you see how students’ performance has
improved or declined.
Each Longitudinal Report displays performance data for one of the following:
• A group of students who have completed every assessment available in the report. Note that a
certain percentage of students must have taken all the related assessments in order for you to
generate a Longitudinal Report.
• An individual student (see Figure 15).
Figure 15. Longitudinal Report Window: Report for a Single Student with a Single Reporting Category
How to Access a Longitudinal Report Comparing Related Assessments
If the student(s) in your test results have completed multiple related assessments, the Build
Longitudinal Reports button allows you to access a Longitudinal Report for any of those
assessments. If they haven’t done so, then no Longitudinal Report is available.
• Above a table of test results, click the Build Longitudinal Reports button in the upper-left
corner, either directly on the page or within a More Tools menu (see Figure 16), depending on
whether additional instructional resources are available.
18Reporting System User Guide
How to Navigate Reports for Summatives and Interims
Figure 16. Student Performance on Test Report
The Longitudinal Report window appears. Depending on your role, the test types, and the number
of students in the report, it may display a report options page rather than the Longitudinal Report
itself. The contents of this page depend on your role and the number of students.
If you are viewing a Longitudinal Report for which both interims and summatives are available,
the Progression drop-down list (see Figure 17) appears. Use it to select which test types to view
in the Longitudinal Report: summative, interim, or a combination. This drop-down list does not
appear when only one test type is available.
Figure 17. District-Level User View: Longitudinal Report Window: Report Options Page with Progression
Drop-Down List Only
▪ If you’re viewing report options, click Generate Report at the top of the window to view the
Longitudinal Report. (You can modify your selections and regenerate the report later using
the Change Selections button .)
19Reporting System User Guide
How to Navigate Reports for Summatives and Interims
How to View Students’ Overall Performance on These Assessments Over Time
Look at the graph in the upper-left corner of the Longitudinal Report (see Figure 15). It shows the scores
or performance levels of the student(s) each time they took the test(s). Score data are plotted along a
line.
Performance level data are shown either the same way or, for multiple students, in performance
distribution bars.
Mouse over the data points in a line graph or the sections in a bar to get more information.
Alternatively, in the table at the bottom of the report, look at the Overall section.
How to Switch Between Score Data and Performance Level Data
When a graph offers both score and performance level data, a toggle bar appears at the top of it, as in
Figure 18. Click the toggle to switch. You may want to do this if you find performance level data easier to
read, or if you prefer the precision of score data. Sometimes a test includes only one type of data.
Figure 18. Longitudinal Report Window: Report for Multiple Students with Multiple Reporting Categories
How to See Students’ Performance in Different Areas Over Time
Look at the reporting category graphs to the right of the overall performance graph, or look at the
expandable reporting category sections in the table at the bottom (see Figure 18). Here, you can see at a
glance how students are improving or declining in each area, and you can compare their trajectories in
different areas.
20Reporting System User Guide
How to Navigate Reports for Summatives and Interims
How to Distinguish Different Types of Tests in the Graphs
A symbol appears on each data point. When multiple test types are present, refer to the legend
immediately below the graphs (see Figure 19) to find out which symbols correspond to which types.
How to Modify the Test Groupings You’ve Selected
If you generated the report from the report options page, click the Change Selections button in the
upper-right corner of the window. The report options page reappears, allowing you to change your
selection of test type or types and, if you are a teacher viewing multiple students, your selection of tests
and test reasons as well.
Alternatively, if your report contains multiple test types, click the test type toggles in the legend
immediately below the graphs (see Figure 19) to hide and show data for each one. Note that these
toggles do not affect report printouts or exports.
Figure 19. Longitudinal Report Window: Summative & Interim Report for Multiple Students with Multiple
Reporting Categories
How to Filter Test Opportunities to Show Some and Not Others
You may want to filter a Longitudinal Report in order to focus on some test opportunities and not
others.
Note that filtering tests may affect the set of students whose data are included in the report.
21Reporting System User Guide
How to Navigate Reports for Summatives and Interims
1. Open the Filters menu at the upper-right corner and select the filter options you prefer from
the drop-down lists (see Figure 20 and Figure 21).
Figure 20. Longitudinal Report Window: Report for a Single Student with a Single Reporting Category and
with Expanded Filter Menu
Figure 21. Longitudinal Report Window: Summative Report for a Single Student with Multiple Reporting
Categories and with Expanded Filter Menu
22Reporting System User Guide
How to Navigate Reports for Summatives and Interims
▪ You may want to filter by a particular school year or years. Note that years are not calendar
years. “2020” refers to the 2020–2021 school year. By default, Longitudinal Reports show data
for all years.
Longitudinal Reports can show student performance from a time when the students were not
yet associated with you. For example, if you are a seventh-grade teacher, you can use these
reports to view your current students’ performance on last year’s sixth-grade tests.
▪ If the report includes interim assessments, you may wish to filter by a test reason (a category
of test), which means excluding all other test reasons from the data. For example, you may
want to narrow the report down to show only tests taken in the spring. For summative
assessments, test reasons are the same as test windows and are not useful.
▪ Finally, you may find that certain individual tests are less relevant than others. In that case,
you can use the Test Label options to deselect the names of the tests you don’t want to see.
2. Click Apply.
3. Optional: To revert all filters to their defaults, open the Filters menu again and click Clear
Filters. Click Apply.
A row of filter details appears below the report header, as in Figure 20 and Figure 21, showing the test
reasons and school years included in the report.
How to View Test Results Broken Down by Demographic Sub-Groups
You can use the Breakdown By button at the upper-right corner of an assessment report (see
Figure 22) to compare performance between different demographic sub-groups. This button is available
for most aggregate test results.
Figure 22. School Performance on Test Report: Performance by Roster Tab
23Reporting System User Guide
How to Navigate Reports for Summatives and Interims
How to View Test Results Broken Down by Demographic Sub-Groups
To view test results broken down by demographic sub-groups, do the following:
1. Click Breakdown By at the upper-right corner (see Figure 22).
The Breakdown Attributes window opens (see Figure 23).
Figure 23. Breakdown Attributes Window
2. Select up to three student demographic categories.
There is also an Include unspecified values checkbox, explained below:
▪ Some students who complete tests do not have specific demographic information in the Test
Information Distribution Engine (TIDE). These students are considered to have unspecified
values.
▪ To include data for these students, mark the checkbox.
3. Click Apply.
Data for each sub-group selected are displayed in the report (see Figure 24).
24Reporting System User Guide
How to Navigate Reports for Summatives and Interims
Figure 24. Demographic Breakdown of a Roster Performance on Test Report
How to View Test Results for a Particular Demographic Sub-Group or Combination
When viewing test results broken down by sub-groups, go to the row for the demographic combination
you want to view and click the view button in the View Details column on the left (see Figure 24).
A window opens, displaying detailed results for that combination. The report table is now laid out the
same way as the original report, before you viewed it broken down by sub-groups (see Figure 25).
Figure 25. Demographic Combination Breakdown Window (from Roster Performance on Test Report)
At the top of the report table are filter menus for each demographic category you chose. To change the
demographic combination displayed, use the filters to select the demographic sub-groups you want to
see and click Apply. The new combination is displayed.
You can use this window to get an in-depth look at specific groups of students. For example, you may
want to determine which classes (rosters) have the highest-performing girls in the first grade.
How to View Test Results for Individual Students
You can find out how well an individual student understands the material covered on a specific
completed assessment. You can also view a report for all the assessments a student has taken.
25Reporting System User Guide
How to Navigate Reports for Summatives and Interims
How to Access Test Results for an Individual Student on a Particular Test
Teachers and school-level users:
From the dashboard that appears when you log in, click a test group name (or beside it).
Click a test name (or beside it) in the table of assessments. A page of test results appears.
Select the Performance by Student tab.
Click the name of an individual student (or beside it) in the report. The Student Performance on
Test report appears (see Figure 26).
District-level users:
From the dashboard that appears when you log in, click a test group name (or beside it).
Click a test name (or beside it) in the table of assessments. A page of test results by school
appears.
Click a school name (or beside it). The School Performance on Test report appears.
Perform the same steps as teachers and school-level users, starting at step 3.
Figure 26. Teacher and School-Level User View: Student Performance on Test Report
You can view the student’s performance in each area of the test using the reporting category sections,
which you can click to expand (see Figure 26).
26Reporting System User Guide
How to Navigate Reports for Summatives and Interims
How to View a Report for All the Assessments a Student Has Completed Over Time
The Student Portfolio Report allows you to view all the assessments an individual student has completed
over time. This is useful for viewing performance on tests that have multiple opportunities, and for
interim tests that were administered multiple times throughout the year.
To access this report, enter the student’s SSID in the search field in the upper-right corner and click
(see Figure 27). The Student Portfolio Report appears (see Figure 28).
Figure 27. Search field for Student ID
Figure 28. Student Portfolio Report
To view individual test results for this student, click a test name (or beside it).
How to Use the Student Portfolio Report to View Only the Tests You’re Interested In
You can temporarily filter which tests you want to see in the Student Portfolio Report. You may want to
do this, for example, if you are an ELA teacher and you don’t want to see a student’s math scores. By
default, the data for those math assessments appear in the report, but you can exclude them.
In the Filters panel on the left side of the Student Portfolio Report (see Figure 28), click either the
expand button or the Test Group button . The Filters panel expands (see Figure 29).
27Reporting System User Guide
How to Navigate Reports for Summatives and Interims
Figure 29. Expanded Filters Panel
Mark as many selections as you like in the Test Group section of the Filters panel. Tests are
organized by test type, subject, and grade.
Click Apply. The Student Portfolio Report updates to show only data for those tests.
Optional: To revert all filters to their defaults, open the filters panel again and click Clear Filters.
Click Apply. Filters also revert when you log out, switch user roles, or switch systems.
How to View a Student’s Performance on Tests Taken in a Previous School Year or
Years
If there are multiple years of data for a student, the Student Portfolio Report can look back at previous
years. This gives you a high-level look at the student’s progress. Student Portfolio Reports can show
student performance from a time when the students were not yet associated with you. For example, if
you are a seventh-grade teacher, you can use these reports to view a current student’s performance on
last year’s sixth-grade tests.
1. On the left side of the page, click either the Filters panel expand button or the school year
button (see Figure 28). The Filters panel expands.
Under School Year, select a year or years (see Figure 29).
Click Apply.
To switch back to the current year:
Open the Filters panel again.
Click Clear Filters.
Click Apply.
28Reporting System User Guide
How to Navigate Reports for Summatives and Interims
How to Use Individual Student Reports (ISR)
This section discusses Individual Student Reports (ISR), each of which provides easy-to-read
performance data on a particular test. If a student took tests multiple times, an ISR will be available for
each instance of a test the student took. ISRs are useful for sharing performance information with
students and their parents and guardians and may be generated in Spanish for some assessments.
What an Individual Student Report (ISR) Looks Like and How to Read It
An ISR is a PDF that displays test results for an instance of test that a student took. It may consist of a
single page or multiple pages. ISR layouts vary according to the type of test. Details of sample ISRs are
shown below in Figure 30, Figure 31, Figure 32, Figure 33, and Figure 34.
• At the top of each ISR are the student name and SSID, the name of the test, district, and school, and
any other relevant information.
• Below that is a summary of the student’s performance. An ISR for a scale-scored test displays the
student’s performance on a vertical scale that includes all the cut scores and performance levels.
• Each ISR includes a comparison table showing the average performance of the district and/or
school.
• Some ISRs include a table detailing the student’s performance in each reporting category (as in
Figure 31 and Figure 34).
• Some ISRs include item-level data (as in Figure 32), scoring assertions, and/or scoring assertion
outcomes (as in Figure 33).
• Some ISRs include longitudinal graphs (as in Figure 34).
Figure 30. Detail of Individual Student Report (ISR): Math Summative
29Reporting System User Guide
How to Navigate Reports for Summatives and Interims
Figure 31. Detail of Individual Student Report (ISR) with Reporting Categories
Figure 32. Detail of Individual Student Report (ISR): Math Interim (FIAB) with Standard-Level Data
Figure 33. Detail of Individual Student Report (ISR): Science Interim with Scoring Assertions
30Reporting System User Guide
How to Navigate Reports for Summatives and Interims
Figure 34. Detail of Individual Student Report (ISR): ELPA (Screener)
How to Generate and Export Individual Student Reports (ISR)
To generate and export an Individual Student Report (ISR) for a test opportunity (an instance of a
student taking a test), use the Student Results Generator. Each ISR shows a student’s overall
performance on their test plus a breakdown of performance by reporting category. You can select any
combination of test reasons, assessments, and students in order to generate either a single ISR or
multiple ISRs at once.
You may want to use the Student Results Generator to simultaneously print large numbers of ISRs.
ISRs can be generated from almost any Reporting page.
Click the Download Student Results button in the upper-right corner of the page (see Figure
35).
Figure 35. Download Student Results Button in Upper-Right Corner
The Student Results Generator window opens (Figure 36).
31Reporting System User Guide
How to Navigate Reports for Summatives and Interims
Depending what page you open the Student Results Generator from, the options available to you
may be prepopulated or preselected. (The filters applied to the page have no effect, however.) You
can change the selections.
Starting at the left, click the section bars to expand the sections or use the Next and Previous
buttons to navigate them. Within each section you must make selections: first test reasons, then
assessments, then students.
a. In the Select Test Reasons section (Figure 36), mark the checkbox for each test reason you want
to include in the report, or mark All Test Reasons. Test reasons are either test windows or
categories for tests.
Figure 36. Student Results Generator Window: Select Test Reasons Section
b. The Select Assessments section (Figure 37) groups tests by subject and grade. Mark the
checkboxes beside the tests or groups of tests you want to include in the report or mark All
Subjects.
Figure 37. Student Results Generator Window: Select Assessments Section
c. The Select Students section (Figure 38) contains a list of classes (rosters) (if you’re a teacher or
school-level user) or schools (if you’re a district-level user). Mark the checkboxes for the schools,
classes, and/or individual students you want to include in the ISRs.
32Reporting System User Guide
How to Navigate Reports for Summatives and Interims
− Sometimes the list of students is truncated. You can display the entire list by clicking
Click to Load More.
− Marking the checkbox for a student in one class (roster) or school also marks it
anywhere else the student appears, and the same goes for clearing the checkbox.
− To search for a particular student, enter their SSID in the field at the upper-right corner
of the window and click . The student and all their assessments and test reasons are
selected, and all your previous selections are cleared.
Figure 38. District-Level View: Student Results Generator Window: Select Students Section
The Selections section displays a count indicating the approximate total number of students for
whom ISRs will be generated.
d. Optional: To set a range of processing dates for which to generate results, use the filter menu as
follows:
i. Open the Filters menu . The menu displays two date fields, as in Figure 39.
ii. Use the calendar tools to select dates, or enter them in the format mm/dd/yyyy.
iii. Click Apply. The results are filtered to include only test opportunities processed by
Reporting in that date range. Note that processing date is not always the same as the date a
test was taken.
iv. Optional: To revert to including results for all available dates, reopen the filter menu, click
Clear Filters, then click Apply.
33Reporting System User Guide
How to Navigate Reports for Summatives and Interims
Figure 39. Student Results Generator Window: Select Students Section with Filter Menu Open
From the two Report Type options in the panel on the right, select the option for ISRs. The Selections
section shows the number of ISRs to be generated, and more options appear below (see Figure 38).
If you’re generating multiple ISRs, then under Report Format, choose either a single PDF for all the
ISRs, or a ZIP file containing a separate PDF for each one. If you select Single PDF, the Student
Results Generator may nonetheless create a ZIP file of multiple PDFs depending on the number of
schools, grades, and opportunities included.
Under PDF Type, select either a simple or a detailed PDF.
From the Language drop-down list, select a language for the ISR.
Click Generate. Once ISR generation is finished, the Inbox contains the new ISR(s) available for
download.
Note that if a student took a test multiple times with different test reasons, an ISR will be generated for
each test opportunity. If a student took a test multiple times with the same test reason, only the most
recent test opportunity will be included. You can create an ISR for another test opportunity by
navigating directly to the report for that opportunity. Past test opportunities are marked with
numbers in reports, starting with the earliest.
How to Generate and Export Student Data Files
This section discusses student data files, which are useful for analysis.
To generate and export a student data file for a student, use the Student Results Generator. You can
select any combination of test reasons, assessments, and students in order to generate and export the
files.
You can generate student data files from almost any report page.
1. Click the Download Student Results button in the upper-right corner of the page.
34Reporting System User Guide
How to Navigate Reports for Summatives and Interims
2. The Student Results Generator window opens (see Figure 40).
Depending what page you open the Student Results Generator from, the options available to you
may be prepopulated or preselected. (The filters applied to the page have no effect, however.) You
can change the selections.
3. Starting at the left, click the section bars to expand the sections or use the Next and Previous
buttons to navigate them. Within each section you must make selections: first test reasons, then
assessments, then students.
a. In the Select Test Reasons section (see Figure 40), mark the checkbox for each test reason you
want to include in the results, or mark All Test Reasons. Test reasons are categories of tests or,
for summatives, simply test windows.
Figure 40. Student Results Generator Window: Select Test Reasons Section
The expandable sections to the right are now populated with only the tests and students
available for your test reason selections.
b. The Select Assessments section (see Figure 41) groups tests by subject and grade. Mark the
checkboxes beside the tests or groups of tests you want to include in the report or mark All
Subjects.
35Reporting System User Guide
How to Navigate Reports for Summatives and Interims
Figure 41. Student Results Generator Window: Select Assessments Section
c. The Select Students section (see Figure 42) contains a list of classes (rosters) (if you’re a
teacher or school-level user) or schools (if you’re a district-level user). Mark the checkboxes
for the schools, classes, and/or individual students you want to include in the results.
− Sometimes a list of students is truncated. You can display the entire list by clicking Click
to Load More.
− Marking the checkbox for a student in one class (roster) or school also marks it
anywhere else the student appears, and the same goes for clearing the checkbox.
− To search for a particular student, enter their SSID in the field at the upper-right corner
of the window and click . The student and all their assessments and test reasons are
selected, and all your previous selections are cleared.
Figure 42. District-Level View: Student Results Generator Window: Select Students Section
The Selections section displays a count indicating the approximate total number of students for
whom student data files will be generated.
36Reporting System User Guide
How to Navigate Reports for Summatives and Interims
d. Optional: To set a range of processing dates for which to generate results, use the filter
menu as follows:
i. Open the Filters menu (see Figure 39). The menu displays two date fields.
ii. Use the calendar tools to select dates, or enter them in the format mm/dd/yyyy.
iii. Click Apply. The results are filtered to include only test opportunities processed by
Reporting in that date range. Note that processing date is not always the same as the
date a test was taken.
iv. Optional: To revert to including results for all available dates, reopen the filter menu,
click Clear Filters, then click Apply.
4. From the two Report Type options in the panel on the right (see Figure 42), select Student Data File.
More options appear below.
5. Under Report Format, select XLS (Excel .xlsx), CSV (comma-separated values), or TXT (tab-delimited
text).
6. Under Output, select either Data File for Each Test or Single Combined Data File. Note that a single
combined data file does not include reporting categories. Large files may be split by school.
7. Click Generate. Once data file generation is finished, the Inbox contains the new student data file(s)
available for download.
Note that if a student took a test multiple times, the files will include each test opportunity.
How to Compare Students’ Data with Data for Your State, District, School,
and/or Total Students
In the Performance on Tests report and the Student Portfolio Report, you can access performance data
for your state, district, school, and/or total students.
How to Compare All Your Students’ Performance on Any Test with Larger Groups’
In the Performance on Tests report, click to the right of a test name.
Rows containing data for the state, district, and/or school appear below, as in Figure 43.
37Reporting System User Guide
How to Navigate Reports for Summatives and Interims
Figure 43. Performance on Tests Report with Expanded Comparison Rows
To hide the comparison rows, click to the right of the test name.
How to Compare a Student’s Performance on Any of Their Tests with Larger Groups’
In the Student Portfolio Report, you can compare a student’s performance on any test with that of your
state, district, school, and/or total students.
1. Enter the student's SSID in the search field in the upper-right corner and click (see Figure 27).
The Student Portfolio Report appears.
2. Click to the right of a test name (see Figure 44).
Figure 44. Student Portfolio Report
38Reporting System User Guide
How to Navigate Reports for Summatives and Interims
Rows containing data for your state, district, school, and/or total students appear below, as in Figure 45.
Figure 45. Student Portfolio Report with Expanded Comparison Rows
To hide the comparison rows, click to the right of the test name.
39You can also read