Request by Svenska kraftnät for a derogation from the minimum level of capacity to be made available for crosszonal trade for 2021
←
→
Page content transcription
If your browser does not render page correctly, please read the page content below

SVENSKA
                                         KRAFTNÄT
                                         SWEDISH NATIONAL GRID

                            2020-07-01                              Svk 2020/1259

                            Request by Svenska kraftnät
                            for a derogation from the
                            minimum level of capacity to
                            be made available for cross-
                            zonal trade for 2021
                            In accordance with Article 16(9) of Regulation (EU)
                            2019/943 of the European Parliament and of the
                            Council of 5 June 2019 on the internal market for
                            electricity

                            TILLSTYRKT                           SAMRÄD
SvKIOOO. v5.0. 2018-08-01
2 (29)

Contents

The grounds for requesting a derogation ................................................................... 3

Svenska kraftnät submits the following request for a derogation ............................. 5

Article 1. Subject matter and scope ............................................................................ 5
Article 2. Definitions and interpretations.................................................................. 5
Article 3. The West Coast Corridor ............................................................................ 6
Article 4. Lack of supply of downregulation volumes .............................................. 7
Article 5. Coordinated capacity allocation not implemented .................................. 9
Article 6. Methodology and projects to reach CEP 70% ......................................... 10
Article 7. Extent and duration of derogation ........................................................... 11
Article 8. Language .................................................................................................... 11
Article 9. Confidentiality ............................................................................................ 11

Annex A – Data presentation and analysis of the of day ahead, capacity
allocation and special regulation market in the Nordics ......................................... 12

Annex B – Historical capacities on the borders effected by the congestion in the
West Coast Corridor .................................................................................................. 17
3 (29)

The grounds for requesting a derogation
Regulatory background
Article 16(8) of Regulation (EU) 2019/943 of the European Parliament and of the
Council of 5 June 2019 on the internal market for electricity (hereinafter
“Regulation 2019/943”), prescribes that TSOs shall not limit the volume of
interconnection capacity to be made available to market participants as a means of
solving congestion inside their own bidding zone, or as a means of managing flows
resulting from transactions internal to bidding zones.

Article 16(8) also defines that this requirement is complied with if a minimum level
of available capacity for cross-zonal trade is reached. This level, hereinafter
referred to as the “CEP 70% requirement”, is set to 70% of the capacity of internal
and cross-zonal critical network elements respecting operational security limits
(hereinafter “CNEs”) considering contingencies (hereinafter referred to as
“CNECs”).

Article 16(4) of Regulation 2019/943 prescribes that counter-trading and
redispatch, including cross-border redispatch, shall be used to reach the CEP 70%
requirement. Article 16(4) stipulates that the application of cross-border measures
is subject to the implementation of a redispatching and counter-trading cost
sharing methodology.

The CEP 70% requirement to make available minimum cross-zonal capacity is
applicable as of 1 January 2020. Transitory measures, i.e. action plans pursuant to
Article 15 of Regulation 2019/943 or derogations pursuant to Article 16(9) of the
same regulation, allow for this minimum capacity to be reached in a progressive
way.

Article 16(8) of Regulation 2019/943 prescribes that the CEP 70% requirement
entails respecting operational security limits on CNE as well as considering
contingencies. Article 16(9) prescribes that relevant regulatory authorities may
grant a derogation from paragraph 8 of article 16 where it is necessary on
foreseeable grounds for maintaining operational security. The extent of such a
derogation shall be strictly limited to what is necessary and to maintain operational
security, avoid discrimination between internal and cross-zonal exchanges and not
extend to more than one year at a time.
4 (29)
The Member State with identified structural congestion shall, in cooperation with
its transmission system operators, decide within six months of receipt of the report;
either to establish national or multinational action plans pursuant to
Article 15 Regulation 2019/943,
Alternatively in the bidding zone review pursuant this Article 14(7) or by
one or more transmission system operators in their control areas in a
report approved by the competent regulatory authority.
Article 15 of Regulation 2019/943 prescribes that following the adoption of a
decision pursuant to Article 14(7), the Member State with identified structural
congestion shall develop an action plan in cooperation with its regulatory authority.
That action plan shall contain a concrete timetable for adopting measures to reduce
the structural congestions. Irrespective of the concrete progress of the action plan,
Member States shall ensure that without prejudice to derogations granted under
Article 16(9) or deviations under Article 16(3), the cross-zonal trade capacity is
increased on an annual basis until the minimum capacity provided for in Article
16(8) is reached.
The above provision also requires that minimum capacity compliant with Article
16(8) shall be reached by 31 December 2025, and that those annual increases shall
be achieved by means of a linear trajectory.
Article 15 stipulates that it is for the Member State to decide on the establishment
and implementation of the action plan. The Swedish authorities have considered
this option. The conclusion was that Svenska kraftnät is to request a Derogation
following the reason stated in Article 1.
If the requested derogation is granted Svenska kraftnät shall develop and publish a
methodology and projects that shall provide a long-term solution to the issue that
the derogation seeks to address. In Article 6. of this derogation request Svenska
kraftnät describes a few of the measures included in the methodology and projects
which will deliver a long-term solution to the issue.
Request for derogation is compliant with the relevant rules
Svenska kraftnät submits that the request for derogation is compliant with
Regulation 2019/943, more specifically Article 16(9). In this connection, Svenska
kraftnät notes the following:
The request for a derogation is based on grounds that are foreseeable.
The derogation is requested in order to maintain operational security.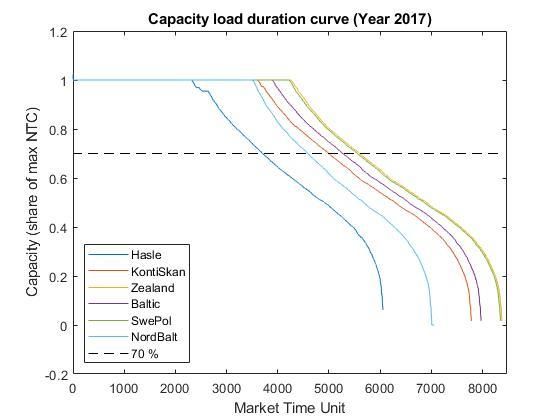
5 (29)
The extent of the requested derogation is strictly limited to what is
necessary.
The derogation avoids undue discrimination between internal and cross-
zonal exchanges as Svenska kraftnät will maintain the available capacity
above the CEP 70% requirement for as much of the time as possible.
Svenska kraftnät submits the following
request for a derogation
Article 1. Subject matter and scope
This request for derogation on the implementation of the minimum margin
available for cross-zonal trade is submitted by Svenska kraftnät in accordance with
Article 16(9) of the Regulation 2019/943.
The request is based on foreseeable reasons to deviate from the CEP 70%
requirement:
The lack of downregulation volumes makes Svenska kraftnät unable to
meet the CEP 70% requirement in 2021 without endangering operational
security in a N-1 situation, cf. Article 4.
o Congestion in the West Coast Corridor, inside bidding zone SE3, in
combination with the lack of available downregulation implies a
need to reduce capacity on six different interconnectors: SE3-NO1,
DK1-SE3, DK2-SE4, DE-SE4, PL -SE4 and LT-SE4, cf. Article 3.
Svenska kraftnät commits to limiting the use of the derogation as much as possible.
The minimum margin available for cross-zonal trade, as defined by the CEP 70%
requirement, will be achieved to the maximum possible extent as long as
operational security is guaranteed.
Svenska kraftnät also commits to report all deviations from CEP 70% requirement
to the Swedish NRA along with a justification why the deviation was required to
guarantee operational security.
Svenska kraftnät also commits to develop and publish a methodology and projects
that provide a long-term solution to the issue for which the derogation is requested.
Article 2. Definitions and interpretations
For the purpose of this request for derogation, the terms used in this document
shall have the meaning of the definitions included in Article 2 of Regulation
2019/943, Article 2 of commission regulation (EU) 2015/1222 of 24 July 2015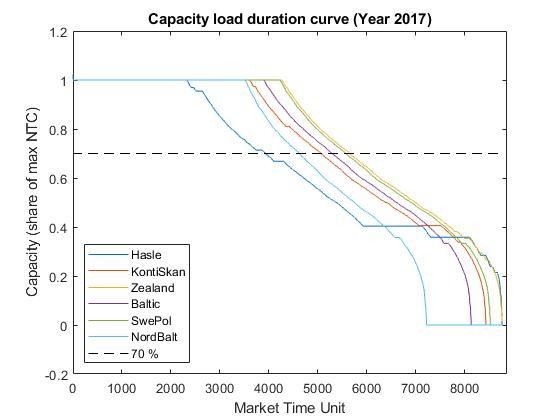
6 (29)
establishing a guideline on capacity allocation and congestion management (CACM
Regulation), Article 2 of the ACER Recommendation No 01/2019.
In this request for derogation, unless the context requires otherwise:
The table of contents, headings and examples are inserted for convenience
only and do not affect the interpretation of this derogation request.
Any reference to legislation, regulations, directive, order, instrument, code
or any other enactment shall include any modification, extension or re-
enactment of it then in force.
Article 3. The West Coast Corridor
The West Coast Corridor is a cross-section in the Swedish transmission network
located within bidding zone SE3. It cuts through the 400 kV transmission lines
between Strömma and Kilanda and between Horred and Kilanda in western
Sweden near Gothenburg. The West Coast Corridor is one of four identified
bottlenecks in the Swedish transmission network. The others cuts constitute
bidding zone borders between Sweden’s internal bidding zones. The West Coast
Corridor is different from the other three as it cuts through two transmission lines
near the Swedish West Coast and does not cut through the country from the
eastern border to the western border.
The congestion problem at the West Coast Corridor occurs in hours with a
northbound flow in the Swedish transmission system. For the problem to arise, the
northbound flow from SE4, DK1, DK2, DE-LU, PL and LT, through the West Coast
Corridor must exceed its maximum capacity of about 2,300 MW. These hours are
generally characterised by a combination of four factors described in the following
subsections.
1. General reduction in demand relative to steady state load, for
example during nights and weekends
As the load decreases the power flows in the system changes. In the area close to
the West Coast Corridor local load and generation are at an equilibrium during the
day. As local load decreases local generation generally holds its output level and
thus a new the equilibrium with increased flow is arises.
2. High wind in-feed, especially in Denmark, Germany and
Southern Sweden
Wind in-feed located south of the West Coast Corridor pushes power through the
Corridor. The normal south bound flow is replaced by northbound flow.
3. Subsequent production reduction in the hydro plants in Norway
As the flexible hydro plants decrease generation it generates a flow from south to
north to meet the load in Norway.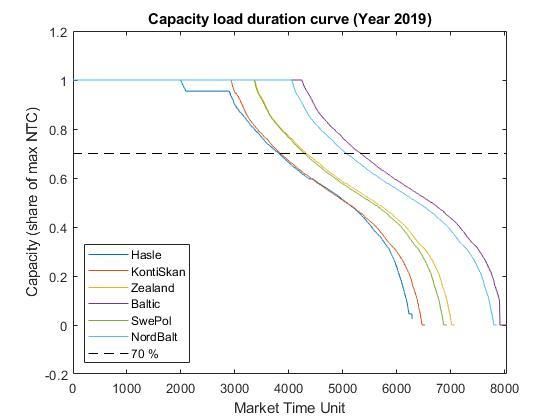
7 (29)
4. Continued nuclear generation at the same level
First and foremost the Ringhals nuclear power plant located on the Swedish West
Coast maintains its generation output. Other nuclear power plants in Sweden do
the same as these are also relatively inflexible. Their output contributes to the
northbound flow.
Current operational security management routines and impact
Currently Svenska kraftnät is constrained to maintain the operational security in
the system in certain situations by restricting the capacity made available to the
market on the six interconnectors in Southern Sweden (SE3 and SE4): SE3-NO1,
DK1-SE3, DK2-SE4, DE-SE4, PL -SE4 and LT-SE4. A lower import capacity
reduces the flow of power from interconnected countries into Southern Sweden. A
lower export capacity, on SE3NO1, reduces the transit of the imported power
going via the West Coast Corridor to Norway.
Restrictions are only necessary to ensure that operational security can be
maintained. If sufficient downregulation volumes would have been available,
counter trade could be utilised in line with Article 16(4) of Regulation 2019/943. In
Article 4. the lack of downregulation resources, and its relation to the congestions,
is further elaborated on.
In Annex B the historical situation is described. The analysis in Annex B shows that
historically, 2016-2019, the average capacity made available to the market on the
relevant interconnectors is 67 % or higher considering all hours. There are however
hours were zero MW is made available on the interconnectors.
West Coast Corridor as a bidding zone border
The properties of the West Coast Corridor, described previously in this article, are
not ideal for creating a specific biding zone where it constitutes a border. A small
bidding zone dedicated for just the West Coast Corridor would encompass small
loads and virtually no generation. The resulting small bidding zone would often
only be an extension of the adjacent bidding zones, not being able to function on its
own.
Reconfiguring the Swedish bidding zones in a way that the West Coast Corridor
would constitute a border is not feasible. A transmission line between Skogssäter to
Stenkullen that elevates the congestion is planned to be in operation from 2023,
see Article 6. The bidding zone would only be relevant until this time. There is
currently an ongoing biding zone review in Sweden and ACER will provide its
decision on the biding zone methodology in October of 2020.
Article 4. Lack of supply of downregulation volumes
The foreseeable ground to request a derogation is a lack of sufficient
downregulation volumes that would enable Svenska kraftnät to meet the CEP 70%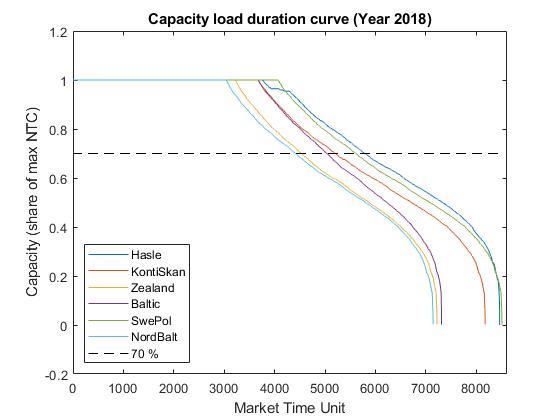
8 (29)

requirement from 2021 without endangering operational security in a N-1
situation.

These situations occur due to the structural congestion described in Article 3.
Svenska kraftnät would implement extensive use of remedial actions to solve the
congestion, in accordance with Article 16(4) of Regulation 2019/943, if this was
possible.

The lack of downregulations volumes has constrained Svenska kraftnät to reduce
interconnector capacity to ensure operational security in relation to the West Coast
Corridor certain situations, described in Article 3.

This measure used to ensure that operational security limits are not violated in the
event of a contingency. As well as ensuring that the power system can be restored
to a state of operational security. The measure is required in order for Svenska
kraftnät to adhere to the requirements according to paragraph 4, chapter 5 of the
targets for operational security established according to §1.a. of chapter 8 in the
Swedish Electricity Act. When the need arises to reduce capacity encompasses six
different interconnectors: SE3-NO1, DK1-SE3, DK2-SE4, DE-SE4, PL-SE4 and LT-
SE4.

In situations where the West Coast Corridor is fully utilized, in general a volume of
between 1 200 MW and 1 500 MW of downregulation resources would be required
after a contingency to maintain operational security in line with the targets for
operational security. The downregulations volumes need to be present south of the
West Coast Corridor, in DK1, DK2 or SE4. It would also require corresponding
upregulation volumes north of the West Coast Corridor; generally in Norway.

The 1 500 and 1 200 MW volumes mentioned above are theoretical. This needs to
be taken into account in operational planning and capacity calculation as the
required amount of downregulation to mitigate an overload. The actual
downregulation volume available are not know until 45 minutes before the
operational hour. Therefore, downregulation volumes are predicted which is
associated with a risk level in the capacity calculation. The corresponding
upregulation is also assessed in the capacity calculation. The availability of
upregulation in Norway is not associated with the same risk level.

To depict the situation the special regulation market, through which counter trade
is procured in the Nordic market design, has been analysed. The analysis also
includes historic day ahead results and capacity allocation including limitations on
interconnectors. In Annex A an in depth analysis of the situation of
downregulation, and upregulation, in regards to the West Coast Corridor is
presented.
9 (29)

During 2019 less than 1 500 MW of downregulation was available for a total of
4661 hours. Considering more favourable conditions there were 3 248 hours where
less than 1 200 MW was available. Taking the history of the day head market,
capacity allocation and interconnector limitation into account the results of the
analysis show multiple occasions during 2019 where operational security targets
cannot be met. For additional results of the analysis see Annex A.

In conclusion: Based on the analysis of the results from the analysis of available
downregulation resources it is still Svenska kraftnät´s position that, in order to
ensure operational security, situations may still occur where Svenska kraftnät´s
only available tool is to reduce capacity on interconnectors to less than 70 % of
maximum NTC. The current practice is that this involves six different
interconnectors: SE3-NO1, DK1-SE3, DK2-SE4, DE-SE4, PL-SE4 and LT-SE4.
Investigations are underway to see if this can be optimized and which new tools can
be develop as well as their impact on reaching CEP 70% , this is elaborated more on
in Article 6.

Article 5. Coordinated capacity allocation not
    implemented
Svenska kraftnät will continue to utilize the NTC approach for capacity calculation
until the capacity calculation methodology according to article 20 if CACM
entailing a flow-based approach for the Nordic Capacity Calculation Region is
implemented. The implementation is planned to be finalized at the end of 2021 or
the beginning of 2022. The level of capacity made available to the market when
utilising NTC is not explicitly defined in CEP 70%.

Svenska kraftnät submits that until the method utilising a flow-based approach is
implemented, regulatory authorities and ACER should recognize that, in some
cases, the high uncertainties related to forecast cross-zonal exchanges outside
coordination areas may impede Svenska kraftnät’s ability to reach the CEP 70%
requirement. In such cases, the temporary relaxation of the CEP 70% requirement
through a derogation is an appropriate instrument.

Structural congestions have been identified by analysing historical capacities
supplied to the power exchange, NordPool, for the six interconnectors in question
during the period of 2016 to 2018. These capacities where compiled utilising the
net transmission capacity method. To efficiently and precisely determine the
capacity in relation to the requirement in Article 16(8) of Regulation 2019/943 the
network needs to be analysed in flow-based representation as described in the
recommendation no 01/2019 of the European Union Agency for the Cooperation of
Energy Regulators of 8 august 2019.

During the period of the derogation Svenska kraftnät will gather data compiled in
the external parallel run of the Flow-based approach capacity calculation presiding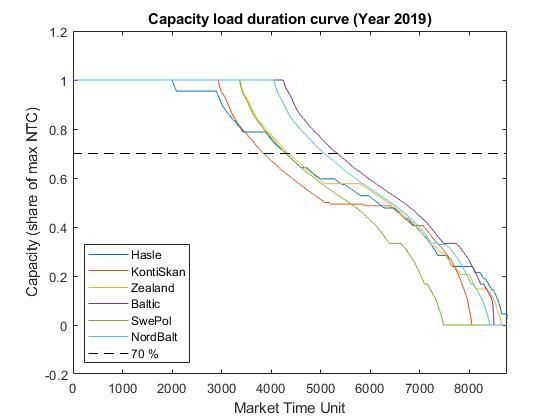
10 (29)

its implementation. From this data Svenska kraftnät will precisely determine which
network elements do not fulfil CEP 70% requirement. This data will additionally be
utilised to improve and fine-tune the envisioned measures described in brief in
Article 6. , and potentially to define the starting point in an action plan according to
article 15 of Regulation 2019/943.

Article 6. Methodology and projects to reach CEP 70%
The structural problem will be alleviated with the decommissioning of the reactors
Ringhals 1 and 2, in 2021 and 2020 respectively. With Ringhals nuclear power
plant being located just south of the West Coast Corridor, this will reduce the need
for capacity reductions on the six interconnectors in 2021 compared to the historic
situation.

The structural problem is expected to be resolved from 2023 and onwards. Svenska
kraftnät has committed to invest in a new transmission line from Skogssäter to
Stenkullen. It will supplement the two North-South lines at the West Coast
Corridor, and it will, according to simulations done by Svenska kraftnät, greatly
reduce the congestion problem in the West Coast Corridor. Thereby, it will also
eliminate the need for capacity reductions on the six interconnectors significantly.

However, Svenska kraftnät is considering several measures that will result in
optimized capacity allocation with less capacity restrictions on the interconnectors
and increased use of downregulation bids.

Some of the measures are aiming at adjusting the assumptions, which are used as
the basis for the capacities allocated in relation to the West Coast Corridor. Since
June 2019, Svenska kraftnät has gradually released more day-ahead capacities on
the interconnectors and handle within the day imbalances through downregulation.
Svenska kraftnät will continue to search for further optimisations and supplement
with other measures that are aimed at developing the supply of downregulation in
especially SE3, SE4 and DK2. For example through more comprehensive and
targeted communication to the market participants about the opportunities.

The work in this area have already delivered progress in terms of available capacity
on the interconnectors. Considering the DK2-SE4 interconnector the average
allocated capacity was 1 000 MW (approximately 58% of the max NTC capacity)
from 1 January 2019 to 31 May 2019. During the period 1 June 2019 to 31 October
2019, the average allocated capacity was 1 173 MW (approximately 68% of the max
NTC capacity). Svenska kraftnät expects that the work with the measures will
contribute to the fulfilment of the CEP 70% requirement.

Should the derogation be granted, Svenska kraftnät will further develop and
publish a methodology regarding the management of the issue together with a
description of additional measures.
11 (29)

Article 7. Extent and duration of derogation
This request for derogation is applicable for the duration of 2021 and to these six
interconnectors: SE3-NO1, DK1-SE3, DK2-SE4, DE-SE4, PL-SE4 and LT-SE4.

However, since the foreseeable ground that the request for a derogation is based
are reoccurring events, Svenska kraftnät may resubmit a request for derogation at
the end of the 12 month period for the next period of maximal duration allowed by
Regulation 2019/943.

Article 8. Language
The reference language for this derogation request shall be English.

Article 9. Confidentiality
The information provided by Svenska kraftnät for this derogation request does not
have to be treated as confidential unless stated or agreed otherwise.
12 (29)

Annex A – Data presentation and analysis of
the of day ahead, capacity allocation and
special regulation market in the Nordics
In this Annex an in depth analysis of the situation of downregulation and
upregulation bids in regards to the West Coast Corridor is presented. The analyses
are based on historical market behaviour during 2019. The bidding history for the
Nordic special regulation market is attained from NordPool’s website. Bids are
submitted to the Nordic TSO’s per each bidding zone. The Nordic TSO´s publish
the bids on NordPool’s website.

In situations where the West Coast Corridor is fully utilized, in general a volume of
between 1 200 MW and 1 500 MW of regulation resources would be required after
a contingency to maintain operational security in line with the targets for
operational security. These downregulation volumes need to be present south of
the West Coast Corridor, in DK1, DK2 or SE4. The corresponding upregulation is
required in the biding zones north of the West Coast Corridor; in NO1 to 5, SE2,
SE1 and FI.

In the graph below, Figure 1 and Figure 2, the total amount of downregulation and
upregulation resources available during 2019 are presented. Since available
resources are not known until 45 minutes before the operation hour Svenska
kraftnät has to base the capacity allocation on experience of available down-
regulation resources. Looking at the historical data in the figures, it is clear that it
is often the case that less than the required amount of downregulation resources
are available.
13 (29)

  MW           Downregulation bids in DK1, DK2 and SE4
  4000

  3500

  3000

  2500

  2000

  1500

  1000

   500

      0

Figure 1: Available volume of downregulation in bidding zones south of the West Coast
Corridor during 2019.

 MW            Upregulation bids in NO1-5, SE1,SE2 and FI
20000
 18000
 16000
 14000
 12000
 10000
  8000
  6000
  4000
  2000
      0

Figure 2: Available volume of upregulation in bidding zones north of the West Coast
Corridor during 2019.
14 (29)
The level of available regulation volumes is different for up- and downregulation in
the relevant biding zones. On average 10 127 MW and a minimum of 2 833 MW of
upregulation is available. For downregulation the average is 1 613 but the minimum
available volume is zero MW. The risk associated with assuming the available
amount of regulations volumes therefore differs between up- and downregulation.
This analysis will focus on the downregulations volume as these levels are close to
the required volumes, these are therefore the potential limiting factor.
1. Downregulation volumes
In Figure 3 the available downregulation resources in each bidding zone (DK1, DK2
and SE4) for each hour of 2019 are presented. Most of the downregulation
resources are available in DK1.
Volumes of downregulationbids in respecitve
MW bidding zone DK1, DK2 and SE4
3500
3000
2500
2000
1500
1000
500
0
Volume of regulation bids DK1 Volume of regulation bids DK2
Volume of regulation bids SE4
Figure 3: Volume of regulation bids in 2019 in DK1, DK2 and SE4, the vertical axis
represents power in MW and the horizontal time and date which the specific volume is
offered.
In Figure 4 remaining volumes that could be used for handling congestion
problems in the West Coast Corridor are presented. During 2019 a total of 4 661
hours there is less than 1 500 MW of available downregulation. Considering more
favourable conditions there were 3 248 hours where less than 1 200 MW was
available.15 (29)
Available downregulation bids in DK1, DK2,
MW SE4
3500
3000
2500
2000
1500
1000
500
0
Remaining bids DK1 Remaining bids DK2 Remaining bids SE4
Limit 1200 MW Limit 1500 MW
Figure 4: Available downregulation bids to solve congestion problems in the West Coast
Corridor, taking into account volumes already used for balancing and special regulation
(countertrade).
2. Interconnector capacity in combination with
downregulation volumes
In Figure 5 the occasions where it was determined that there was a lack of
downregulation resources during 2019 is presented. The graph also shows
simulated results in terms of the number of occasions where there may have been a
lack of downregulation resources if 70% of maximum NTC of interconnector
capacity had been allocated. The historic results show that there were 87 hours
where operational security targets could not be maintained and that this number
would increase to 132 hours if 70% of maximum NTC was allocated on
interconnectors for all hours. It should also be noted that on several occasions
during 2019 too optimistic assumptions in Svenska kraftnät´s current capacity
calculation method resulted in that 70% of maximum NTC or more was allocated
and where the historic results subsequently showed a lack of resources. The best
example of this is seen the 3rd of March 2019.16 (29)
Lack of downregulation bids to eliviate the West
Cost Corridor (DK1,DK2, SE4)
MW
900
800
700
600
500
400
300
200
100
0
Lack of downregulation bids (2019 Historical)
Lack of downregulation bids (2019 simulated 70% NTC)
Figure 5: Available reserves for downregulation at times of congestion in the West Coast
Corridor during 2019.17 (29)
Annex B – Historical capacities on the
borders effected by the congestion in the West
Coast Corridor
This annex contains a summary of historical capacity data for the interconnectors
effecting the West Coast Corridor significantly. The data is the same that has been
published on NordPool prior to the to the Day Ahead auctions. The summary is
comprised of three data sets to give both an overview and an in-depth description
of the historical situation.
1. Data sets
In this section the data sets used in the analysis are described. The interconnectors
with significant impact on flows through the West Cost Corridor are: NO1-SE3,
DK1-SE3, DK2-SE4, DE-SE4, PL-SE4, LT-SE4.
The historical capacity data is divided into the three sets based on how Svenska
kraftnät has categorised the capacity for each hour when it was originally
published. The categorisation is done based on any contingent limitation of
capacity. The market time unit, hours in this case, where there were limitations
were tagged when they were published. The reason code, the tag, used to describe
the limitation can be viewed on NordPool´s webpage 1. The datasets used in the
analyses include data with the following reason codes:
Dataset 1; All hours – all reason codes included
Dataset 2; Hours without outages - reason code 1010 and 1624. This shows how
much curtailment that has been done due to internal congestions.
Dataset 3; West Coast Corridor restrictions - reason code 1624.
Data set 1: all hours
In Table 1 below is the total amount of hours for dataset 1 presented. This data set
includes hours despite which reason code they are tagged with.
NO1-SE3 DK1-SE3 DK2-SE4 DE-SE4 PL-SE4 LT-SE4
Hours 2016 8784 8784 8784 8784 8784 7632
Hours 2017 8760 8760 8760 8760 8760 8760
Hours 2018 8760 8760 8760 8760 8760 8760
Hours 2019 8760 8760 8760 8760 8760 8760
Table 1: The number of hours of capacity data included in data set 1.
1https://www.nordpoolgroup.com/globalassets/download-center/day-ahead/reason-codes-and-area-location-codes_1-dec-
2015.pdf18 (29)
Data set 2: Hours without outages
Dataset 2 includes data for all hours during 2016-2019 when there were no outages
in the grid as well as the hours when there were restrictions due to congestion in
the West Coast Corridor. These hours corresponds to the hours with reason code
1010 or 1624. This shows how much curtailment that has been done due to internal
congestions. In Table 2 below is the total amount of hours for dataset 2 presented.
NO1-SE3 DK1-SE3 DK2-SE4 DE-SE4 PL-SE4 LT-SE4
Hours 2016 8381 7741 8105 8458 8236 5159
Hours 2017 6053 7780 8378 7970 8350 7055
Hours 2018 8466 8176 7221 7310 8509 7143
Hours 2019 6282 6524 7072 8042 6924 7853
Table 2: The number of hours of capacity data included in data set 2.
Data set 3: Hours with restrictions due to West Coast Corridor
Dataset 3 includes data for the hours during 2016-2019 when there were
restrictions due to congestion in the West Coast Corridor. These hours corresponds
to the hours with reason code 1624. In Table 3 below the total amount of hours for
dataset 3 is presented.
NO1-SE3 DK1-SE3 DK2-SE4 DE-SE4 PL-SE4 LT-SE4
Hours 2016 1430 1391 1228 957 830 221
Hours 2017 3379 3634 3903 3451 3533 3098
Hours 2018 4183 3951 3817 2976 3754 3592
Hours 2019 3380 3320 3618 3351 3199 3462
Table 3: The number of hours of capacity data included in data set 3.
2. Results
In this section the results of the analysis is presented with load duration graphs,
average values as well as the share of the time when the capacity was less than 70%
of Max NTC.
Capacity load duration curves for dataset 1, all hours
Below is the capacity load duration curve for all six interconnections for year 2016,
2017, 2018 and 2019 which show the capacity (share of max NTC) for all market
time units. The figures gives an illustration of how many hours each year the
capacities have been reduced and how much.2
The interconnect NordBalt SE4-LT was commissioned in February 2016 and included in the West Coast congestion
2
management in November the same year.19 (29) Figure 6. Capacity load duration curve for all six interconnections for 2016 for all market time units in dataset 1. Figure 7. Capacity load duration curve for all six interconnections for 2017 for all market time units in dataset 1.
20 (29)

Figure 8. Capacity load duration curve for all six interconnections for 2018 for all market time units in
dataset 1.

Figure 9. Capacity load duration curve for all six interconnections for 2019 for all market time units in
dataset 1.
21 (29)

Capacity load duration curve for dataset 2, hours without outages
Below is the capacity load duration curve for all six interconnections for year 2016,
2017, 2018 and 2019, which show the capacity (share of max NTC) for all market
time units.

Figure 10. Capacity load duration curve for all six interconnections for 2016 for all market time units in
dataset 2.
22 (29)

Figure 11. Capacity load duration curve for all six interconnections for 2017 for all market time units in
dataset 2.

Figure 12. Capacity load duration curve for all six interconnections for 2018 for all market time units in
dataset 2.
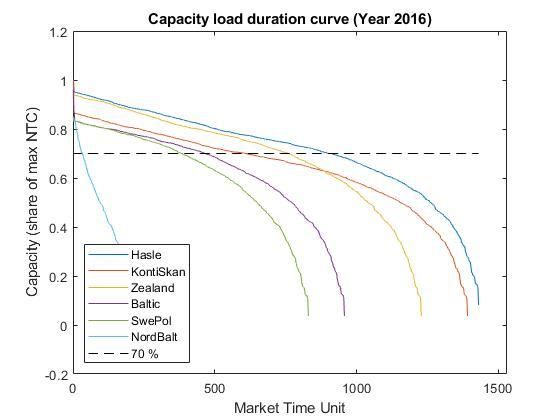
23 (29)

Figure 13. Capacity load duration curve for all six interconnections for 2019 for all market time units in
dataset 2.

Capacity load duration curve for dataset 3, restrictions due to West
Coast Corridor
Below is the capacity load duration curve for all six interconnections for year 2016,
2017, 2018 and 2019, which show the capacity (share of max NTC) for all market
time units.
24 (29)

Figure 14. Capacity load duration curve for all six interconnections for 2016 for all market time units in
dataset 3.

Figure 15. Capacity load duration curve for all six interconnections for 2017 for all market time units in
dataset 3.
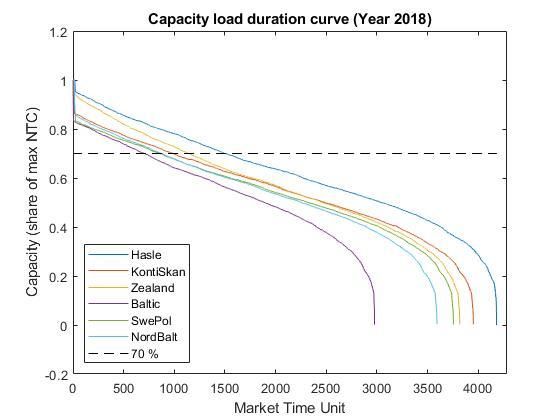
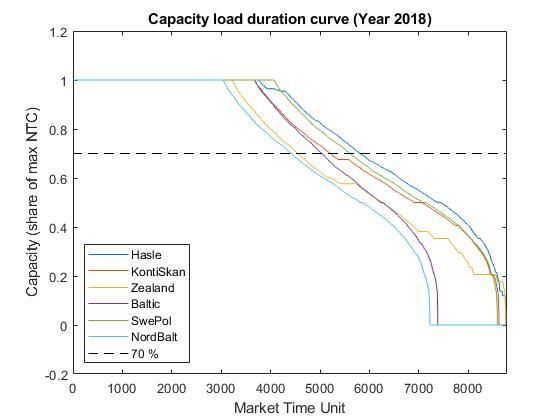
25 (29)

Figure 16. Capacity load duration curve for all six interconnections for 2018 for all market time units in
dataset 3.

Figure 17. Capacity load duration curve for all six interconnections for 2019 for all market time units in
dataset 3.
26 (29)

Average values
In the Figure 18 below the average values for dataset 1 (including all hours) are
presented.

             Average capacity of Max NTC made available by Svk to
             the market for selected bidingzone borders (all hours)
 100%
  90%          76%                       77%                       77%                    75%
                            75%                      77%
  80%                                                                        67%
  70%
  60%
  50%
  40%
  30%
  20%
  10%
   0%
           NO1-SE3 DK1-SE3 DK2-SE4                DE-SE4      PL-SE4       LT-SE4      Average

                     2016      2017      2018      2019      Average 2016-2019

Figure 18: The average capacity made available to the market for the relevant interconnector
considering all hours, dataset 1.

In the Figure 19 below the average values for dataset 2 (all hours without outages
and with restrictions due to congestion in the WCC) are presented.

                Average capacity of Max NTC made available by Svk to
                 the market for selected bidingzone borders (without
                                       outages)
 100%        82%          81%          82%          84%         83%          83%          82%
  90%
  80%
  70%
  60%
  50%
  40%
  30%
  20%
  10%
   0%
           NO1-SE3 DK1-SE3 DK2-SE4                DE-SE4      PL-SE4       LT-SE4      Average

                     2016      2017      2018      2019      Average 2016-2019

Figure 19: The average capacity made available to the market for the relevant interconnector considering
hours with no outage and limitations due to the West Cost Corridor, dataset 2.
27 (29)
In the Figure 20 below the average values for dataset 3 (all hours with restrictions
due to congestion in the WCC) are presented.
Average capacity of Max NTC made available by Svk to
the market for selected bidingzone borders (with
restrictions due to WCC)
100%
90%
62% 56% 60% 56% 56% 52% 57%
80%
70%
60%
50%
40%
30%
20%
10%
0%
NO1-SE3 DK1-SE3 DK2-SE4 DE-SE4 PL-SE4 LT-SE4 Average
2016 2017 2018 2019 Average 2016-2019
Figure 20: The average capacity made available to the market for the relevant interconnector
considering hours with limitations due to the West Coast Corridor, dataset 3.28 (29) Share of hours under 70 percentage The adoption of Regulation 2019/943 imposed a requirement for the TSO to make a minimum amount of the interconnector capacity available to the market. This minimum capacity requirement is 70%. In this section we present the result of the analysis regarding how Svenska kraftnät historically has met the requirement. The max NTC value which is used in the analysis is not equivalent to the 70%- requirement. However, this is the only comparable metric available. The results are therefore not definite, but give a good indication. In Table 4 below the share of total hours where the capacity has been
29 (29)

                      NO1-SE3       DK1-SE3      DK2-SE4       DE-SE4        PL-SE4        LT-SE4

 Share 2018                 64 %         75 %          70 %         76 %          77 %         76 %

 Share 2019                 73 %         81 %          76 %         81 %          82 %         80 %

 Share 2016-2019            57 %         69 %          60 %         68 %          70 %         80 %

Table 6. Share of total hours when the capacity has been
You can also read