Resetting FERC ROE Policy: A WINDOW OF OPPORTUNITY PREPARED BY - The ...
←
→
Page content transcription
If your browser does not render page correctly, please read the page content below
Resetting FERC ROE Policy:
A WINDOW OF OPPORTUNITY

PREPARED BY

Robert Mudge

Akarsh Sheilendranath

Frank Graves

May 2018

Notice
–––––
The views expressed in this whitepaper are strictly those of the authors and do not necessarily state or
reflect the views of The Brattle Group, Inc. or its clients. Any recipient of this whitepaper, whether in
electronic, hard copy, visual or oral form, proposing to engage in commercial activity or make
commercial decisions in relation to energy markets and/or energy prices anywhere in the world should
apply dedicated, specialist analysis to the specific legal and business challenges spanning the
activities/decisions in question. This whitepaper is not, and should not be considered as a substitute for,
such analysis.

We are grateful for the valuable contributions of Bente Villadsen and Michael Vilbert.

Copyright © 2018 The Brattle Group, Inc.
I. Introduction
–––––
A year ago, in April 2017, the D.C. Circuit Court of Appeals remanded and vacated the U.S.
Federal Energy Regulatory Commission’s (FERC) return on equity (ROE) policy for electric
transmission in Emera Me. v. FERC, 854 F.3d 9, 17 (Emera). The decision was significant for its
potential impact on electric transmission rates and investor incentives, as well as potential
relevance to oil and gas pipelines also regulated by FERC. It was noteworthy in not favoring of
any particular stakeholders, at least in the long run. Rather than suggesting any potential
resolution, the Court instead determined that FERC had departed from evidentiary standards
mandated by Section 206 of the Federal Power Act (FPA). 1 Still, the unanimous decision
upended FERC’s existing policy articulated in FERC Opinion No. 531. 2 This left uncertainty both
about the “default” policies properly applicable to near-term cases as well as long-term protocols.

Understandably, as the FERC only achieved a quorum toward the end of 2017, attention has
focused on stop-gap solutions in the absence of Opinion 531. Meanwhile, there is not yet an
announced proceeding addressing the long term. The time is ripe to consider what a new long-
term policy should look like. Mere tweaks to the old policy are not unlikely to satisfy
stakeholders, nor, more importantly, be responsive to the evolving needs for sophisticated risk
analysis and consideration of equitable ROEs for transmission or oil and gas pipelines.

Inevitably, FERC will have to formulate a policy that addresses the specific deficiencies noted in
Emera. It will also be important to reestablish guidelines for stakeholders, who in the policy
vacuum are making their own interpretations of judicial intent and past FERC policy, resulting in
increasingly divergent ROE claims. Industry groups like the Edison Electric Institute (EEI) have
weighed in on augmenting FERC’s two-step discounted cash flow (DCF) methodology, arguing
among other things that it has systematically understated the cost of capital determined by
alternative means. 3 By contrast, others have argued that in Opinion 531 “the Commission has

1   Intervenors and FERC itself may challenge existing rates under FPA Section 206, with the burden of
      showing both that the existing rates are unjust and unreasonable and that proposed new rates are just
      and reasonable.
2   Opinion No. 531, Coakley v. Bangor Hydro-Elec. Co., 147 F.E.R.C. ¶ 61,234 (2014).
3   “Transmission Investment: Revisiting the Federal Energy Regulatory Commission’s Two-Step DCF
      Methodology for Calculating Allowed Returns on Equity,” Edison Electric Institute, December 2017.

                                                                                          brattle.com | 1
created an undefined exception to the presumptive validity of the DCF methodology for
‘anomalous’ market conditions.” 4
However, the commentary to date has underplayed an opportunity to address changing business
risk: transmission owners are simultaneously facing 1) new pressures to invest and 2)
heterogeneous demand patterns that could impair (or potentially strand) assets in the long term.
Emera provides an opportunity to address ROE-related issues that have not been raised in either
recent FERC policy statements or the decision itself. While FERC has allowed ROE adders since
Order 679 in 2006 to meet growing demand for transmission infrastructure, it may now be that
new and intensified risks justify ROE adders or other mitigants. A corollary may be that cost of
capital proceedings must inevitably be accompanied by company risk analysis in the foreseeable
future. This paper explores these issues in the context of FERC precedent and recent events.
II. Background
–––––
A. FERC PRECEDENT
For many years, FERC has set base ROEs for electric transmission and gas pipelines by estimating
returns required by investors for a defined portfolio of comparable companies (or the “proxy
group”). The proxy group has been defined as publicly-traded electric utilities with credit ratings
close to the subject company and without factors that might tend to affect the stock price
temporarily (i.e., recent dividend cuts or merger activity). 5 Once ROEs have been estimated for
the proxy group, FERC has applied “tests of reasonableness and economic logic” to exclude low-
end outliers. 6 At the other end of the spectrum, starting in 2004, the proxy group was further
narrowed to exclude “high-end outliers” defined as those with estimated earnings growth higher
than 13.3% or resulting ROE estimates higher than 17.7%.
To estimate ROEs, FERC practice prior to Opinion 531 had long been to rely on the so-called
“one-step” DCF methodology. “One-step” referred to the practice of basing the DCF calculation
solely on near-term estimates of dividend growth, assumed to apply indefinitely into the future. 7
On this basis, FERC would establish a range of ROEs, or “zone of reasonableness,” derived from
4 “Developments in FERC Policy for Determining Return on Equity,” Andrea I. Sarmentero Garzón and
Gerit F. Hull. Energy Law Journal, Volume 38:375, November 16, 2017.
5 Opinion 531, Section VI(B).
6 Id.
7 The FERC would moderate near-term growth estimates using a “sustainable growth formula” based on
expectations for the retention of book earnings plus accretion of equity value.
brattle.com | 2the equity returns measured for the proxy group as described earlier. Then, from within the
zone, an allowed base ROE would be determined, customarily the midpoint (for a group of
companies) or median (for a single company).
In order to seek departures from this practice, applicants were required to establish the existence
of factors that cast doubt on a mechanical application of the DCF methodology, such as
anomalous conditions in the capital markets. Estimation methodologies other than DCF, such as
the Capital Asset Pricing Model (CAPM), risk premium, and comparable earnings methods, were
generally excluded from the analysis and were used only to refine the allowed ROE within the
zone of reasonableness.
Separately, FERC has accommodated adders to base ROE for transmission projects that enhance
reliability or reduce congestion, or to motivate membership in RTOs, pursuant to Order 679 in
2006. 8 These were not sized in relation to any formal measures of risk. Rather they were a
development incentive.
B. OPINION NO. 531
FERC Opinion 531 in June 2014 and related Opinions 531-A in October 2014 and 531-B in
March 2015 were responsive to a Section 206 claim by Massachusetts Attorney General Martha
Coakley on behalf of transmission customers in New England. 9 More importantly, however, the
orders effectively set policy for determining allowed ROEs for electric transmission in other
cases and beyond New England.
The centerpiece of Opinion 531 was to replace the one-step DCF described above with a “two-
step” methodology. This was intended to acknowledge that near-term estimates of dividend
growth should not be assumed to persist indefinitely, but, more realistically, could be expected to
converge over time to growth in the economy generally. It also recognized that the two-step
DCF methodology was already FERC policy for oil and gas pipelines, in the form of a blended
dividend growth rate consisting two-thirds of near-term growth rates and one-third of forecast
growth in Gross Domestic Product (GDP). Accordingly, this formulation was mandated for
electric transmission.
Implementation of the two-step DCF methodology tended to narrow the range of ROEs from the
proxy group, because the proxy companies were deemed to all share the same long-term growth
rate. Additionally, since near-term earnings growth estimates have historically exceeded forecast
GDP growth, the two-step DCF tended to produce a lower zone of reasonableness for any given
8 Order 679 came in response to FPA Section 219, which was added as part of the Energy Policy Act of
2005 to authorize rate adders to motivate investment in electric transmission.
9 Martha Coakley, Massachusetts Attorney General, et al. v. Bangor Hydro-Electric Company, et al., the
New England Transmission Owners, or “NETOs” (Docket No. EL11-66-001).
brattle.com | 3proxy group than the one-step DCF. In recognition of these effects, Opinion 531 dispensed with
the high-end outlier test described above, which was based upon a belief that high earnings
growth rates were not sustainable in the long term. Reliance on a forecast of long-term GDP
growth helped to remove the concern that long-term growth rates were unsustainable, though it
implicitly also assumed that long-term opportunities were equivalent for all transmission
companies. 10
Separately, FERC found it reasonable in the circumstances of the time to depart from a
mechanistic application of the DCF. This was based on acknowledging the “model risk” inherent
in applying the DCF under “anomalous” capital market conditions, namely the historically low
interest rate environment that had existed since the financial crisis. Accordingly, Opinion 531
called for setting the allowed ROE halfway between the midpoint of the zone of reasonableness
and the top of the zone.
Opinion 531 established a zone of reasonableness as the range from 7.03% to 11.74%. The
allowed ROE was set at 10.57%, the midpoint of the upper half of this zone. Importantly, the
ROE previously established by Opinion 489 in 2006, 11.14%, remained in the zone of
reasonableness, but somewhat paradoxically it was no longer deemed just and reasonable because
it exceeded 10.57%.
C. THE EMERA DECISION
In a sense, the Circuit Court remand and vacatur of Opinion 531 could be viewed as quite narrow
and technical, without broad implications for future FERC policy. The context was the particular
Section 206 proceeding brought by Coakley et. al., as opposed to a more broadly-applicable ROE
determination under Section 205. Section 206 mandates a “dual burden” of showing in the first
instance 1) that the existing rates are not just and reasonable, and 2) contingent upon the first
showing, that the proposed alternative rates are in fact reasonable.
As discussed further below, the Court held that FERC had failed to show that 11.14% was not
just and reasonable independent of (and as a condition precedent to) its recommendation of
10.57%, nor had it established a “rational connection” between its recommendation and the
evidence brought to bear. In other words, if the currently allowed ROE remained within the
range of reasonableness, why was it not “just and reasonable?”
10 This policy also implicitly assumed that all transmission companies are equally sensitive to the overall
growth of the economy. In fact, as discussed further, much of the planned expansion for the next
decade has very little connection to foreseen economic growth, but instead responds largely to aging
infrastructure, resiliency considerations, and new sources of generation (including distributed energy
resources).
brattle.com | 4However, beyond these technical questions and as a practical matter under a new commission,
the Emera decisions opens the way for a comprehensive recasting of FERC ROE policy, which
we believe is appropriate in light of the more complex financial and energy market conditions
facing transmission owners now and in the future.
D. DIVERGING STAKEHOLDER CLAIMS
For most of the year after April 2017, FERC was without a quorum of commissioners, and hence
unable to process routine approvals, much less respond to the Emera decision. This has left
stakeholders to make their own interpretation of judicial intent and past FERC policy. There
have been four ongoing transmission rate proceedings affecting the New England Transmission
Owners (NETOs), and some in other regions, in which stakeholders have invoked the Emera
decision to support their claims. 11 Somewhat awkwardly, the parties have resorted to both
claiming consistency with Opinion 531 and dissenting from it, as suit the issues at hand.
Transmission owners have argued for reinstituting the base ROE that applied before Opinion
531, or 11.14%, reasoning that with the Court vacatur of Opinion 531, the applicable rate should
devolve back to the pre-531 status quo. 12 While FERC rejected this request on October 6, 2017,
this was more on administrative than substantive grounds pending FERC’s eventual order on
remand. Thus the question of what is the “existing ROE” remains open, as well as how it should
be evaluated under a new policy.
Meanwhile, in the series of Section 206 challenges that have followed in the footsteps of
Coakley, transmission customers, advocates thereof, and FERC Trial Staff (collectively the
“Section 206 Claimants”) have mounted challenges to Opinion 531 for their own purposes, again
invoking Emera. Most conspicuously, the Section 206 Claimants have dissented from FERC’s
recognition of anomalous capital market conditions (and, accordingly, dismissed any need to
review alternative benchmarks to DCF):
“At some point, the term anomalous is no longer an appropriate label for this new
equilibrium. That point is now. It is arbitrary and capricious to set base ROEs on
the expectation by some – continually wrong since 2009 – that capital market
conditions are on the cusp of dramatic or swift change.” 13, 14
11 These have been referred to as Complaints I – IV. In addition to Coakley, they are ENE (Environment
Northeast), et al. v. Bangor Hydro-Electric Company, et al. (Docket No. EL13-33-000), Attorney
General of the Commonwealth of Massachusetts, et al. v. Bangor Hydro-Electric Company, et al.
(Docket No. EL14-86-000), and Belmont Municipal Light Department, et al. v. Central Maine Power
Company, et al. (Docket No. EL16-64-000).
12 NETOs Amended Compliance Filing, Docket Nos. ER15-414-002 and EL11-66-004, June 5, 2017.
13 Initial Brief of Commission Trial Staff, Docket No. EL16-64-002, January 19, 2018. Page 30.
brattle.com | 5The NETOs argue that anomalous conditions persist today, pointing out that interest rates
remain well below historic averages and that “U.S. and global interest rates and financial markets
remain subject to powerful and unprecedented monetary policy actions by the Federal Reserve
Bank and other global central banks.” 15
Perhaps unsurprisingly, claims have diverged significantly further from the status quo than in
the past, as shown in Table 1. A comparison between the relative positions of Trial Staff in
Coakley—which challenged an ROE of long vintage that straddled the financial crisis—and in
Complaint IV (Belmont Municipal Light Department vs. Central Maine Power), is instructive.
Even though Belmont was challenging the more recent ROE determined by Opinion 531, in
relatively similar economic conditions, Trial Staff departed from the previously approved ROE by
seeking a reduction of 285 basis points, nearly double the reduction of 148 basis points sought in
Coakley.16
Table 1: ROE Claims in Coakley and Belmont Cases
Martha Coakley, Massachusetts Attorney Belmont Municipal Light Department, et
General, et al. v. Bangor Hydro-Electric al. v. Central Maine Power Company, et
Company, et al. al.
Docket No. EL11-66-001 Docket No. EL16-64-000
2006 Difference 2013 2014 Difference 2017
Opinion 489 Trial Staff Opinion 531 Trial Staff*
High 13.10% -0.59% 12.51% 11.74% -2.34% 9.40%
Adjusted for Market Conditions 11.14% 10.57%
Midpoint 10.40% -0.74% 9.66% 9.39% -1.67% 7.72%
Low 7.30% -0.48% 6.82% 7.03% -0.99% 6.04%
Recommended 11.14% -1.48% 9.66% 10.57% -2.85% 7.72%
* Later amended upward for adjustments to proxy group outliers.
Source: FERC filings
Continued from previous page
14 Claimants have also defined proxy group criteria in a manner that, relative to precedent, reduces sample
sizes, eases the screen on low-end outliers, and omits purported high-end outliers. In the latter case,
claimants have sought to roll back the reasoning relied upon in Opinion 531 that a two-step DCF
model removed the need to cap admissible growth rates or ROEs from sample data.
15 Initial Brief of the New England Transmission Owners, Docket No. EL16-64-002, January 19, 2018. Page
22.
16 In March 2018, a FERC administrative law judge issued an initial decision in Belmont, finding that the
currently filed base ROE of 10.57% is “not unjust and unreasonable.” The decision was predicated
principally on matters relating to assembling an appropriate proxy group.
brattle.com | 6III. What a New Policy Must Address
–––––
A variety of factors have led to the divergence shown above and form key points of focus for a
new FERC order on remand. These can be viewed through the lens of addressing “model risk”
and associated technical debates, as discussed below. However, the greater opportunity may be to
consider fundamental changes in the transmission business environment and how to address
them.
A. ARE ANOMALOUS MARKET CONDITIONS THE
ONLY DRIVER OF MODEL RISK?
The Commission has recognized the hazards of “model risk” in producing distorted outcomes.
Opinion 531 reflected the definition of model risk set forth by the NETOs: “the risk that a
theoretical model that is used to value real-world transactions fails to predict or represent the
real phenomenon that is being modeled.” 17 An implication of model risk is that model results
should not be automatically adopted, but rather subjected to adjustment based on reasoned
judgment.
Capital markets have departed from historic norms since the financial crisis of 2008-2009. This is
most clearly seen in yields on government bonds. For instance, the historical average of annual
yields on long-term government bonds was 5.23% from 1926 to 2010, but the long-term
government bond yield stood at just 2.72% in 2016. 18 This has been, in part, the result of a
deliberate policy by the Fed to lower bond yields in an effort to induce investors to move to
riskier assets such as stocks, and thus a departure from equilibrium conditions. While current
Federal Reserve policy is to let interest rates gradually rise, this goal is frustrated by negative
interest rates in much of the rest of the world.
Under these conditions, asset pricing models heavily reliant upon currently measured stock
prices such as the DCF methodology may break down. Among other things, the DCF
methodology assumes that stock prices and expected cash flows are linked by a discount rate
reflecting perceived risk. However, all else equal, abnormally low interest rates drive demand for
equities and drive stock prices up (per the Fed’s intent), and thus returns measured via the DCF
analysis down. This masks the risk/reward relationship that would obtain in equilibrium
conditions. While it may be a valid short run description of investor tastes, it is not likely a
17 Opinion 531. Page 69.
18 See Duff & Phelps’s Ibbotson Stocks, Bonds, Bills, and Inflation (SBBI) 2017 Valuation Yearbook at 2-9.
brattle.com | 7sufficient measure of risk and return needed to attract or sustain long-term investments in
critical infrastructure.
As indicated above, recent debate continues to center on the empirical question of whether
anomalous capital markets conditions continue to prevail. The Section 206 Claimants side step
the more general question of model risk:
“Even if one assumes that the DCF model is subject to the same level of model risk
as other methods, with that even playing field all the reasons the Commission had
previously to prefer the DCF method over the alternate methods still exist in this
stable environment.” (emphasis added) 19
By contrast, the NETOs have argued for a more holistic view:
“[The Section 206 claimants] ask that the Presiding Judge mechanically apply the
DCF model in the absence of a finding of anomalous capital market conditions.
But because ‘there is no failsafe method to estimate investors’ required cost of
equity, approaches other than the DCF model have earned widespread acceptance
with investment and finance professionals, as well as regulatory agencies
throughout the United States.’” NET-02700 at 26:5-8. 20
While clearly important, we would argue that anomalous financial market conditions are not the
only facet of model risk to consider. As we discuss in greater detail later in this paper, it is
apparent that the risk characteristics of the regulated wholesale services to markets the FERC
oversees are becoming more extreme, heterogeneous, and uncertain. These complex conditions
make it less plausible that a broadly applied, one-method risk-measurement approach will
suffice. For example, a wider diversity of business risks may mean that the profile of any one
company is less and less captured by the characteristics of proxy groups. Also, in a regulated
setting, risks will be asymmetric, or one-sided, and hence not reflected in standard cost of capital
metrics.
B. CHANGES IN THE TRANSMISSION BUSINESS
ENVIRONMENT
Until recent years, regulated electric transmission companies generally operated in a more
predictable environment than today. Load growth was steady, and transmission was added
primarily to reliably transmit electricity from large fossil generators to load centers. Transmission
cost was generally a low portion of delivered supply cost, utilization factors were high and
19 Initial Brief of Commission Trial Staff, Docket No. EL16-64-002, January 19, 2018. Page 7.
20 Initial Brief of the New England Transmission Owners, Docket No. EL16-64-002, January 19, 2018. Page
10.
brattle.com | 8steady, and the priorities were assuring reliable load delivery and network security. To a lesser
extent, transmission was deployed to achieve economic savings (e.g., by relieving congestion).
While that remains partly true today, it is also the case that new demands on transmission
owners have proliferated, sometimes in opposing ways to other industry developments that
create new tensions. Drivers include: 1) heightened concerns about system reliability, flexibility,
and resiliency; 2) increasing demand for congestion relief and economic efficiency; 3) supporting
environmental policy by accessing remote renewable resources; and 4) accommodating diverse
changes in flow patterns arising from the growing dominance of natural gas, the retirement of
older power plants, and distributed energy resources.
Risks associated with new investment include more capital outlay, especially for development,
longer investment horizons, more permitting and regulatory risk, and heightened competitive
bidding risks. Some increase in risk has already been recognized by FERC, which acknowledged
in Opinion 531 that transmission bears greater risks than distribution operations regulated by the
states. 21
What may be less obvious is the potential for more concentration, heterogeneity, and
unpredictability in business risk likely to face transmission owners in the future. Increased risks
are being borne in an environment of anemic load growth. All else equal, this will magnify
transmission as a portion of end-user electricity costs and make debates over cost allocation more
acute. The new demands are also taking hold unevenly around the country and sometimes in the
context of changing demand shapes due increased penetration of renewables and demand side
energy resources. Accordingly, the new requirements are being addressed by diverse changes in
market design (in RTOs and elsewhere). Risks are thus likely to be more specific to particular
regions and stakeholders than in the past. There is greater possibility that the original rationale
for new transmission may change considerably over the life of the asset (e.g., if load or flow
patterns shift). This could, region by region, lead to overdevelopment and cost-recovery
difficulties, theoretically including stranded asset risk.
Importantly, some of these risks are asymmetric (or one-sided), as described further below.
1. Demand for Transmission Investment has not
Abated
Imperatives to expand the nation’s transmission infrastructure have not abated, but only
intensified in recent years. At first blush, this is counter-intuitive. Due to technology
improvements, end-use electricity demand has been flat or growing at a very modest rate in
much of the country. Meanwhile, demand for electricity delivered by traditional utilities may be
21 Opinion 531, pages 72-73.
brattle.com | 9in greater jeopardy, eroded by technology developments that enable end-users to serve some or
all of their own needs. 22
However, transmission demand has many more drivers than just load growth. In 2015, the
Department of Energy’s (DOE) Quadrennial Energy Review (QER) noted that, a decade prior,
the DOE had pronounced the U.S. electricity grid as “aging, inefficient, congested, and incapable
of meeting the future energy needs of the information economy without significant operational
changes and substantial public-private capital investment over the next several decades.” 23 While
significant improvements had been made to the grid by 2015, the QER stated that “the basic
conclusion of the need to modernize the grid remains salient.”
Thus it has been the case that annual additions to transmission plants have far outpaced
electricity load growth. Data from the U.S. Energy Information Administration (EIA) shows that
annual transmission investment by major U.S. utilities ramped up sharply after 2005, when it
stood at approximately $5.5 billion. Thereafter it grew nearly four-fold to reach $21 billion in
2016, an average annual rate of 13.0%. Meanwhile, electricity use grew by only 0.4% per annum
over the same period. Relative growth is shown in Figure 1 (1996 = 100).
Figure 1: Growth in Transmission Plant vs. Electricity Use
y
700
600
Growth Index (1996 = 100)
500
400
300
200
100
0
1996
1997
1998
1999
2000
2001
2002
2003
2004
2005
2006
2007
2008
2009
2010
2011
2012
2013
2014
2015
2016
Transmission Investment (Avg Annual Growth since 2005 = 13.0%)
Electricity Use (Avg Annual Growth since 2005 = .4%)
Sources: U.S. Energy Information Administration – Today In Energy, February 9, 2018;
U.S. Energy Information Administration – Annual Energy Outlook 2018
22 See also, “Compensating Risk in Evolving Utility Business Models,” The Brattle Group, June 2017.
23 See pp. 1-3 of Office of Energy Policy & Systems Analysis’ (EPSA) “Quadrennial Energy Review: Energy
Transmission, Storage, and Distribution Infrastructure,” April 2015.
brattle.com | 10EEI recently forecast a continuation of this trend, with incremental transmission spending by its
members well in excess of $20 billion each year through 2020. 24 Clearly, the demand for
transmission investment is being driven by factors other than load growth. Key drivers include:
--- Increased System Reliability Standards and New Resiliency Concerns: A material part
of recent transmission investment can be attributed to more stringent standards for
maintaining system reliability (such as NERC and RTO/ISO standards), and system
hardening and resiliency. Together, these are intended to ensure that the grid is
capable of managing more extreme electrical and physical disturbances, as concerns
about massive system disruptions were triggered by the 2003 Northeast U.S. blackout
and have intensified more recently with increasing occurrences of extreme weather
events. This expansion may prove critical, or it could be little used, as it is largely
needed for defense against rare, extreme events. However, it is likely unavoidable
since, if the increasing prevalence of extreme climate events should involve a
destructive disaster, the transmission owner may face imprudence allegations and
irrecoverable repair costs.
--- Economic efficiency: Economic efficiency goals have included de-bottlenecking
congestion and promoting interregional coordination of wholesale markets, requiring
additional transmission capacity. In the past, economic efficiency has received lower
priority than reliability goal, with the result that there is now pent up demand for
more transmission. State policymakers in RTOs such as NYISO and ISO New England
have responded by seeking competitive procurement of new transmission. In New
York, for example, the state public service commission has declared a public policy
need for major transmission upgrades to provide congestion relief and to enable access
to a new resource mix as the state’s energy landscape is shifting.
--- Accessing remote renewables: State decarbonization targets, as well as declining
technology costs, have led to, among other things, large-scale buildout of renewable
wind generation resources. To optimize the capture of wind resources and high
capacity factors, wind generators are increasingly being built in remote locations. This
phenomenon has accelerated as wind technologies have improved to take advantage
of higher wind speeds in these locations. These developing “wind generation pockets”
require new transmission investments for grid integration, often consisting of lines
that span longer lengths, higher voltages, and greater permitting and siting risks.
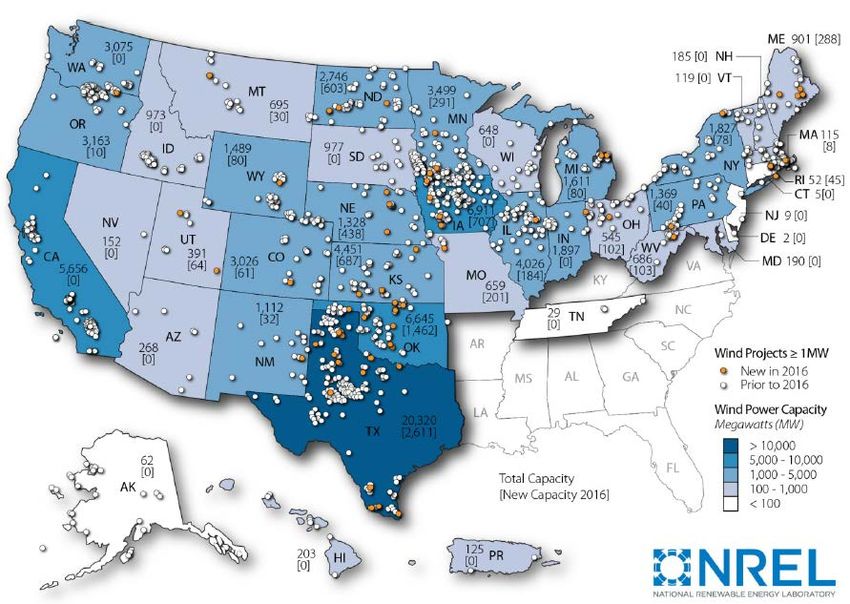
Figure 2 illustrates inland wind generation plant locations in the U.S. As shown, the interior
region and northern New York/New England have experienced large-scale wind generation
buildout, creating increasingly congested “wind pockets” and affecting transmission system
stability, and also triggering other operational and market design issues. As significant
transmission system reinforcements, such as ERCOT’s Competitive Renewable Energy Zones
24 “Transmission Investment: Revisiting the Federal Energy Regulatory Commission’s Two-Step DCF
Methodology for Calculating Allowed Returns on Equity,” Edison Electric Institute, December 2017.
brattle.com | 11(CREZ), have been developed specifically to access remote renewables, they have also enabled
even more wind generation development, which may soon require additional transmission
buildout to manage growing congestion between wind-rich areas and demand centers. Other
regions, such as Southwest Power Pool (SPP), have also experienced significantly low location
market prices in wind-rich locations, like in western SPP compared those in eastern SPP, where
much of the demand is located 25. As even more wind resources attempt to interconnect, these
price differentials will exacerbate further, requiring significant transmission buildout. Similarly,
transmission owners in ISO New England have been assessing various transmission buildout
options to integrate queued-up large-scale remote renewables in northern New England, and to
deliver their low-cost energy to higher priced demand centers in southern New England.
Figure 2: Wind Project Locations across the U.S. (through 2016)
Western MISO
Northern &
Western ME
Northern
NH
Western SPP,
OK-TX
Panhandle
Wind Pockets
Source: Ryan Wiser and Mark Bolinger. 2017. 2016 Wind Technologies Market Report.
Figure 6, Page 8. U.S. Department of Energy (DOE). DOE/GO-102017-5033.
https://doi.org/10.2172/1393638.
--- Responding to the natural gas boom: At a scale greater than just the introduction of
renewables, the nation’s generating mix has been undergoing profound changes
largely driven by the shift from coal to natural gas. This has naturally increased
reliance on gas infrastructure of all kinds, not least to export gas from new shale gas
supply centers not yet fully served by pipeline capacity. The gas boom has also
25 See pp. 4-6 of SPP’s State of the Market, Fall 2017; accessed here:
https://www.spp.org/documents/56353/spp_mmu_quarterly_fall_2017_v2.pdf
brattle.com | 12augmented the role of electric transmission, with significant new investment to
supply electricity to the new gas extraction operations. Electric transmission is also
being expanded to address the circumstances of new gas generators. These include
both new locations relative to the capacity the gas generators are replacing as well as
reinforcements to hedge against potential interruptions of gas supply.
--- Distributed energy resources (DERs): The current and potential impact of DERs, such
as residential solar photovoltaics, are well documented. While not yet very large, the
prospects over the next decade are for considerable DER growth, potentially causing
material power market changes well within the long lives of transmission assets.
These are expected to be augmented by recent developments in battery and storage
technologies that will enable end-users to further decrease their reliance on
electricity delivered by utilities. DERs add to the capabilities required from
transmission and distribution networks as they call for two-way services and make
flow patterns more complex to manage or predict.
2. Transmission Business Risk is Increasing
The current transmission infrastructure of RTOs is not generally configured to allow for the easy
integration of new and potentially geographically-remote resources. Connecting new assets to
load centers will require extensive transmission development and significant reinforcements to
existing transmission infrastructure to accommodate variability and contingent flows. Moreover,
transmission needed for such supply integration tend to be longer, more capital intensive, and
are typically exposed to high development costs and lengthy approval processes to comply with
environmental and siting requirements.
These pressures for new investment amplify the conventional risks of transmission investment
recognized by Order 531, namely siting, development, and permitting costs. This can be simply a
function of the longer transmission lines needed to reach renewable resources, as well as new
rights of way and environmental implications. Clearly, transmission projects built to serve off-
shore wind resources will face significantly heightened risk in these areas.
Relatedly, operating risk for transmission systems built to integrate remotely-located renewable
supply resources can be expected to be higher than that for the traditional transmission function
of reliable load delivery at predictable utilization levels. The integration of intermittent resources
means more complex load shapes, more ancillary service needs, and greater volatility in
utilization.
New risks have also been introduced under new procurement rubrics. For example, the
competitive bidding program in New York described earlier attracted 22 finalist bids. To gain
competitive advantage, some competing bids offered to assume a portion of the risk of any cost
overruns, if selected. Thus, even as the absolute levels of risk associated with larger, more
complex projects increase, the allocation of those risks is shifting more in the direction of
developers.
brattle.com | 13It is worth noting that all of these risks will be borne in a new tax regime that increases cash flow
and liquidity risk for regulated utilities. 26
3. Transmission Business Risk is More Heterogeneous
Changes in the transmission business environment are not confined to linear amplifications of
previously recognized risks. They are also based in sectoral and geographic shifts that may
disturb traditional patterns of operation and usefulness for infrastructure investment. The new
demands outlined earlier can be expected to be both region-specific and qualitatively diverse.
For example, mandates for resiliency will need to be responsive to regional threats of growing
frequency (such as the wildfires recently experienced in California) and based on distinctive
regulatory and legal precedents. Economic efficiency projects will be motivated by local
congestion bottlenecks and result in collapsed basis differentials with unforeseeable effects.
Accessing remote renewable resources will also be highly region-specific and will incur
integration challenges. The prevalence of natural gas has changed the logic of siting electric
transmission lines (as well as gas pipelines). Low cost shale gas is causing the retirement of
baseload coal, for which the layout and capacity of the existing grid was originally configured,
including shorter distances between generation and loads.
Similarly, though not as far advanced yet in influencing transmission needs, the penetration of
DERs is occurring very differently region by region. This can have several effects on the wires
that traditionally support such regions: demand may decline further (and may become flatter or
spikier, depending on how it is controlled locally), congestion prices across the lines from remote
supply sources may drop radically, and local backup requirements may increase (inviting smaller,
fast-response generation or storage at the load centers).
A corollary to the greater heterogeneity of risks is a wider framework for the assessment of costs
and benefits, and thus more room for stakeholder conflict. Investments will vary widely by
regulatory mandate and be increasingly subject to challenge. Resiliency debates, for example, are
likely to occur in the wake of adverse events resulting in extreme costs and frustration for
customers. Routine planning will contend with concentrated and unexpected factors such as
collapsed congestion premiums, dispatch shifting, new flow patterns on wires and pipes, and
DERs. All of these could weaken the presumption of regulatory support for traditional long-haul
lines, making planning more difficult and potentially impinging on cost recovery. Shifting
rationales for transmission infrastructure can certainly result in the cancellation of new projects
(with loss of sunken development cost).
26 Under the new tax regime, overall revenues will likely be reduced, and variances in revenue and costs
that would previously be buffered by federal tax sharing at a 35% rate are now shared at a 21% rate,
with greater risk now falling more significantly on investors. See also, “Six Implications of the New Tax
Law for Regulated Utilities,” The Brattle Group, January 2018.
brattle.com | 144. The Base for Cost Allocation is Narrowing
In the past, it has generally been possible to repurpose transmission infrastructure no longer
suited to its original purpose, with incremental costs (if any) socialized across a wide system. It is
less clear that in the future transmission owners will be able to reliably allocate and recover
increasingly contestable costs. For instance, in some jurisdictions, transmission costs are
recovered on the basis of customers’ share of coincident peak. DERs may allow large customers
to avoid most or all of that coincidence, even while they remain users of the grid. Also, the
emergence of DER technologies combined with transmission spending growing much faster than
electricity demand may increase customers’ desire and ability to avoid payment for shares of the
grid, even when they still need it at their reduced net usage. Such reductions in demand may
expose transmission assets to greater financial uncertainty in planning and operations. It also may
alter the useful lifespans of conventional or even newly developed assets, because the market
may simply move out from under them over the next decade or two. The question facing today’s
transmission owners is whether previously customary repurposing/socialization will be
sustainable indefinitely.
5. The Problem of Asymmetric Risk
Some of the potential risks facing regulated transmission and pipelines tend to be asymmetric
(i.e., not balanced between upside and downside possibilities more skewed to the down side).
This is important because such risks generally are not fully reflected in the estimation techniques
used to determine allowed ROEs. This is because ROE estimation metrics and models such as
CAPM and DCF only measure symmetric risks (i.e., risks that are two-sided).
Regulated utility assets are normally deemed to be prudent for development when they are
fulfilling a demonstrated and agreed upon need and when the chosen type of assets is expected to
be more cost-effective than the next best alternative. When such assets are built, even though
they are a source of cost savings over other possible solutions, investors do not obtain any excess
returns from the net benefit their investment creates relative to the next best alternative.
Instead, they just get a fair, risk-adjusted allowed return on the book value of equity. Investors
do not share in any “upside,” which instead accrues entirely to consumers. Utility investors do
face downside risks, however; if there is a chance of regulatory disallowance in the future (or
infeasibility of collecting allowed costs) due to changing adverse circumstances over which they
may have little or no control (or even ability to anticipate).
As an example, it would be instructive to compare a utility equity investor to an investor in a
corporate bond with some default risk. The asymmetric risk facing an investor in a regulated
utility is similar to the risk facing the investor of a corporate bond. Both have the opportunity to
earn a stipulated return: the allowed cost of equity for the utility, and the promised coupons for
the bondholder. For both the bondholder and the utility equity investor there is little or no
upside even if the underlying asset performs very well in the market, while there is significant
downside (albeit ideally with low probability) if the investment turns sour. For example, a
corporate bond default can wipe out the entire value of the bond. Similarly, long-lived, capital-
brattle.com | 15intensive utility investments are exposed to adverse “black swan” events that, while rare by
definition, have the potential to severely handicap or even bankrupt the company and similarly
wipe out much of its value, especially if those circumstances result in prudence challenges or not
used-and-useful findings resulting in disallowances. Both the bondholder and the utility investor
face a situation in which they do not gain any excess returns if the underlying assets prove very
valuable (all those benefits go to customers for the utility or shareholders for the bond investors),
while they can lose if conditions turn sour.
For this reason, a bond coupon “promises” a return to investors that somewhat exceeds the
expected return, accounting for the probability of a downside outcome. Here, however, the
analogy between bondholders and utility equity investors breaks down. This is because the
financial economic models used to estimate a utility’s cost of capital reflect just the expected
outcome, not some analogue to the “promised” outcome. CAPM, for example, commonly relies
on historical data to estimate betas and the market risk premium, and those historical data show
undiversifiable bad outcomes as well as good ones. Similarly, the DCF model uses forecasts of
dividend or earnings’ growth rates. Those forecasts already reflect the possibility of bad,
asymmetric outcomes, but so does the market price against which the DCF model solves for the
required return. The effect is on both sides, so there is no premium. In neither case can we
observe what the return would be that is equivalent to a corporate bond’s “in full and on time”
outcome and then adjust it to being a default-weighted yield. Thus, an allowed rate of return
equal to the cost of capital does not provide an adequate rate of return for a regulated company
faced with substantial loss from asymmetric risk, even when the cost of capital is estimated
perfectly and the market is fully aware of the risks facing the regulated company.
In essence, the obligation to serve forces utilities to put up $100 for an asset that has returns net
of obsolescence risk only worth $90 (or some other low figure reflecting the probability that an
adverse event will wipe out some of the planned collection). And critically, there is no
opportunity for the utility to benefit from excess returns if unforeseen events make the assets
more valuable. This asymmetry needs to be offset in regulation, either by offering a better return
or by providing immunity from stranded costs. These types of risks are called asymmetric risks.
Because delivered power is becoming increasingly price elastic and even out-right avoidable by
customers who self-supply (and who often choose to do so expressly to avoid upstream costs),
transmission assets may become increasingly exposed to asymmetry in their cost recovery
prospects, with more chance of difficulty achieving allowed revenues than possibilities for
exceeding them. This has not been an issue in the past, but is an emerging possibility in the
future.
brattle.com | 16IV. Conclusion
–––––
In the wake of Emera, FERC faces both a fundamental challenge and a rare opportunity to re-
articulate its ROE policy.
It is unavoidable that FERC must develop more robust economic rationales responsive to the
issues raised in Emera. The Circuit Court decision suggests strongly that FERC should expand its
historic reliance on DCF methodologies to include alternative benchmarks. Meanwhile, basic
guidelines must be reestablished for stakeholders, who in the vacuum left by Emera are making
their own interpretations of judicial intent and past FERC policy, resulting in increasingly
divergent ROE claims.
FERC also has the opportunity to address ROE-related issues that have not been raised in either
recent FERC policy statements or the Emera decision. Transmission owners are simultaneously
facing 1) new pressures to invest and 2) heterogeneous demand patterns that could impair (or
potentially strand) assets in the long term, with little or no offsetting upside potential. Emera
provides an opportunity to address ROE-related issues that have not been raised in either recent
FERC policy statements or the Emera decision. While FERC has allowed ROE adders since Order
679 in 2006 to meet growing demand for transmission infrastructure, it may now be that new
and intensified risks justify ROE adders or other mitigants.
Cost of capital estimations and risk positioning at FERC will require a richer menu of tools and
practices. Some proposed changes have been vigorously debated in recent cases and are thus well
known to FERC. These include expanding the suite of estimation methodologies and models,
adoption of more diverse proxy groups, treatment of deemed outliers, other modeled
fundamentals such as long-term growth assumptions, and consideration of benchmarks such as
ROEs awarded to distribution utilities at the state level. 27 However, even if successfully refined,
these tools must also be better mapped to varied market circumstances. This should include
differentiating and weighting models by company context/market conditions, acknowledging
heterogeneity of “business risk” in assembling proxy groups and treating outliers, and considering
more tailored application of assumptions such as long-term growth rates.
A corollary may be that cost of capital proceedings must inevitably be accompanied by company
risk analysis in the foreseeable future, as it will likely be less credible to assume they are all
roughly equivalent in the type and timing of economic risks or opportunities they are facing.
27 As noted in the Appendix, Opinion 531 acknowledged that transmission bears greater risks than
distribution operations regulated by the states.
brattle.com | 17V. Appendix: Tweaking the Models
–––––
A. EMERA SUGGESTS FERC SHOULD RELY ON
ALTERNATIVE BENCHMARKS IN ADDITION TO
DCF
At minimum, a reworking of FERC’s electric transmission ROE policy should be responsive to
specific concerns raised in Emera. As noted earlier, the first of these is FERC’s Section 206
burden to show that prior ROEs are unjust and unreasonable, while the second is the perceived
failure of Opinion 531 to support its recommended ROE. The Court was concerned that FERC’s
process in making both determinations was elliptical and lacked explicit analysis. Per Emera,
FERC “never actually explained how the existing ROE was unjust and unreasonable.” 28
Meanwhile, the decision continued, FERC “failed to establish a ‘rational connection’ between the
record evidence and its decision.” 29
The Emera decision hinted strongly that FERC’s near-exclusive reliance on the DCF
methodology played a role in these shortcomings. FERC had indeed considered alternative
benchmarks: “1) risk premium analysis; 2) Capital Asset Pricing Model (CAPM) analysis; 3)
expected earnings analysis; and 4) comparison of state commission-approved ROEs.” 30 However,
“FERC stressed that it used the alternative analyses only ‘to inform the just and reasonable
placement of the ROE within the zone of reasonableness.’” 31 As a result, the Court drew the
following conclusion:
“FERC’s reasoning is unclear. On the one hand, it argued that the alternative
analyses supported its decision to place the base ROE above the midpoint, but on
the other hand, it stressed that none of these analyses were used to select the
10.57 percent base ROE.” 32
Emera, therefore, invited FERC to consider a more central role for the alternative benchmarks in
developing a recommended ROE (as customarily occurs at the state level). 33
28 Emera, p. 24
29 Id., p. 28
30 Id., p. 9
31 Id., p. 29
32 Id., p. 29
33 Logically, a similar analysis could also make sense in disqualifying existing ROEs.
brattle.com | 18While a more central role for alternative methods and benchmarks would be directly responsive
to issues raised in Emera, it is also likely to address a broad range of stakeholder concerns. It is
common practice in U.S. state and international jurisdictions to consider evidence from multiple
models and multiple versions of the same model (e.g., both a single-stage and a multi-stage DCF).
At the Federal level, the Surface Transportation Board (STB) specifies the use of a multi-stage
DCF and the CAPM, and places equal weight on each in determining the ROE for the U.S. Class
1 railroads. The CAPM is also, unlike the DCF method, grounded in a formal theory of financial
market equilibrium across securities of different risk. Its very structure provides some guidance
for how to adjust ROE allowances for different circumstances (e.g., by reviewing how the
current levels of its estimated parameters compare to the past). Like the FERC, the STB has
expressed a desire to have a consistent and “objective” approach to setting the ROE and has
recognized the importance of using multiple models in pursuit of that goal. 34
Another key benchmark that should be considered by the FERC is allowed ROEs at the state
level. Opinion 531 acknowledged that transmission bears greater risks than distribution
operations regulated by the states:
“[I]nvestors providing capital for electric transmission infrastructure face risks
including the following: long delays in transmission siting, greater project
complexity, environmental impact proceedings, requiring regulatory approval
from multiple jurisdictions overseeing permits and rights of way, liquidity risk
from financing projects that are large relative to the size of a balance sheet, and
shorter investment history.” 35
To the degree that the “spread” between allowed ROEs at FERC and the state level has narrowed,
the results from the current model would tend to reduce the incentive to invest in electric
transmission. As noted, states utilize a wide variety of estimation methods. Collectively they
evaluate a much large sample of companies than the FERC is likely to be able to include in its
proxy groups. Thus any trends or shifts in average state allowances for distribution can and
should inform FERC allowances, at least directionally, for transmission.
34 This concept was articulated some decades ago by our colleague Stewart C. Myers, the Robert C. Merton
Professor of Finance at MIT: “Use more than one model when you can. Because estimating the
opportunity cost of capital is difficult, only a fool throws away useful information.” Stewart C. Myers,
“On the Use of Modern Portfolio Theory in Public Utility Rate Cases: Comment,” Financial
Management, Autumn 1978, p. 67.
35 Opinion 531, pages 72-73.
brattle.com | 19B. THE MODELS NEED CALIBRATING
1. Proxy Group Criteria
Developing a properly representative proxy group is crucial to the integrity of any model.
Although there is a relatively large sample of regulated electric utilities (compared to natural gas
or oil pipeline companies that make up other proxy groups to which FERC applies the DCF
model), there is a question of comparability for use by the FERC because none of the potential
sample companies are “pure play” (or even predominantly) electric transmission companies. This
leads to the question of whether there is a need for an expanded or otherwise modified proxy
group.
Also, there is little, if any, evidence that FERC’s current practice of restricting the relevant
sample to companies within one credit rating notch of the target company improves the
comparability of the sample. Debt ratings are of course known to equity investors along with all
the consequences of having more debt and higher rates. That is partly why proper estimates of
the cost of capital involve delivering the samples and re-levering for the target company. Unless
and until ratings become junk, there is little reason to believe that a sample spanning several
levels is not informative about equity risks. Notably, in Belmont, Trial Staff stipulated a narrower
proxy group than the transmission owners, which may be justified, but implicitly excludes even
more information about risk. This needs to be done very carefully, not in a cookie cutter fashion,
because of the diversity of market conditions facing transmission companies.
2. Outlier Tests
Whereas Opinion 531 dispensed with a high-end outlier test in recognition of the two-step DCF
methodology, recent Section 206 complainants have sought to define new rubrics to exclude
comparable companies with high growth rates or ROEs. In Belmont, the complainants applied a
“dispersion test” to exclude high end ROEs more than two standard deviations from the mean. 36
Trial Staff echoed this approach based on the magnitude of the gap between high-end outliers
and the closest adjacent data point. 37
It is not clear how these approaches are grounded in statistical theory. Simply referencing
standard deviations may be a particularly dangerous guideline to use if there is a small sample, as
tends to be true for transmission companies. At the very least any such treatment should be
tempered by careful scrutiny of the operating and financial circumstances surrounding the
alleged outliers.
36 Docket No. EL16-64-002: Answering Testimony and Exhibits of Adrien M. McKenzie, CFA, on behalf of
The New England Transmission Owners, March 24, 2017.
37 Docket No. EL16-64-002: Prepared Direct and Answering Testimony of Robert J. Keyton, Witness for
the Trial Staff of the Federal Energy Regulatory Commission, September 25, 2017.
brattle.com | 20Also for low-end outliers, the Section 206 complainants have sought to establish novel treatment.
Opinion 531 affirmed prior FERC policy of excluding outlier ROEs below the average bond yield
for utilities rated Baa plus 100 basis points, reasoning that it would be illogical for returns on
stock to so close to the cost of debt. However, in Belmont, Trial Staff asserted that the threshold
should be based on average bond yields for utilities rated A, three notches higher with
correspondingly lower yields. A FERC order on remand will need to reestablish the proper
relationship between ROEs and bond yields (including whether the 100 basis point margin is
high enough to reflect the difference between debt and equity risk). Some of the non-DCF
models (especially CAPM and its variants) explicitly treat this issue. Using them would be far less
arbitrary than subjectively curtailing the proxy sample.
3. Interpretation of “Central Tendency”
Opinion 531 also affirmed prior FERC policy to use the midpoint of a proxy group to reflect its
“central tendency” in cases setting a single ROE for multiple companies. However, the claimants
in Belmont have attempted to justify the use of the proxy group median. Here too, there should
be a reasoned basis, not just analyst preference. The usual reason for using medians is that there
is material skewness in the sample distribution and that some of the extremes have too much
weight. But in stock returns, assuming an efficient market, there is no reason to assume each
observation is not fairly reflecting the price of risk. Omitting outliers also already crops for some
of the skewness that might be feared. Thus the expected value would nominally be appropriate,
unless some of the extremes face highly atypical risk.
4. The Two-Step DCF
Under current economic conditions, with forecast GDP growth at an historic low, stakeholders
are concerned that the FERC policy of weighting GDP by one-third tends to reduce the
measured ROE for many companies in a typical proxy group because forecast GDP growth is
generally lower than earnings growth forecasts for individual companies. Depending on market
conditions, this may be mitigated by complementing the DCF process with alternative
benchmarks. The question remains, however, whether lowering the GDP weighting—or moving
away from GDP altogether—would be appropriate or desirable.
There would be potential trade-offs in pursuing such a policy, because of the issue of
“sustainable” EPS growth rates. As noted above, under FERC policy prior to adoption of the two-
step methodology, FERC would disregard ROE outcomes based on forecast dividend growth rates
in excess of 13.3% or ROE outcomes in excess of 17.7%. Including GDP incorporated the
presumption that combined growth rates and resulting ROEs no longer had to be bounded by
those limitations because forecast growth of the GDP pace is presumed sustainable. De-
emphasizing or removing GDP could invite re-establishing the upper bounds, potentially
removing proxy companies with high dividend growth rates or ROEs from consideration,
potentially lowering ROE outcomes for the group. The actual outcome would of course be fact-
specific and dependent on features of evolving FERC policy (such as whether to reference
midpoint, mean or median ROEs).
brattle.com | 21You can also read