Resiliency & Microgrids Working Group
←
→
Page content transcription
If your browser does not render page correctly, please read the page content below

Resiliency & Microgrids Working Group
Value of Resiliency – 4 Pillar Methodology:
Pillar 3 Resiliency Scorecard and
presentation by Sandia National Labs on Resiliency Node Cluster Analysis Tool
(ReNCAT)

Resiliency and Microgrids Team, Energy Division
June 17, 2021

California Public Utilities Commission 1
WebEx and Call-In Information
Join by Computer:
https://cpuc.webex.com/cpuc/onstage/g.php?MTID=ecff7a9546195b403e7f1ac49c2881f65
Event Password: RMWG (case sensitive)
Meeting Number: 187 221 4091

Join by Phone:
• Please register using WebEx link to view phone number.
(Staff recommends using your computer’s audio if possible.)

Notes:
• Today’s presentations are available in the meeting invite (follow link above) and will be available shortly after the meeting on
 https://www.cpuc.ca.gov/resiliencyandmicrogrids.

• The meeting presentations by Sandia and Lawrence Berkeley National Labs will be recorded. There will not be meeting minutes.

California Public Utilities Commission 2
WebEx Logistics
 WebEx Tip
• All attendees are muted on entry by default. Access the written
• Questions can be asked verbally during Q&A panel here
 Q&A segments using the “raise hand”
 function. 1. Click here to access
 • The host will unmute you during Q&A the attendee list to raise
 and lower your hand.
 portions [and you will have a maximum
 of 2 minutes to ask your question].
 • Please lower your hand after you’ve 2. Raise your hand by
 asked your question by clicking on the clicking the hand icon.
 “raise hand” again.
 • If you have another question, please
 3. Lower it by clicking
 “re-raise your hand” by clicking on the again.
 “raise hand” button twice.
• Questions can also be written in the Q&A
 box and will be answered verbally during Access your
 meeting audio
 Q&A segments. settings here

California Public Utilities Commission 3
WebEx Event Materials

California Public Utilities Commission 4
Preliminary Resiliency & Microgrids Working Group
Schedule
 Month Resiliency and Microgrids Working Group Topics
 Value of Resiliency: Working
 February
 group participants to discuss
 March Standby Charges Multi-Property resiliency valuation through an
 April Microgrid Tariff
 all-hazard approach to
 May
 disruptions and mitigations by
 June
 Value of Resiliency examining metrics,
 July
 August
 methodologies, and policy
 September
 applications.
 Microgrid
 October Interconnection
 November
 Customer-Facing
 December Microgrid Tariff
 January Revisit
 February

California Public Utilities Commission 5

Agenda
I. Introduction (CPUC Staff) 2:00p – 2:05p
 • WebEx logistics, agenda review

II. Value of Resiliency – Pillar 3 – Resiliency Scorecard 2:05p – 2:35p
 • A tool to compare mitigation measure resiliency configuration characteristics
 • Q & A and Discussion 2:35p – 2:45p

III. Resilience Node Cluster Analysis Tool (ReNCAT)
 • Bobby Jeffers – Sandia Labs 2:45p – 3:30p
 • Q&A and Discussion 3:30p – 3:45p

IV. Additional Q&A and Discussion 3:45p – 3:55p

V. Closing Remarks, Adjourn 3:55p – 4:00p
 • Provide information on the next meeting

California Public Utilities Commission
The Problem to Solve: How can we optimize grid investments
to maximize resiliency?
4 Pillars of Resiliency Valuation
I. Baseline Assessment
 I. What do we want to protect and where is it?
 II. What threatens it?
 III. How well are we doing now to protect it?
II. Mitigation Measure Assessment
 II. What protection options do we have?
 III. What does the best job at protecting the most?
 IV. What does it cost?
III. Resiliency Scorecard – scoring resiliency configuration characteristics
IV. Resiliency Response Assessment (post-disruption or modeling) –
 II. How well did the investments do in reaching resiliency targets?
 III. Did the investments reduce impacts on the community?

California Public Utilities Commission
All-Hazard Approach to Assess Resiliency Measures

 Mitigation measures to achieve the minimum resilience level for the geographic area defined would be compared in terms of
 cost, effectiveness (based on the effect on the resiliency trapezoid and/or meeting resiliency targets), and the degree to which
 the measure would mitigate various hazards (risk-assessment based on weighted all-hazard probability and impact analysis). This
 type of mitigation measure comparison may reveal vulnerabilities and benefits previously unrealized.

 As an example:
 i. Measure A mitigates Hazard Z by taking preparatory measures, which may affect another stage.
 ii. Measure B mitigates Hazard Z & Y increasing preparation and decreasing magnitude.
 iii. Measure C mitigates Hazard X reducing adaptation and recovery stages.
 iv. Measure D mitigates Z, Y & X, but different stages depending on the hazard.
 v. Measure D offers highest level of resilience -- at what cost?
 vi. Compare with costs of either Meas. A + Meas B. + Meas. C OR Meas B + Meas. C
 vii. Compare with Resilience Measure Characteristics (notification, crossover, duration,
 fuel type, load capacity, emissions, geographical impact)

 Measure Mitigates Hazard Ranking Cost * Resiliency Trapezoid
 A Z 1 $40,000 Preparation
 B Z, Y 2 $100,000 Preparation/Magnitude
 C X 1 $400,000 Adaptation/Recovery
 D Z, Y, X 3 $520,000 Preparation (Z, Y), Magnitude
 (Y), Adaptation (X), Recovery
 (X)

 *Cost figures are arbitrary and for illustration purposes only
California Public Utilities Commission

All-Hazard Approach to Assess Resiliency Measures
 Portfolio Measure Cost * Modeled Recovery Total Costs * Outage Magnitude
 Costs * (cumulative customer
 days w/o power)
 0 $1,600,000 $1,600,000 58,000
 (Do nothing)
 1 A, B, C $540,000 $350,000 $890,000 33,000

 2 B, C $500,000 $475,000 $975,000 40,000

 3 D $520,000 $250,000 $770,000 34,000

 *Cost figures are arbitrary and for illustration purposes only

California Public Utilities Commission

Resilience Mitigation Measure Characteristics
 Mitigation Measure Characteristic Metric
 Start-up or islanding crossover transition time (intermittent Time – minutes, hrs
 downtime before specified backup is available)

 Notification time/Advanced notice needed for backup Time – minutes, hrs
 available at specified load/duration

 Duration of backup – with no other inputs Time – minutes, hrs

 Load Capacity (which loads are backed up and how much load kWh, MWh or % of load
 (Critical, Priority, Discretionary)

 Fuel Type/Fuel Availability Unit of fuel, availability before/during islanding

 Emissions level – GHG and particulates MMCO2, PPM

 Geographic boundary Location on geographic map, sq ft, sq mi

 Blue Sky participation kWh, kW

California Public Utilities Commission
Resiliency Valuation Methodology
III. Resiliency Scorecard

 Resiliency “Scorecard”
 1) Resiliency Scorecard is a tool that aims to provide a mechanism for comparing
 resiliency solution configurations that recognizes a basic benchmark of
 achievement and provides for improvement.

 2) Scoring system provides for different areas of (potentially ongoing) improvement
 (e.g. 100% resilience targets are met, but configuration uses 70% fossil fuel resources
 to meet those targets. Improvement would be to decrease fossil fuel resources
 while maintaining targets which would result in a higher “score”).

 3) Areas to be scored and scoring mechanisms could be determined by a Resiliency
 Scorecard Working Group. Review and updates of the Scorecard could happen
 periodically (e.g. every 3 yrs) to capture acknowledgement of Scorecard
 effectiveness, changing technologies and a changing energy environment.

California Public Utilities Commission
Resiliency Valuation Methodology
III. Resiliency Scorecard (draft)
 Resiliency Scorecard: Points Score
 Mitigation Measure Resiliency Scorecard: Points Score
 Characteristics Mitigation Measure
 Characteristics
 Duration of backup – with no
 Start-up/ islanding /isolation/
 other inputs
 crossover transition time
 4 hrs 1
 (intermittent downtime before
 8 hrs 2
 Resiliency Scorecard: Points Score specified backup is available)
 24 hrs 3
 Mitigation Measure 0 - 1 min 5
 48 hrs (2 days) 4
 2 - 5 min 4
 96 hrs (4 days) 5 Characteristics
 5 - 30 min 3
 Indefinite 6 Fuel Availability
 30 - 120 min 2
 Onsite, intermittent 2
 Load Capacity (which loads are Onsite, produced 3 < 120 min 1
 backed up and how much load Piped infrastructure 2
 Wires infrastructure 2 Notification time/Advanced
 (Critical, Priority, Discretionary)
 Transport 1 notice needed for backup
 Critical available at specified
 Emissions level – GHG and
 90 - 100% 9 particulates load/duration
 50 - 90% 8 Non-GHG emitting 4 0 - 1 min 5
 0 – 50% 7 Meets CARB emission 3 2 - 5 min 4
 standards 5 - 30 min 3
 Priority
 GHG emissions < xxx 2
 90 - 100% 6 30 - 120 min 2
 Cap n Trade 1
 50 - 90% 5 < 120 min 1
 0 – 50% 4
 Discretionary Blue Sky Services
 90 - 100% 3 Demand Response 2
 50 - 90% 2 Voltage/Frequency 1
 0 – 50% 1 Wholesale participation 1
 NEM participation 1
California Public Utilities Commission
Resiliency Valuation Methodology
II. Mitigation Measure Assessment w/Resiliency Scorecard
 Hypothetical Example: County
 Critical Priority Discretionary
 Resiliency Targets 100%/24 hrs 60%/24 hrs 50%/24hrs
 Current system performance
 against Hazards:
 Hazard #1 Wildfire 0% 0% 0%
 Hazard #2 High Winds 70%/Indefinite 75%/Indefinite 80%/Indefinite
 Hazard #3 High heat events 50%/Indefinite 30%/Indefinite 30%/Indefinite

California Public Utilities Commission
Resiliency Valuation Methodology
III. Resiliency Scorecard (draft)
For Hypothetical Example 4: County, Mitigation Measure Option 1, Hazard 1
 Resiliency Scorecard: Points Score
 Mitigation Measure Resiliency Scorecard: Points Score
 Characteristics Mitigation Measure
 Characteristics
 Duration of backup – with no
 Start-up/ islanding /isolation/
 other inputs
 crossover transition time
 4 hrs 1
 (intermittent downtime before
 8 hrs 2
 Resiliency Scorecard: Points Score specified backup is available)
 24 hrs 3
 Mitigation Measure 0 - 1 min 5
 48 hrs (2 days) 4
 2 - 5 min 4 4
 96 hrs (4 days) 5 Characteristics
 5 - 30 min 3
 Indefinite 6 6 Fuel Availability 30 - 120 min 2
 Onsite, intermittent 2 < 120 min 1
 Load Capacity (which loads are Onsite, produced 3
 backed up and how much load Piped infrastructure 2 Notification time/Advanced
 (Critical, Priority, Discretionary) Wires infrastructure 2 2 notice needed for backup
 Transport 1 available at specified
 Critical load/duration
 Emissions level – GHG and
 90 - 100% 9 0 - 1 min 5
 particulates
 50 - 90% 8 Non-GHG emitting 2 - 5 min 4
 4
 0 – 50% 7 7 Meets CARB emission 3 5 - 30 min 3 3
 Priority standards 30 - 120 min 2
 90 - 100% 6 GHG emissions < xxx 2 < 120 min 1
 50 - 90% 5 Cap n Trade 1 1
 0 – 50% 4 4 Blue Sky Services
 Demand Response 2 2
 Discretionary
 Voltage/Frequency 1 1
 90 - 100% 3
 Wholesale participation 1 1
 50 - 90% 2 NEM participation 1
 0 – 50% 1 1

California Public Utilities Commission
Resiliency Valuation Methodology
II. Mitigation Measure Assessment w/Resiliency Scorecard
 Hypothetical Example: County
 Critical Priority Discretionary
 Resiliency Targets 100%/24 hrs 60%/24 hrs 50%/24hrs
 Current system performance
 against Hazards:
 Hazard #1 Wildfire 0% 0% 0%
 Hazard #2 High Winds 70%/Indefinite 75%/Indefinite 80%/Indefinite
 Hazard #3 High heat events 50%/Indefinite 30%/Indefinite 30%/Indefinite

 Mitigation Measure Option 1: Covered Conductors, undergrounding, new Resiliency Scorecard
 feeders and reclosers, sectionalizers
 Critical Priority Discretionary
 Hazard #1 Wildfire 75%/Indefinite 20%/Indefinite 0%/Indefinite 31
 Hazard #2 High Winds 60%/Indefinite 20%/Indefinite 40%/Indefinite 31
 Hazard #3 High heat 50%/Indefinite 20%/Indefinite 20%/Indefinite 30
 events

California Public Utilities Commission
Resiliency Valuation Methodology
II. Mitigation Measure Assessment w/Resiliency Scorecard
 Hypothetical Example 4: County

 Option 1 Option 2 Option 3

 Mitigation Measure Covered Conductors, IFOM MGs with dispatchable IFOM MG, PV, Batt
 undergrounding, new feeders and BTM DERs
 reclosers, sectionalizers
 Hazard 3: High Heat Option 1 Option 2 Option 3
 Events
 Effect of Mitigation on 50% CL; 20% PL; 20% DL 100% CL, 50% PL, 30% DL 50% CL; 20% PL; 20% DL
 Target
 Resilience Enhancement $5.65M $4.1M $ 2.5M
 cost
 Resiliency Scorecard 30 31 30

California Public Utilities Commission
Resiliency Valuation Methodology
II. Mitigation Measure Assessment w/Resiliency Scorecard
 Hypothetical Example 4: County

 Hazard 1: Wildfire Option 1 Option 2 Option 3

 Mitigation Measure Covered Conductors, IFOM MGs with dispatchable IFOM MG, PV, Batt
 undergrounding, new feeders and BTM DERs
 reclosers, sectionalizers
 Effect of Mitigation on 75% CL; 20% PL; 0% DL 60% CL; 35 % PL; 30% DL 50% CL; 20% PL; 0% DL
 Target
 Resiliency Scorecard 31 36 34
 Hazard 2: High Winds Option 1 Option 2 Option 3
 Effect of Mitigation on 60% CL; 20% PL; 40% DL 100% CL, 40% PL, 10% DL 50% CL; 20% PL; 20% DL
 Target
 Resiliency Scorecard 31 37 34
 Hazard 3: High Heat Option 1 Option 2 Option 3
 Events
 Effect of Mitigation on 50% CL; 20% PL; 20% DL 100% CL, 50% PL, 30% DL 50% CL; 20% PL; 20% DL
 Target
 Resilience Enhancement $5.65M $4.1M $ 2.5M
 cost
 Resiliency Scorecard 30 31 30

California Public Utilities Commission
WebEx Tip

 Option 1:
 Access the written
 Q&A panel here

 Option 2:

Discussion and Q&A 1. Click here to access
 the attendee list to raise
 and lower your hand.

 2. Raise your hand by
 clicking the hand icon.

 3. Lower it by clicking
 again.

California Public Utilities Commission 18
Discussion Questions

• For a given jurisdiction (e.g., a city government), what characteristics
 should be considered in a resiliency scorecard?
• How might the characteristics relevant to include in a resiliency scorecard
 differ by jurisdiction, if at all?
• How could equity be better represented in a resiliency scorecard to reflect
 a particular jurisdiction’s priorities?
• How might a jurisdiction customize the weights assigned to different
 metrics to reflect their own priorities?

California Public Utilities Commission
Quantifying Community Resilience:
 Social Burden and the Resilience Node
 Cluster Analysis Tool (ReNCAT)

 Bobby Jeffers, Amanda Wachtel, Darryl Melander, Brooke Garcia, Adam Pierson

 Sandia National Laboratories

 Sandia National Laboratories is a multimission
 laboratory managed and operated by National
 Technology & Engineering Solutions of Sandia,
 LLC, a wholly owned subsidiary of Honeywell
 International Inc., for the U.S. Department of
 Energy’s National Nuclear Security
 Administration under contract DE-NA0003525.
1
2

 Society withstands and recovers from acute shocks,
 RESILIENT even ones never before experienced.

 Society performs well day-to-day in the
 EFFICIENT near-term future.

 Society performs well over very long periods of
 SUSTAINABLE time.

 At all scales (T, D, Buildings), there are very real tradeoffs
 between performance in these dimensions.
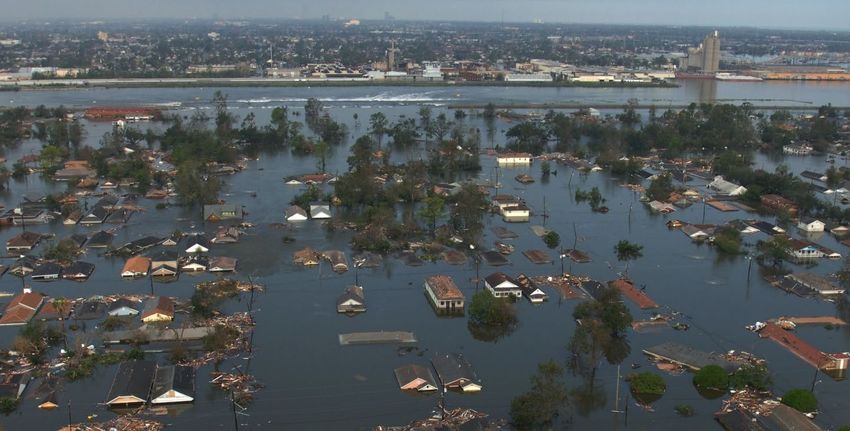
3 Motivation
◦ The grid is the keystone infrastructure – central to the web of interconnected
 systems that support life as we know it.
◦ During extreme events, prices do not reflect the value of all the services (food,
 water, shelter, etc.) that electricity provides
 ◦ Consequence-focused resilience is an externality in power markets
 ◦ The performance of the economy, military, and society as a whole are all important consequences

“It took Cardona 11 days to find a working phone and a cellular signal to
let her mother in Florida know that she was okay. In the weeks
following the storm, she woke up at 2 am to get in line for diesel fuel to
run the generator at her father’s home in Sabana Grande on the
southwest coast of the island. After waiting for 13 hours, she went
home empty-handed. She stood in lines that stretched blocks to get
cash, since no electricity meant credit card readers weren’t running.”
 Image credit: Wikimedia Commons user “Mdf”

 links
4 Motivation, cont.
 NATIONAL ACADEMIES (2017), RECOMMENDATION #1 TO DOE: “IMPROVE
 UNDERSTANDING OF CUSTOMER AND SOCIETAL VALUE ASSOCIATED WITH INCREASED
 RESILIENCE AND REVIEW AND OPERATIONALIZE METRICS FOR RESILIENCE…”

National Academies Press (2017) Enhancing the Resilience of the Nation’s Electricity System
https://www.naesb.org/misc/nas_report.pdf
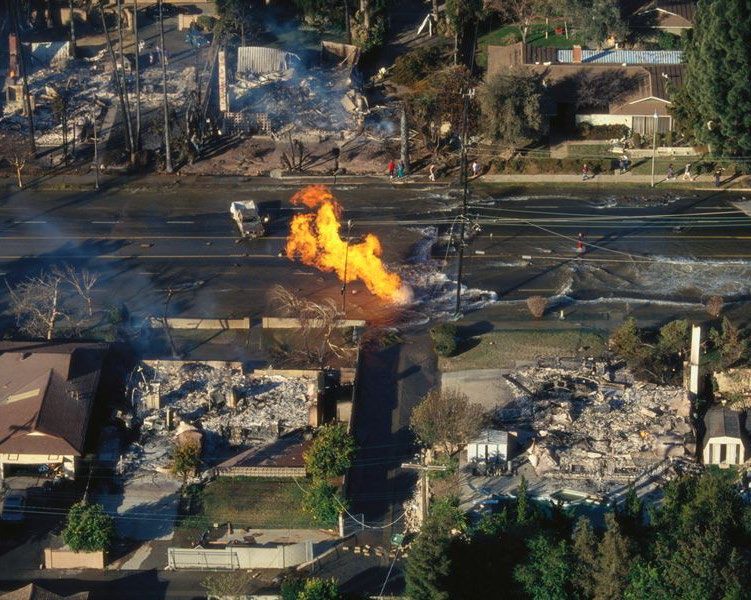
5 Measuring and forecasting resilience

Resilience metrics should:
 • Convey the wide variance among outages in terms of size, duration, and impact on customers
 • Capture the context of the threat environment
 • Translate system performance into consequence, where the severity of consequences can change nonlinearly
 over time
6 Resilience Metrics
 Attribute-based:
 • What makes the system more/less resilient?
 • Things you can count now (on a blue-sky day)
 • Often grouped into categories that describe some aspect of
 resilience
 • Robustness, adaptivity, recoverability, etc.
 • Often populated via surveys or checklists
 • Relatively simple to populate N a t i o n a l A c a d e m i e s ( 2 0 1 7) , R e c o m m e n d a t i o n V u g r i n e t a l . ( 2 0 1 7) u n d e r G M L C 1 . 1
 # 1 t o D O E : “I mp r o ve u n d e r st a n d i n g o f F o u n d a t i o n a l M e t r i c s: Fi r st p o we r -
 cu st o me r a n d so ci e t a l va l u e a sso ci a t e d wi t h f o cu se d d i scu ssi o n o f a t t r i b u t e -b a se d
 i n cr e a se d r e si l i e n ce a n d r e vi e w a n d a n d p e r f o r ma n ce -b a se d r e si l i e n ce
 Performance-based: o p e r a t i o n a l i ze me t r i cs f o r r e si l i e n ce …” me t r i cs.

 • How resilient is/was the system?
 • Things you can measure only during disruption
 • Often uses data from an event or a model of an event
 • Can be difficult to populate for planning
 • Useful to weigh resilience against other goals
 • (e.g. within benefit cost analysis)

 Either approach can be:
 • Retrospective or forward-looking
 • Infrastructure-focused or consequence-focused
 • Threat-informed or threat-agnostic G M L C 1 . 1 F i n a l R e p o r t ( 2 0 2 0 ) : Be g i n s t o NAERM Metrics Report (2020):
 cl a r i f y h o w a t t r i b u t e a n d p e r f o r ma n ce - De scr i b e s co n se q u e n ce d i me n si o n s a n d
 b a se d a p p r o a ch e s ca n co mp l e me n t . me t r i c f o r mu l a t i o n
7 Metrics and Equity

 Acute Social Burden

 Energy Burden, Equitable access to clean energy
 Chronic Social Equity solutions,
 Burden, Chronic environmental injustices,
 … …

 Resilience
 Cost of Service, GHG Emissions,
 Customer Bills Land Use
 … …

 Loss of Load Expectation
 MWh not served
 …
8 Consequence-focused Resilience Projects
 Society Cross-cutting:
 • 2015-16 GMLC: New Orleans Grid Resilience
 • 2013-14 DOE Quadrennial
 • 2017-present GMLC: Designing Resilient Communities
 Energy Review
 • 2018-present SETO and OE: Puerto Rico Recovery
 • 2015-17 GMLC: Foundational
 Economy Metrics

 • 2019-21 OE: North American
 • 2014 Internal: Norfolk and 100 Resil Cities
 Energy Resilience
 • 2015-17 GMLC: Valuation
 Model
 • 2017-present GMLC: Lab Valuation Analysis Team

 National Security

 • 2017-18 ESTCP: Resilient Energy Master Planning
 • 2019-present OE: Energy Assurance for Critical Infrastructure
 • 2020-present GMLC: Energy Resilience for Mission Assurance
9 Outcome of GMLC New Orleans 2016

 Hayne Blvd

 Michoud Bayou

 Lakefront Arena

 West End
 Chef Menteur and Read Blvd

 Gentilly Woods

 Pauger

 St. Bernard and Gentilly

 Mid City

 N Claiborne and Elysian Fields

 St Claude

 Bywater
 Treme

 Canal

 Carrollton Dublin
 Notre Dame

 Microgrid locations are DRAFT
 Algiers General Meyer
 Bolivar and Jackson

 St Charles and Louisiana
 Lower Garden
 and have not been fully
 Magazine Uptown
 reviewed by the City of New
 Orleans or Entergy New Orleans.
 Therefore, all of these impacts
 are subject to change.

 We have moved from “worst case” to
 “worst consequence” planning.
 We need a metric for social resilience.
 Simply serving “critical” load is misleading.
 The needs of multiple offices within local
 and state government are not adequately
 represented within power system
 planning.
10 Quantifying Social Resilience
 Capabilities framework, based on Sen and Nussbaum, applied to energy by Day et al.

 light
 communication
 clean
 water

 safety food
 systems What do we storage
 We are utilizing this theory, but advancing/extending in two ways:
 lose when
 - Chronic vs. Acute: we are applying the capabilities framework to acute, we lose
 sewage
 post disaster scenarios, whereas previous literature focuses on chronic transportation power? disposal
 “blue sky” capabilities
 - Rigorous Quantification: we are the first to apply a mathematical life support medication
 devices + storage
 formulation to the theory medical tech temperature
 control

Nussbaum, Capabilities as fundamental entitlements: Sen and social justice. 2003; Sen, Human Rights and Capabilities. 2005;
Day, R., Walker, G., Simocck, N. Conceptualising energy use and energy poverty using a capabilities framework. Energy Policy. 2016.
11 Performance Based Metric: Social Burden
 The social burden metric calculates how hard society is working to achieve their basic human needs.

 With microgrid portfolio (n) Effort
 Without microgrids Time + money spent to Burden
 People

 achieve basic level of
 human needs ,
 = � �

 Ability
 Median household income
 Burden to Acquire All Necessary Additional predictors
 Services

 Effort for a portfolio of 80 microgrids Social Burden for the same portfolio
10
12 Social Burden Explained

 Service
 Layer [ � ]

 Social Burden Food

 Transportatio ̃ ,̃ ̃
 = ,
 n Layer[ ̃ ]

 Social
 Layer [ ̃ ]

 1
 �
 ∑ �
 Units:
 , = � Hours of effort per dollar of ability
 0
13 Using Social Burden for Distribution System Planning

 Motivation: How do we take critical
 infrastructure locations in an area and figure out
 optimal locations for microgrids or other
 resilience investments?

 Goal: Choose distributed resilience investments
 that keep critical community services online
 during emergency events when the grid is down

 Community: Ensure microgrids are distributed
 so residents have access based on both location
 and economic means
14 ReNCAT
 • Resilient Node Cluster Analysis Tool
 • Developed at Sandia National Laboratories under DOE funding

 Version 1 Version 2
 • Calculation-based tool • Optimization tool
 • Divides area into grid and sums up service • Uses distribution system layout and identifies
 points in each cell to determine potential which sub feeders to energize based on critical
 microgrid locations infrastructure locations and services
 • Only considers locations of critical • Calculates burden to residents to obtain critical
 infrastructure and provided services services
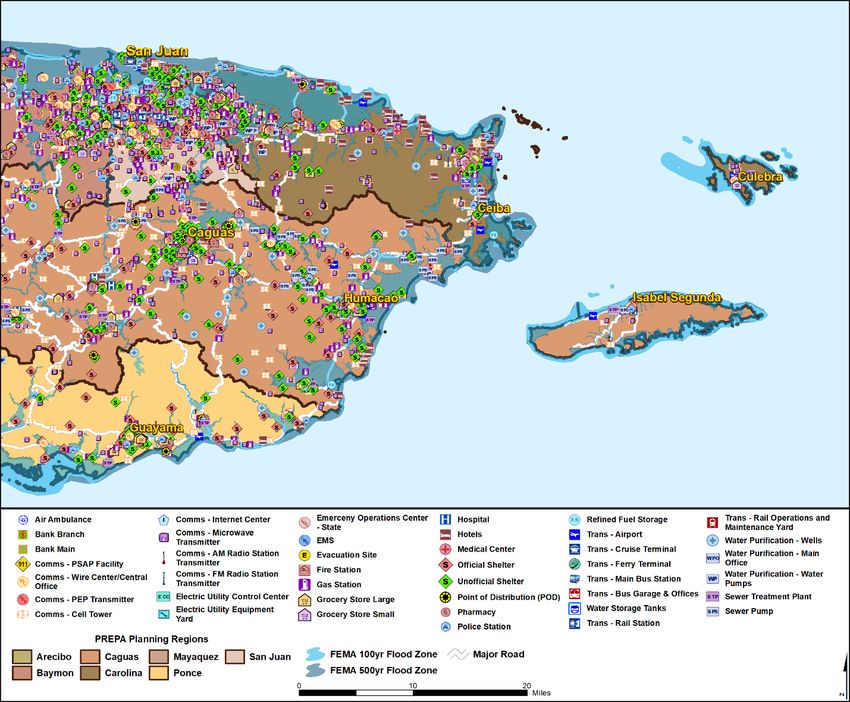
2
15 ReNCAT in Puerto Rico
 ◦ During the phase 1 PR recovery effort in 2018, Sandia
 developed and demonstrated a process for siting and
 roughly sizing/costing microgrids with a focus on social
 burden.

 ◦ The phase 1 work furthered development of and utilized 3
 ReNCAT 1.2 – an open-use tool that suggests clusters of
 assets that provides these services.

 ◦ In 2020, Sandia developed ReNCAT 2.0, which is intended
 to become an open-source environment for optimal
 distribution system investment planning

 1
 4
 Social Burden
 ,
 = � �

 inf = infrastructure service
 categories
 pop = population groupings (census
 block groups)

Jeffers et al. (2018) Analysis of Microgrid Locations Benefitting Community Resilience for Puerto Rico. SAND2018-11145
16 Process (ReNCAT 1.2 to 2.0)
 ◦ ReNCAT 1.2 was released “open use” after the 2018 Puerto Rico Phase 1 work. The ReNCAT 1.2 workflow involved a
 heavy amount of manual effort to develop smart/cost-effective portfolios for social burden. It also became difficult
 to explicitly consider how existing grid topology would impact the design and siting of microgrids.

 4. Site and 5. Social 6. Microgrid
 3. ReNCAT 7. Results
 size all burden portfolio
 1.2 visualization
 microgrids evaluation development
 1. Data 2. Data
 acquisition manipulation West End
 Lakefront Arena
 Hayne Blvd

 Chef Menteur and Read Blvd

 Gentilly Woods

 Pauger

 St. Bernard and Gentilly

 Mid City

1. Raw distribution 1. “Subcircuit” layer, N Claiborne and Elysian Fields

 Treme
 St Claude

 Bywater

 infrastructure includes non-critical load Carrollton Dublin
 Notre Dame
 Canal

 Algiers General Meyer

2. Raw critical 2. Switch layer, includes
 Bolivar and Jackson

 St Charles and Louisiana
 Lower Garden

 Magazine Uptown

 infrastructure assets switch CapEx
3. Raw buildings data 3. Critical Infrastructure
4. Raw census and layer, includes critical
 American Community load
 Survey data 4. Census Block Group
5. Raw threat/hazard layer, includes 3. ReNCAT 2.0
 data population and
 household income

 Design and run optimization Explore results and generate insight
 (ReNCAT core) (ReNCAT MAVIS)
17 Algorithms
◦ ReNCAT 1.2 used simple linear algebra to suggest microgrid
 locations
◦ ReNCAT 2.0 uses a genetic algorithm (JEGA) wrapping a
 heuristic-driven model that utilizes the social burden
 calculation as a core evaluator
◦ Each candidate solution is defined by the status of all
 switches in the system during outage conditions
◦ Heuristics to look at all resulting “potential islands” and
 decide whether to add generation (thereby forming a
 microgrid)
◦ Can give the optimizer an option to disconnect non-critical
 and critical loads (often at a cost)
◦ Each candidate solution evaluated in two dimensions: cost
 and social burden

 Effort
 Time and money Social Burden
 applied to acquiring ,
 services
 = � �

 Ability
 inf = infrastructure service categories
 Median population pop = population groupings (census block groups)
 statistics for census
 block group
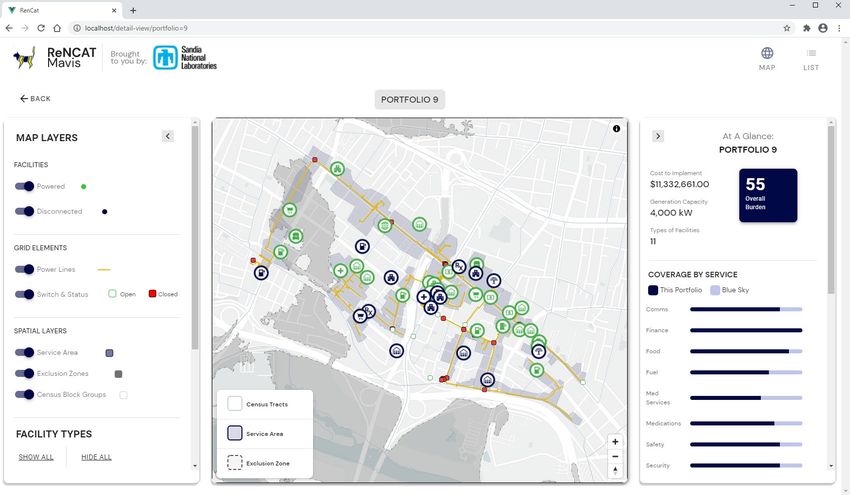
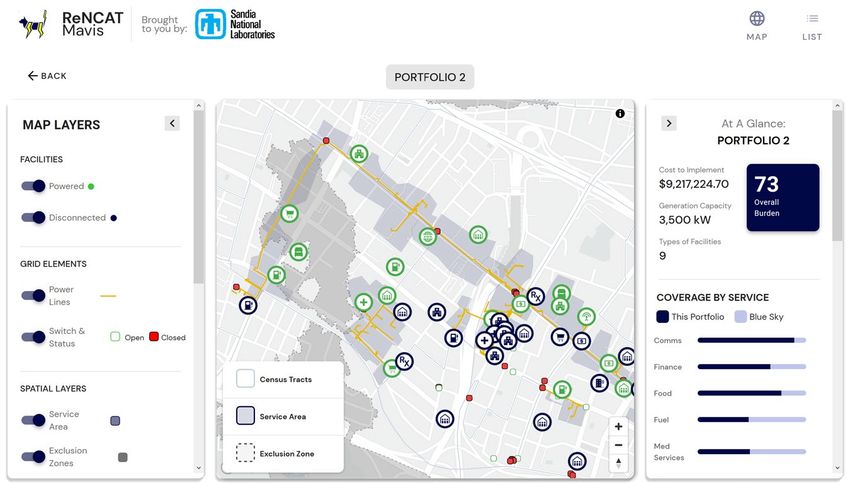
18 Interactive Results
• The solution viewer
 shows the details of
 each portfolio
 including:
 • Social Burden
 • Cost
 • Number of
 microgrids
 • Position of every
 switch and any
 associated costs for
 that configuration
 • Facilities supported
 and not supported
19 Validating, Applying, Socializing
 Validate Socialize
 1. Data: Do we have the data
 to calculate social burden
 ex post?
 2. Surveying: What data can
 we receive directly from
 those impacted?
 3. Mod/Sim: Improve DRC Stakeholder Advisory Group:
 • New York + ConEd
 connection between theory • Los Angeles + LADWP
 and calculation • Norfolk + Dominion Energy
 • Boston + Eversource
 Apply •
 •
 Honolulu + HECO
 San Antonio + CPS Energy
 • National Association of Utility Regulatory
 Commissioners (NARUC)

 Current:
 Puerto Rico (3 x)
 San Antonio

 Future:
 Texas
 New Mexico
Thank you!

 Questions?
 Bobby Jeffers
 Renewable and Distributed Systems Integration
 Sandia National Laboratories
 P.O. Box 5800 MS1033
 Albuquerque, NM 87185-1033
 Phone: 505-379-3129
 rfjeffe@sandia.gov
Backup Material
22 Next Steps and Discussion

 ReNCAT 2.0 provides a unique capability to design distribution systems for optimal
 community resilience benefit, but we are just scratching the surface
 ◦ Efficiency of work flow: streamline the input and model setup
 ◦ Efficiency of algorithms: scalability requires more testing
 ◦ From “tool” to software: several avenues (CRADA, university partners, etc.)
 ◦ Continue to refine the social burden calculation
 ◦ Incorporate additional resilience metrics (e.g. using ReAcct, future GMLC-ERMA product, etc.)
 ◦ Incorporate blue sky optimization
 ◦ Integrate with power flow solvers
 ◦ Improve ease of handoff to MDT

 Long-term, we see the need for a suite of tools to co-optimize and cover a broad range of
 distribution system planning challenges:
 ◦ Integration of resilience with other goals (affordability, renewable penetration, etc.)
 ◦ Expansion of resilience evaluations in other consequence categories
 ◦ Integration of reliability-focused planning and historic grid data (e.g. OMS data)
 ◦ Thermal systems (e.g. district heating and cooling, inclusion of simple building models)
 ◦ Building technologies (e.g. BEMS)
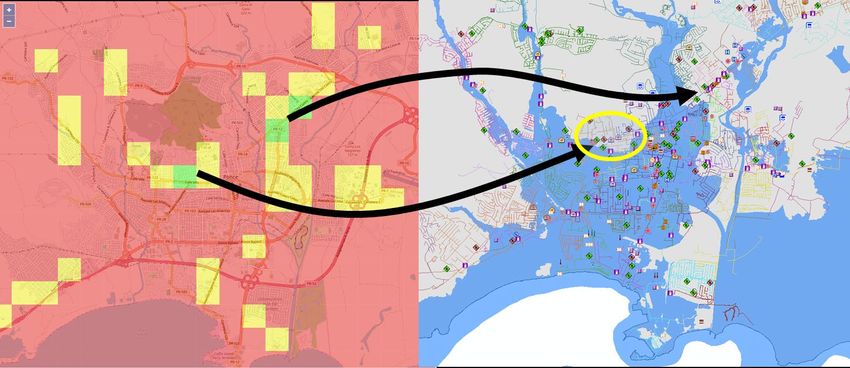
23 Demo problem
◦ Five feeders in central
 San Juan, PR (four on
 one substation, one on
 another)
◦ Flooding hazard along
 the west edge of the
 study area
◦ Mix of residential and
 commercial buildings
◦ Two main clusters of
 buildings with services,
 but some services more
 scattered
24 ReNCAT Portfolio Viewer
 Estimated Cost (switching
 plus generation), Capacity,
 and Coverage

 Switch locations and
 Associated Services
WebEx Tip

 Option 1:
 Access the written
 Q&A panel here

 Option 2:

Discussion and Q&A 1. Click here to access
 the attendee list to raise
 and lower your hand.

 2. Raise your hand by
 clicking the hand icon.

 3. Lower it by clicking
 again.

California Public Utilities Commission 20
Upcoming Meetings

 • Thursday, July 1, 2021, 2-4PM
 Topic: Value of Resiliency – Pillar 4: Resiliency Assessment Post-
 disruption; additional presentations TBD

 • Thursday, July 15, 2021, 2-4PM
 Topic: Value of Resiliency – Pillar 4: Resiliency Assessment Post-
 disruption; additional presentations TBD

California Public Utilities Commission 21
Rosanne.Ratkiewich@cpuc.ca.gov
 Julian.Enis@cpuc.ca.gov
 https://www.cpuc.ca.gov/resiliencyandmicrogrids/

California Public Utilities Commission
You can also read