Resources Leadership 2021 - Board and Executive Remuneration Guide with key management insights for Australian (ASX) listed mining, oil and gas ...
←
→
Page content transcription
If your browser does not render page correctly, please read the page content below
Resources Leadership 2021
 Board and Executive Remuneration Guide with key management
insights for Australian (ASX) listed mining, oil and gas companies
RESOURCES LEADERSHIP 2021

Table of Contents

INTRODUCTION                                                                    ....3
Explanatory Notes                                                               ….6

MINING & METALS
Non-Executive Chairman                                                           ….8
Non-Executive Director                                                           ….8
Chief Executive Officer                                                          ....9
Chief Financial Officer                                                          ....9
Head of Operations                                                             ....10
Business Development                                                           ....10
Company Secretary                                                              ....11
Corporate Counsel                                                              ....11
Technical and Geoscience                                                       ....12
People, Community and Sustainability                                           ....12
Project Delivery                                                               ….13

OIL & GAS
Non-Executive Chairman                                                         ….14
Non-Executive Director                                                         ….14
Chief Executive Officer                                                        ....15
Chief Financial Officer                                                        ....15
Head of Operations                                                             ....16
Business Development                                                           ....16
Corporate Counsel                                                              ....17
Technical and Geoscience                                                       ....17

APPENDIX
Contact Details                                                                 …18

                                       EXECUTIVE SEARCH AND LEADERSHIP ADVISORY / 2 /
RESOURCES LEADERSHIP 2021
Resources Leadership 2021
In March last year, we were facing the deepest recession in over a decade. In a
matter of weeks markets bounced back into the most extraordinary bull market in
history, supercharged by record central bank liquidity.
In last year’s update, AltoPartners weighed the impact of monetary policy on the
mining sector and its impact on remuneration levels. We considered three possible
scenarios: inflation, deflation and a ‘tight rope’ between the two. Just over 12
months later, it is fair to say that we are still walking a tight rope. Inflationary
pressure seems to be mounting for business and consumers, yet central banks
remain convinced of its transitory nature. The lag in data means we will need to
wait 6-12 months to get a clearer picture. Richard Fortune
Managing Partner
General wage growth remains muted. The Wage Price Index in Australia rose just AltoPartners Australia
0.6 per cent in the last quarter and 1.5 per cent over the year. Anecdotally though, +61 407 046 506
some sectors are experiencing acute talent shortages. With borders closed and +61 2 8007 5813
immigration restricted, poaching and counter-offers are rife, and we should see this r.fortune@altopartners.com
come through official statistics over the coming quarters.
Mining has not been immune from talent shortages and acceleration in wages. After the pandemic hit, the brief dip in
commodity prices and quarantine restrictions saw many operations limited, suspended and some even put on care
and maintenance. Most of these have now restarted, and we are experiencing a synchronized boom across mineral
commodities.
While many industry pundits are following the ‘post-GFC playbook’, this boom is very different to that of a decade ago.
In a recent ‘Industry Pulse’ survey of mining industry leaders, we noted the following trends:
Majors are restrained
The majors are enjoying the returns from projects built in the last boom. They are much less leveraged than a decade
ago, but cautious of the surge in commodity prices. The majors are also using conservative commodity price forecasts
for evaluating new greenfield projects and new acquisitions.
Exploration is booming
Minerals exploration is booming; meters drilled and dollars spent in the ground are at near record levels according to
the latest data from the Australian Bureau of Statistics. Printed money and wild speculation has driven market
capitalisation of some mineral explorers to extraordinary levels, well beyond the sensible price forecasts of any majors
they are hoping to deal with. Meanwhile, the green energy thematic has left oil and gas explorers behind; many are
now reinventing themselves around emerging applications of hydrogen.
Mid-tiers are hungry
Most mergers and acquisitions activity is coming from mid-tiers, hungry to replenish and grow their resources and
reserves with late-stage exploration and development projects. While mid-tiers have a greater risk profile than the
majors, they are generally limiting themselves to controllable risks like technology and execution risk, rather than
sovereign risk or commodity markets. Large deposits in safe jurisdictions like Australia, Canada and USA are high on
everyone’s list, and the premia attached to such projects is forcing companies to look at difficult deposits through new
technological lenses.
Private equity is back
Much of the mining private equity world is still licking its wounds from a prolonged downturn, however some funds
have emerged with success. New ambitious funds are being deployed, this time with greater scrutiny, oversight and
step-in rights to leadership teams.
EXECUTIVE SEARCH AND LEADERSHIP ADVISORY / 3 /RESOURCES LEADERSHIP 2021
Consultants are stretched
Over 40 per cent of consulting firms have experienced a sharp increase in workload, just in the last six months. Half of
these are struggling to keep up with the workload. They have been particularly busy with due diligence, technical
reviews and exploration consulting, particularly across copper, base metals and battery metals. Many of the projects
under evaluation are progressing to the next stage. Over 85 percent of consulting firms anticipate increased workload
over the coming year.
Acute skill shortages on site
The perennial issue of attracting good people to site has been further exacerbated through border closures and
immigrations restrictions. Offshore operations have suffered from expats returning home. These returning expats have
taken some pressure off our domestic market, but state borders have impeded fly-in fly-out workers. Sites are
chronically short of experienced technical professionals and trades, and they are particularly exposed around statutory
ticket holders. Consultants and contractors are covering gaps – some across multiple sites. Remote Operating Centers
and automation are helping somewhat, but not to the extent that our digital evangelists would have had us believe.
Wages costs on sites are increasing rapidly.
Corporate expanding
While we are not back to the heady days of 2011, we are seeing expansion of corporate teams as they add more grunt
to their business development, exploration and technical capability. We are not yet at the point of the cycle where
growth teams are perversely incentivised to latch on to marginal projects, but that point will inevitably come. At that
point, we expect a surge in recruitment of feasibility and project development teams as these projects pass
investment stage gates. For now, companies can be fairly selective in the recruitment of corporate teams, and wage
pressure is fairly contained.
Leadership scarcity
There are many willing candidates for leadership roles, which has alleviated some of the inflationary pressure on
executive remuneration. However, the surplus of willing candidates should not mask the scarcity of suitable
leadership. Those with requisite track records and leadership capacity are increasingly weighing multiple offers. This
has been particularly apparent in General Manager, Chief Operating Officer and Chief Executive Officer searches
where domain expertise is critical, and remuneration is under pressure. That said, bonuses are being paid, shares are
increasing, and options are in the money, which has provided an alternative to the steep pay rises we anticipated in
our update last year.
Functional roles such as the Chief Financial Officer, have been alleviated by talent transfer from other sectors though
experienced industry leaders within these functions still command a premium.
Boards likewise have not been subject to the same remuneration pressure. Firstly, there are many willing participants,
though few are chosen. Secondly, the board cohort are less motivated by monetary reward, and more by contribution.
Finally, board remuneration is generally limited by shareholder approved fee pools, so is less subject to negotiation.
The underutilised cohort
Meanwhile, there is a cohort of mining professionals in the later stages of their career who remain underutilised. They
may be called up for desktop reviews, or occasional coverage, but they have capacity to give much more. Perhaps they
are too cantankerous for a three-year board commitment, or their operational knowledge may be out of date. More
likely though, they have just been forgotten. AltoPartners would be very happy to reconnect those seeking talent with
some of these doyens.
More women needed
Given the industry’s progress, it is disappointing to see the percentage of women on boards go backwards slightly this
year; the number of women has stagnated as the number of companies in the dataset have grown.
The business case for women at the top has been well established. Almost every board and executive search we
conduct reflects this. We see almost universal demand for women on boards and in leadership. We need more women
coming through senior management, board ready.
EXECUTIVE SEARCH AND LEADERSHIP ADVISORY / 4 /RESOURCES LEADERSHIP 2021
In this regard, it is encouraging to see more women in functional leadership roles, in legal, corporate affairs, human
resources, sustainability and environment. We still need more women in operational and technical leadership.
Employers need to provide support and reasonable latitude for them to get board-ready and board-connected.
The year ahead
In summary, the industry is riding an immense tailwind of stimulus, infrastructure spending and rotation into
renewables. Regardless of inflation or deflation, and even with a change of gears from China, the tailwind looks
unlikely to subside yet, and mining leaders and professionals will continue to be well-rewarded.
I look forward to working with many of you and helping you secure success in the coming months and years ahead.
Sincerely,
Richard Fortune
Managing Partner
AltoPartners Australia
EXECUTIVE SEARCH AND LEADERSHIP ADVISORY / 5 /RESOURCES LEADERSHIP 2021
Explanatory Notes
This report is a simple benchmark guide for our clients and candidates, with ASX mining, oil and gas company
remuneration data aggregated by function and market capitalisation. The quality of data and the report is continually
evolving and we value your feedback and insights.
Definitions
Fixed Remuneration
Fixed Remuneration includes base salary, superannuation and any packaged benefits, but excludes long service leave.
The figures in this report are the mean of each market cap range and function.
Variable Remuneration
Variable Remuneration includes options and performance rights vested, shares issued and any performance-based
bonuses. Figures are the accounting valuations of short and long-term incentives recorded in the annual reports.
Total Remuneration
Fixed Remuneration plus Variable Remuneration.
At-Risk
Percentage Variable Remuneration of Total Remuneration.
Age
Average age of executives, by function
Tenure
Average years of executives in current role, by function.
Female
Percentage of females, by function.
Board Seat
Percentage of Chief Executives who are also Managing Directors.
Typical Background
Parsed from biography and post-nominals. Most common background, by function.
Independent
Percentage of Non-Executive Directors or Chairs who are nominally independent.
Data Notes
▪ Aggregated data for all mineral producers, developers and explorers listed on the ASX as of 28 February 2021:
▪ All remuneration figures quoted are averages in AUD, with market capitalisation ranges also in AUD
▪ AUD equivalent has been converted at 0.75 USD and 0.55 GBP
▪ Functions have been allocated by algorithmic analysis of biography and title
▪ Functions with insufficient data points have been omitted
▪ Remuneration data sourced from most FY2019 and FY2020 Annual Reports, Notice of General Meetings,
appointment announcements and proprietary data
▪ Variable remuneration is based off reported accounting value of short and long-term incentives, averaged
across number of vesting years.
▪ Data includes all mining, oil and gas companies listed on ASX, including new IPOs.
▪ Market capitalisation of companies was recorded as of 28 February 2021
▪ Interim executives, executives with less than full-year tenure and executive directors with abnormal
remuneration profiles have generally been excluded from data aggregation.
EXECUTIVE SEARCH AND LEADERSHIP ADVISORY / 6 /RESOURCES LEADERSHIP 2021
▪ Directors on less than $20K AUD in fees and Executives on less than $120K in full-time equivalent Fixed
Remuneration have been excluded from data aggregation on the basis that it is impossible to attract, retain or
motivate below this level.
▪ Director’s Fixed Rem include director fees, additional committee fees, pensions and allowances.
▪ Smaller companies, typically in the 1-10M range, may use part-time executives. These have generally been
excluded from our data set.
▪ Where incumbents hold more than one function, they have been listed under their highest paying office.
▪ Non-executive directors in smaller companies sometimes do consulting work for the same company, especially
where executives have been made redundant. This may augment aggregate director fees for the smaller cap
companies. Any additional committee fees for directors have been aggregated in fixed remuneration.
▪ Results may be skewed by smaller data sets. We have not included functions with less than 10 data points.
Disclaimer
This report provides aggregated remuneration data derived from recent company announcements and Annual
Reports, which are at times inaccurate or misrepresentative. The broad aggregation by market capitalization and
function, may not represent a suitable peer group of companies and individuals. If your board requires a formal
appraisal against a suitable peer group, please contact us to discuss your needs.
The information contained within should not be considered remuneration advice. AltoPartners provides peer
benchmarking and independent reviews separately, and we refer our clients to third party remuneration consultants
for remuneration and incentive design. You should seek legal, accounting, and tax advice in your jurisdiction, before
taking (or not taking) any action.
Copyright
This report and the information within it is property of AltoPartners Australia (AP Search Pty Ltd). This report may be
quoted with written permission and acknowledgement of AltoPartners, however the report may not be reproduced or
sold, in part or in whole.
AltoPartners
AltoPartners is a leading global executive search and leadership consulting alliance. For more information please go to
our global website www.altopartners.com
EXECUTIVE SEARCH AND LEADERSHIP ADVISORY / 7 /MINING & METALS
Non-Executive Chair
Includes independents and non-independents, and excludes executive Chair
600,000
Key Insights
Average Age 59
500,000
Average Tenure 4.6
Female 3.3%
400,000 Independent 25%
300,000 Variable Rem. Typical Background
Geoscience
Fixed Rem.
Mining
200,000
Accounting
100,000
-
1-10M 10-100M 100-1000M 1000M+
Market Cap. Fixed Rem. Variable Rem. Total Rem. At-Risk
1-10M 64,000 11,000 75,000 15%
10-100M 95,000 45,000 140,000 32%
100-1000M 172,000 25,000 197,000 13%
1000M+ 486,000 - 486,000 0%
All 108,000 25,000 133,000 19%
Non-Executive Director
Includes independents and non-independents.
250,000
Key Insights
Average Age 58
200,000 Average Tenure 4.2
Female 7.8%
Independent 27%
150,000
Variable Rem. Typical Background
Geoscience
100,000 Fixed Rem.
Accounting
Mining
50,000
-
1-10M 10-100M 100-1000M 1000M+
Market Cap. Fixed Rem. Variable Rem. Total Rem. At-Risk
1-10M 54,000 15,000 69,000 22%
10-100M 70,000 34,000 104,000 33%
100-1000M 104,000 20,000 124,000 16%
1000M+ 201,000 9,000 210,000 4%
All 77,000 23,000 100,000 23%
Mean figures by market capitalisation range. All figures in Australian Dollars (AUD).
EXECUTIVE SEARCH AND LEADERSHIP ADVISORY / 8 /MINING & METALS
Chief Executive Officer
Includes Managing Director but excludes Executive Chairman and Executive Director
4,000,000
Key Insights
3,500,000 Age 53
Tenure 3.9
3,000,000 Female 2.9%
Board Seat 70%
2,500,000
2,000,000 Variable Rem. Typical Background
Geoscience
Fixed Rem.
1,500,000 Mining
Accounting
1,000,000
500,000
-
1-10M 10-100M 100-1000M 1000M+
Market Cap. Fixed Rem. Variable Rem. Total Rem. At-Risk
1-10M 243,000 46,000 289,000 16%
10-100M 346,000 144,000 490,000 29%
100-1000M 571,000 529,000 1,100,000 48%
1000M+ 1,371,000 1,985,000 3,356,000 59%
All 397,000 264,000 661,000 40%
Chief Financial Officer
Includes Finance Director, and Chief Financial Officers with a dual role of Company Secretary
2,000,000
Key Insights
1,800,000 Average Age 48
1,600,000 Average Tenure 3.9
Female 9.9%
1,400,000
1,200,000 Typical Background
1,000,000 Variable Rem. Accounting
Finance
800,000 Fixed Rem.
Commerce
600,000
400,000
200,000
-
1-10M 10-100M 100-1000M 1000M+
Market Cap. Fixed Rem. Variable Rem. Total Rem. At-Risk
1-10M 221,000 32,000 253,000 13%
10-100M 276,000 69,000 345,000 20%
100-1000M 380,000 281,000 661,000 43%
1000M+ 762,000 956,000 1,718,000 56%
All 352,000 221,000 573,000 39%
Mean figures by market capitalisation range. All figures in Australian Dollars (AUD).
EXECUTIVE SEARCH AND LEADERSHIP ADVISORY / 9 /MINING & METALS
Head of Operations
Includes EGM Operations, Chief Operating Officer, Director of Operations, Group GM Operations, and GM Operations for single asset companies.
2,000,000
Key Insights
1,800,000
Average Age 52
1,600,000 Average Tenure 3.9
1,400,000
Female 1.4%
1,200,000 Typical Background
1,000,000 Variable Rem. Mining
Processing
800,000 Fixed Rem.
Geoscience
600,000
400,000
200,000
-
1-10M 10-100M 100-1000M 1000M+
Market Cap. Fixed Rem. Variable Rem. Total Rem. At-Risk
1-10M 192,000 31,000 223,000 14%
10-100M 314,000 87,000 401,000 22%
100-1000M 401,000 192,000 593,000 32%
1000M+ 738,000 1,012,000 1,750,000 58%
All 411,000 273,000 684,000 40%
Business Development
Includes Investor Relations, M&A, Business Analysts, Commercial executives
1,200,000
Key Insights
Average Age 50
1,000,000
Average Tenure 3.6
Female 5.8%
800,000
Typical Background
600,000 Variable Rem. Commerce
Finance
Fixed Rem.
Geoscience
400,000
200,000
-
1-10M 10-100M 100-1000M 1000M+
Market Cap. Fixed Rem. Variable Rem. Total Rem. At-Risk
1-10M 164,000 35,000 199,000 18%
10-100M 202,000 93,000 295,000 32%
100-1000M 321,000 142,000 463,000 31%
1000M+ 631,000 509,000 1,140,000 45%
All 399,000 266,000 665,000 40%
Mean figures by market capitalisation range. All figures in Australian Dollars (AUD).
EXECUTIVE SEARCH AND LEADERSHIP ADVISORY / 10 /MINING & METALS
Company Secretary
Excludes dual role Chief Financial Officers
800,000
Key Insights
700,000 Average Age 51
Average Tenure 4.4
600,000 Female 21.5%
500,000
Typical Background
400,000 Variable Rem. Accounting
Legal
Fixed Rem.
300,000 Commerce
200,000
100,000
-
1-10M 10-100M 100-1000M 1000M+
Market Cap. Fixed Rem. Variable Rem. Total Rem. At-Risk
1-10M 78,000 11,000 89,000 12%
10-100M 114,000 18,000 132,000 14%
100-1000M 122,000 16,000 138,000 12%
1000M+ 432,000 306,000 738,000 41%
All 109,000 27,000 136,000 20%
Corporate Counsel
Includes heads of legal counsel and corporate affairs
1,200,000
Key Insights
Average Age 48
1,000,000 Average Tenure 3.8
Female 38.3%
800,000
Typical Background
600,000 Variable Rem. Accounting
Legal
Fixed Rem.
Commerce
400,000
200,000
-
10-100M 100-1000M 1000M+
Market Cap. Fixed Rem. Variable Rem. Total Rem. At-Risk
10-100M 262,000 95,000 357,000 27%
100-1000M 387,000 246,000 633,000 39%
1000M+ 565,000 487,000 1,052,000 46%
All 422,000 296,000 718,000 41%
Mean figures by market capitalisation range. All figures in Australian Dollars (AUD).
EXECUTIVE SEARCH AND LEADERSHIP ADVISORY / 11 /MINING & METALS
Technical and Geoscience
Includes Heads of Geology and Exploration, Mining Engineering, Metallurgy, Study Managers, Engineering and Technical Directors.
900,000
Key Insights
800,000 Average Age 49
700,000 Average Tenure 5.9
Female 5.5%
600,000
Typical Background
500,000
Variable Rem. Geoscience
400,000 Mining
Fixed Rem.
Processing
300,000
200,000
100,000
-
1-10M 10-100M 100-1000M 1000M+
Market Cap. Fixed Rem. Variable Rem. Total Rem. At-Risk
1-10M 216,000 23,000 239,000 10%
10-100M 256,000 73,000 329,000 22%
100-1000M 301,000 202,000 503,000 40%
1000M+ 460,000 357,000 817,000 44%
All 264,000 95,000 359,000 26%
People, Community and Sustainability
Includes Heads of: Human Resources, Health and Safety, Community and Environment, Sustainability
1,000,000
Key Insights
900,000
Average Age 48
800,000 Average Tenure 3.8
700,000
Female 35.4%
600,000 Typical Background
500,000 Variable Rem. Commerce
Environmental
400,000 Fixed Rem.
Science
300,000
200,000
100,000
-
1-10M 10-100M 100-1000M 1000M+
Market Cap. Fixed Rem. Variable Rem. Total Rem. At-Risk
1-10M 181,000 18,000 199,000 9%
10-100M 253,000 - 253,000 0%
100-1000M 337,000 181,000 518,000 35%
1000M+ 484,000 454,000 938,000 48%
All 366,000 243,000 609,000 40%
Mean figures by market capitalisation range. All figures in Australian Dollars (AUD).
EXECUTIVE SEARCH AND LEADERSHIP ADVISORY / 12 /MINING & METALS
Project Delivery
Includes Head of Engineering, Project Directors and Project Managers
800,000
Key Insights
700,000 Average Age 46
Average Tenure 4.6
600,000 Female 1.4%
500,000
Typical Background
400,000 Variable Rem. Engineering
Processing
Fixed Rem.
300,000 Mining
200,000
100,000
-
1-10M 10-100M 100-1000M 1000M+
Market Cap. Fixed Rem. Variable Rem. Total Rem. At-Risk
1-10M 189,000 14,000 203,000 7%
10-100M 302,000 76,000 378,000 20%
100-1000M 350,000 385,000 735,000 52%
1000M+ 532,000 166,000 698,000 24%
All 310,000 123,000 433,000 28%
Mean figures by market capitalisation range. All figures in Australian Dollars (AUD).
EXECUTIVE SEARCH AND LEADERSHIP ADVISORY / 13 /OIL & GAS
Non-Executive Chair
Includes independents and non-independents.
500,000
Key Insights
450,000
Average Age 64
400,000 Average Tenure 4.8
350,000
Female 0%
Independent 34%
300,000
250,000 Variable Rem. Typical Background
Geoscience
200,000 Fixed Rem.
Accounting
150,000 Finance
100,000
50,000
-
1-10M 10-100M 100-1000M 1000M+
Market Cap. Fixed Rem. Variable Rem. Total Rem. At-Risk
1-10M 73,000 17,000 90,000 19%
10-100M 111,000 25,000 136,000 18%
100-1000M 147,000 56,000 203,000 28%
1000M+ 448,000 - 448,000 0%
All 143,000 24,000 167,000 14%
Non-Executive Director
Includes independents and non-independents.
300,000
Key Insights
Average Age 60
250,000
Average Tenure 4.2
Female 12.3%
200,000 Independent 37%
150,000 Variable Rem. Typical Background
Geoscience
Fixed Rem.
Accounting
100,000 Finance
50,000
-
1-10M 10-100M 100-1000M 1000M+
Market Cap. Fixed Rem. Variable Rem. Total Rem. At-Risk
1-10M 75,000 12,000 87,000 14%
10-100M 78,000 8,000 86,000 9%
100-1000M 97,000 17,000 114,000 15%
1000M+ 253,000 - 253,000 0%
All 116,000 9,000 125,000 7%
Mean figures by market capitalisation range. All figures in Australian Dollars (AUD).
EXECUTIVE SEARCH AND LEADERSHIP ADVISORY / 14 /OIL & GAS
Chief Executive Officer
Includes Managing Director but excludes Executive Chairman and Executive Director
5,000,000
Key Insights
4,500,000
Average Age 55
4,000,000 Average Tenure 4.6
3,500,000
Female 1.1%
Board Seat 71%
3,000,000
2,500,000 Variable Rem. Typical Background
Geoscience
2,000,000 Fixed Rem.
Petroleum
1,500,000 General Engineering
1,000,000
500,000
-
1-10M 10-100M 100-1000M 1000M+
Market Cap. Fixed Rem. Variable Rem. Total Rem. At-Risk
1-10M 244,000 26,000 270,000 10%
10-100M 418,000 156,000 574,000 27%
100-1000M 633,000 435,000 1,068,000 41%
1000M+ 1,878,000 2,630,000 4,508,000 58%
All 556,000 429,000 985,000 44%
Chief Financial Officer
Includes Finance Director, and dual role Company Secretary
2,000,000
Key Insights
1,800,000 Average Age 48
1,600,000 Average Tenure 3.6
Female 16.7%
1,400,000
1,200,000 Typical Background
1,000,000 Variable Rem. Accounting
Finance
800,000 Fixed Rem.
600,000
400,000
200,000
-
1-10M 10-100M 100-1000M 1000M+
Market Cap. Fixed Rem. Variable Rem. Total Rem. At-Risk
1-10M 235,000 - 235,000 0%
10-100M 311,000 77,000 388,000 20%
100-1000M 371,000 132,000 503,000 26%
1000M+ 887,000 979,000 1,866,000 52%
All 430,000 260,000 690,000 38%
Mean figures by market capitalisation range. All figures in Australian Dollars (AUD).
EXECUTIVE SEARCH AND LEADERSHIP ADVISORY / 15 /OIL & GAS
Head of Operations
Includes COO, EGM Operations for bigger companies and GM Operations for smaller companies.
2,500,000
Key Insights
Average Age 50
2,000,000 Average Tenure 3.7
Female 15.8%
1,500,000 Typical Background
Variable Rem. Geoscience
Petroleum
1,000,000 Fixed Rem.
Accounting
500,000
-
1-10M 10-100M 100-1000M 1000M+
Market Cap. Fixed Rem. Variable Rem. Total Rem. At-Risk
1-10M 230,000 - 230,000 0%
10-100M 422,000 130,000 552,000 24%
100-1000M 524,000 282,000 806,000 35%
1000M+ 1,000,000 987,000 1,987,000 50%
All 591,000 389,000 980,000 40%
Business Development
Includes Investor Relations, M&A, Commercial
1,400,000
Key Insights
1,200,000 Average Age 54
Average Tenure 3.1
1,000,000 Female 4.5%
800,000 Typical Background
Variable Rem. Geoscience
600,000 Petroleum
Fixed Rem.
Accounting
400,000
200,000
-
10-100M 100-1000M 1000M+
Market Cap. Fixed Rem. Variable Rem. Total Rem. At-Risk
10-100M 404,000 85,000 489,000 17%
100-1000M 429,000 336,000 765,000 44%
1000M+ 557,000 658,000 1,215,000 54%
All 458,000 304,000 762,000 40%
Mean figures by market capitalisation range. All figures in Australian Dollars (AUD).
EXECUTIVE SEARCH AND LEADERSHIP ADVISORY / 16 /OIL & GAS
Corporate Counsel
Includes Legal Counsel and Corporate Affairs
1,600,000
Key Insights
1,400,000 Average Age 51
Average Tenure 2.6
1,200,000 Female 35.3%
1,000,000
Typical Background
800,000 Variable Rem. Legal
Commerce
Fixed Rem.
600,000
400,000 *May be skewed by small sample
200,000
-
10-100M 100-1000M 1000M+
Market Cap. Fixed Rem. Variable Rem. Total Rem. At-Risk
10-100M 358,000 74,000 432,000 17%
100-1000M 373,000 146,000 519,000 28%
1000M+ 682,000 727,000 1,409,000 52%
All 444,000 264,000 708,000 37%
Technical and Geoscience
Includes Geology and Exploration, Petroleum Engineering, Study Managers and Technical Directors.
1,200,000
Key Insights
Average Age 54
1,000,000
Average Tenure 5.7
Female 5.6%
800,000
Typical Background
600,000 Variable Rem. Geoscience
Petroleum
Fixed Rem.
General Engineering
400,000
200,000
-
1-10M 10-100M 100-1000M 1000M+
Market Cap. Fixed Rem. Variable Rem. Total Rem. At-Risk
1-10M 165,000 29,000 194,000 15%
10-100M 331,000 - 331,000 0%
100-1000M 357,000 195,000 552,000 35%
1000M+ 421,000 716,000 1,137,000 63%
All 305,000 237,000 542,000 44%
Mean figures by market capitalisation range. All figures in Australian Dollars (AUD)
EXECUTIVE SEARCH AND LEADERSHIP ADVISORY / 17 /OIL & GAS
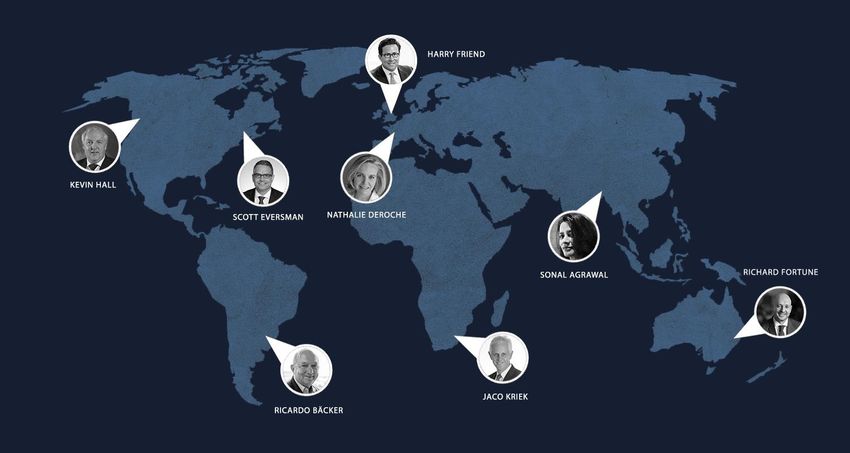
AltoPartners
Leaders in Natural Resources
Founded in 2006, AltoPartners is an alliance of the world’s most highly-regarded executive search and leadership consulting firms.
With 63 offices across 36 countries, we bring global coverage and deep expertise to the natural resources sector.
Key Contacts
Richard Fortune Ricardo Bäcker Nathalie Deroche Harry Friend
Australia & Asia-Pacific Latin America Francophone Africa United Kingdom & Europe
+61 2 8007 5813 +54 11 4590 2623 +33 153 657 400 +44 20 3327 2030
r.fortune@altopartners.com r.backer@altopartners.com n.deroche@altopartners.com h.friend@altopartners.com
Level 26, 1 Bligh St Av. Del Libertador 101 45 rue Boissière 35 Grosvenor St
Sydney NSW 2000 B1638BEK Vicente López Paris London W1K 4QX
Australia Buenos Aires, Argentina F-75116 United Kingdom
Kevin Hall Scott Eversman Sonal Agrawal Jaco Kriek
Canada United States India & Asia Africa & Middle East
+1 587 353 9800 +1 646 329 7421 +91 98338 76758 +27 11 728 0105
k.hall@altopartners.com s.eversman@altopartners.com s.agrawal@altopartners.com j.kriek@altopartners.com
Suite 2800, 350 – 7th Ave S.W. The Chrysler Building 301 Pharma Search House 39 West Street
First Canadian Centre, Calgary 405 Lexington Avenue, Floor 49 Dr. B G Kher Road, Worli Houghton Estate, Johannesburg
Alberta, Canada New York, USA Mumbai 400 018 Gauteng, South Africa
www.altopartners.com
EXECUTIVE SEARCH AND LEADERSHIP ADVISORY / 18 /You can also read