RESPIRATORY VIRAL CO INFECTIONS AMONG SARS COV 2 CASES CONFIRMED BY VIROME CAPTURE SEQUENCING - NATURE
←
→
Page content transcription
If your browser does not render page correctly, please read the page content below

www.nature.com/scientificreports
OPEN Respiratory viral co‑infections
among SARS‑CoV‑2 cases
confirmed by virome capture
sequencing
Ki Wook Kim1,2, Ira W. Deveson3,4, Chi Nam I. Pang5, Malinna Yeang2, Zin Naing2,
Thiruni Adikari6,7, Jillian M. Hammond3, Igor Stevanovski3, Alicia G. Beukers8, Andrey Verich7,
Simon Yin9, David McFarlane9, Marc R. Wilkins5, Sacha Stelzer‑Braid2,6, Rowena A. Bull6,7,
Maria E. Craig1,2,10, Sebastiaan J. van Hal8,11 & William D. Rawlinson1,2,5,6*
Accumulating evidence supports the high prevalence of co-infections among Severe Acute Respiratory
Syndrome Coronavirus 2 (SARS-CoV-2) patients, and their potential to worsen the clinical outcome
of COVID-19. However, there are few data on Southern Hemisphere populations, and most studies
to date have investigated a narrow spectrum of viruses using targeted qRT-PCR. Here we assessed
respiratory viral co-infections among SARS-CoV-2 patients in Australia, through respiratory virome
characterization. Nasopharyngeal swabs of 92 SARS-CoV-2-positive cases were sequenced using
pan-viral hybrid-capture and the Twist Respiratory Virus Panel. In total, 8% of cases were co-infected,
with rhinovirus (6%) or influenzavirus (2%). Twist capture also achieved near-complete sequencing
(> 90% coverage, > tenfold depth) of the SARS-CoV-2 genome in 95% of specimens with Ct < 30. Our
results highlight the importance of assessing all pathogens in symptomatic patients, and the dual-
functionality of Twist hybrid-capture, for SARS-CoV-2 whole-genome sequencing without amplicon
generation and the simultaneous identification of viral co-infections with ease.
Early description of the first 99 COVID-19 cases in Wuhan suggested that co-infections with other respiratory
pathogens were rare1. However, more recent data from Northern California, USA demonstrate that rates of res-
piratory co-infections between SARS-CoV-2 and other respiratory viruses can reach up to 21%2. Furthermore, a
higher prevalence of co-infection is reported among COVID-19 patients with more severe onset of disease3 and
the deceased4, suggesting that co-infections can significantly worsen the clinical outcome of COVID-19. Despite
this evidence supporting the high prevalence of co-infections among SARS-CoV-2 cases and its potentially
substantial clinical impacts on COVID-19, existing data on co-infection remain limited by the low representa-
tion of the global population and the small number of viruses examined. To date, most studies have tested only
a narrow spectrum of viruses using targeted qRT-PCR assays5,6, and only one reported on the co-infection rate
among SARS-CoV-2 cases in the Southern H emisphere7.
Here we measured the rate of respiratory viral co-infection among SARS-CoV-2 cases in Australia, deter-
mined by respiratory virome sequencing (excluding phages) using two commercial hybrid-capture sequencing
platforms: (i) Virome Capture Sequencing (VirCapSeq), a collection of ~ 2 million oligonucleotide probes (70–120
1
School of Women’s and Children’s Health, Faculty of Medicine, University of New South Wales, Sydney, NSW,
Australia. 2Virology Research Laboratory, Serology and Virology Division (SAViD), NSW Health Pathology, Prince
of Wales Hospital, Sydney, NSW, Australia. 3Kinghorn Centre for Clinical Genomics, Garvan Institute of Medical
Research, Sydney, Australia. 4St Vincent’s Clinical School, Faculty of Medicine, University of New South Wales,
Sydney, NSW, Australia. 5School of Biotechnology and Biomolecular Sciences, Faculty of Science, University of
New South Wales, Sydney, NSW, Australia. 6School of Medical Sciences, Faculty of Medicine, University of New
South Wales, Sydney, NSW, Australia. 7The Kirby Institute for Infection and Immunity, University of New South
Wales, Sydney, NSW, Australia. 8Department of Infectious Diseases and Microbiology, NSW Health Pathology,
Royal Prince Alfred Hospital, Sydney, NSW, Australia. 9Research Technology Services, Research Infrastructure
Division, University of New South Wales, Sydney, NSW, Australia. 10Institute of Endocrinology and Diabetes, The
Children’s Hospital At Westmead, Sydney, NSW, Australia. 11Central Clinical School, University of Sydney, Sydney,
NSW, Australia. *email: w.rawlinson@unsw.edu.au
Scientific Reports | (2021) 11:3934 | https://doi.org/10.1038/s41598-021-83642-x 1
Vol.:(0123456789)
www.nature.com/scientificreports/
Figure 1. Viruses detected in SARS-CoV-2 case specimens by two hybrid-capture sequencing approaches.
(a) VirCapSeq (n = 92); and (b) Twist Respiratory Virus Panel (n = 83). Heatmap of viral reads in log scale and
represented at the genus level. Sample IDs apply for both panels (a) and (b), indicating overlapping samples
sequenced by both approaches. Horizontal line separates respiratory viruses (above) from non-respiratory
viruses (below). Bar charts indicate number of viruses detected per specimen. nCoV_neg_1 & 2 are clinical
control specimens from two individuals confirmed negative for SARS-CoV-2 by qRT-PCR.
mers) targeting all known vertebrate-infecting viruses from Roche Sequencing8; and (ii) Twist Respiratory Virus
Panel, consisting of 41,047 probes (120 mers) targeting 29 human respiratory viruses representing six major
pathogenic viral clades, from Twist Biosciences. Furthermore, we evaluated the feasibility of simultaneously
performing SARS-CoV-2 whole genome sequencing (WGS) analysis using data generated from both meth-
ods. This demonstrated the utility of such a process, and greater WGS coverage achieved using hybrid-capture
sequencing over existing amplicon-based procedures in situations where primer binding sites are abolished by
genomic deletions.
Results
Rate of viral co‑infection in Australian cases. We examined the respiratory virome of 92 SARS-CoV-2
cases who tested positive for SARS-CoV-2 RNA between March and May 2020 in New South Wales (NSW),
Australia (Supplementary Table 1). The abundance of SARS-CoV-2 RNA in the respiratory specimens obtained
from these cases was diverse, with qRT-PCR cycle threshold (Ct) values ranging between 13.3 and 39.7. This
was equivalent to a viral load range between 1.4 × 10⁸ copies/mL and less than 10 copies/mL (Supplementary
Table 2). Sequencing all vertebrate-infectious viruses in these specimens using VirCapSeq hybrid-capture gener-
ated a total of 982 million raw reads, an average of 3.6 million adapter/host filtered reads per sample.
Overall, 47 species of viruses belonging to 17 different genera were detected with a minimum of 20 virus-clas-
sified reads per million (rpM; Supplementary File 1; Fig. 1a). None of these viruses were detected in the negative
controls (SSC_1 and SSC_2), ruling out laboratory contamination or index switching as a source of spurious virus
detection (Fig. S1a). SARS-CoV-2 reads above the positivity threshold were detected in 80% of samples (74/92), of
which the highest Ct was 39.7. No SARS-CoV-2 reads were detected in the coronavirus-negative clinical controls
(nCoV_neg_1 and _2; Fig. 1a). Among other respiratory viruses, picornaviruses (all of which were rhinoviruses)
were detected in 5% (5/92) of cases and in nCoV_neg_1, and influenzavirus A in 2% (2/92) of cases. Consistent
with our published data in other cohorts9–11, the non-respiratory viruses detected included mammarenaviruses
(41%), roseoloviruses (36%), alphapolyomaviruses (35%), papillomaviruses (20%), lymphocryptoviruses (12%),
lentivruses (9%), anelloviruses (3%), simplexviruses (3%), pestiviruses (3%), mastadenovirus (1%) and norovirus
(1%). Overall, sequences of viruses other than SARS-CoV-2 were detected in 74% (68/92) of cases, and the rate
of co-infection between SARS-CoV-2 and other respiratory viruses was 8% (7/92).
Scientific Reports | (2021) 11:3934 | https://doi.org/10.1038/s41598-021-83642-x 2
Vol:.(1234567890)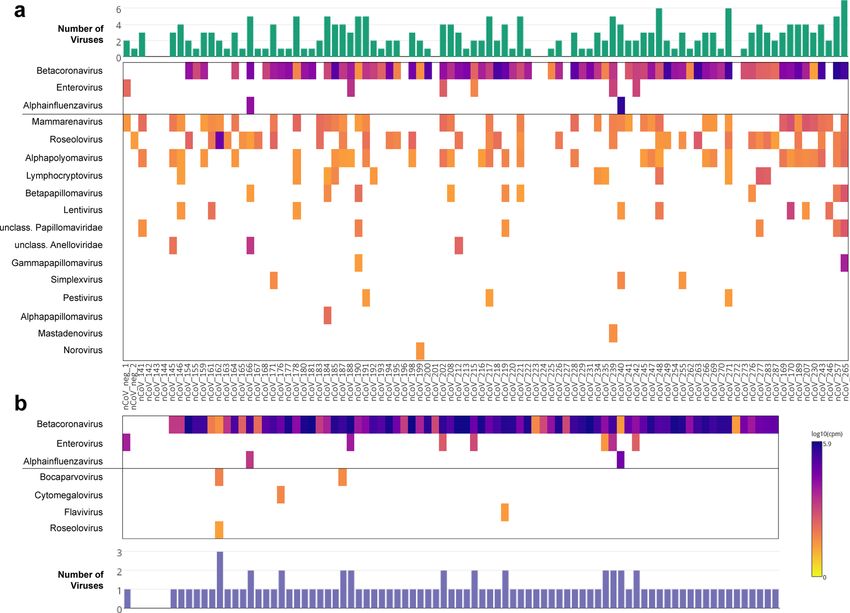
www.nature.com/scientificreports/
Figure 2. Full genome coverage of co-infecting influenzavirus. Coverage plot of sequence reads generated
by Twist capture sequencing of the SARS-CoV-2 case specimen nCoV_240, aligned to the influenzavirus
A reference genome across eight different segments (S1-S8). Depth represented as X fold coverage. Single
nucleotide polymorphisms (SNPs) detected at positions across the genome are indicated in red, greater intensity
of red indicates higher % frequency.
Validation using the Twist Respiratory Virus Panel. The VirCapSeq results were validated in 85 of
the same pre-capture libraries, characterized in parallel using the Twist Respiratory Virus Panel that targets
29 human respiratory viruses. In total, 747 million raw reads were generated, averaging 7.4 million filtered
reads per sample. Overall, 20 species of virus were detected, belonging to seven genera (Supplementary File 1;
Fig. 1b). None of these viruses were detected in the negative controls (SSC_3 and SSC_4), ruling out laboratory
contamination or index switching as a source of spurious virus detection (Fig. S1b). Some sequences in the nega-
tive controls were determined as false-positive hits to human adenovirus B, arising from alignment of reads to
human genomic DNA sequences cloned within an adenovirus vector backbone (Fig. S1c). SARS-CoV-2 reads
were detected in 95% (79/83) of cases, including 16/83 samples undetected using VirCapSeq. SARS-CoV-2 was
absent in both coronavirus-negative controls. Consistent with VirCapSeq results, rhinovirus and influenzavi-
rus were the only other respiratory viruses detected. Moreover, the Twist and VirCapSeq panels showed good
concordance, with all samples positively identified for these viruses being detected on both platforms, with the
exception of one additional rhinovirus-positive case detected by Twist (nCoV_235; Fig. 1a,b). We note that
this discordant case was only marginally above the positivity threshold and reads covered < 5% of the reference
genome (Supplementary Table 3). Other low-level positives included non-respiratory viruses: bocaparvoviruses,
cytomegalovirus, flavivirus and roseolovirus (Fig. 1b).
Validation across multiple bioinformatics pipelines. The choice of de novo assembler can pro-
foundly impact the analysis and interpretation of virome sequencing d ata12. To test whether the respiratory
viral co-infections detected by VirCapSeq and Twist capture sequencing were reproducible using other pipe-
lines that apply a different assembler or a k-mer approach, we compared IDseq results to outputs of VirMAP13
and OneCodex14 (Supplementary Table 4), respectively. Although the total number of taxonomically classified
reads varied across the three pipelines for all respiratory viruses, IDseq and VirMAP were fully concordant for
rhinovirus and influenzavirus positive samples. There were clear differences in the number samples identified
as SARS-CoV-2 positive, OneCodex identifying the fewest despite reporting the highest total number of SARS-
CoV-2 classified reads. IDseq was the most sensitive in identifying SARS-CoV-2 positive samples.
Complete genome coverage of co‑infecting influenzavirus. Unlike targeted qRT-PCR assays,
virome capture sequencing can be used to determine the genome sequences of coinfecting viruses, inform-
ing investigations of virus transmission and evolution. We assessed the suitability of both panels for genome
sequencing of coinfecting respiratory viruses. No clear difference was observed between VirCapSeq and Twist
capture with respect to rhinovirus genome coverage. Breadth of coverage ranged between 24.3–97.4% and
14.7–75.2% of the reference genome, respectively in samples positive for rhinovirus on both platforms (Sup-
plementary Table 3; Fig. S2). In contrast, VirCapSeq consistently achieved higher mean depth of coverage across
most segments of the influenzavirus (Supplementary Table 5; Fig. S2). Nevertheless, Twist capture sequencing
provided complete genome coverage of co-infecting influenzaviruses at high depth, sufficient to detect single
nucleotide variants (SNVs) at the consensus level (Fig. 2). For both rhinoviruses and influenzaviruses, identi-
fied types were concordant between VirCapSeq and Twist panels. Therefore, both platforms were suitable for
sequence determination of co-infecting respiratory viruses.
Scientific Reports | (2021) 11:3934 | https://doi.org/10.1038/s41598-021-83642-x 3
Vol.:(0123456789)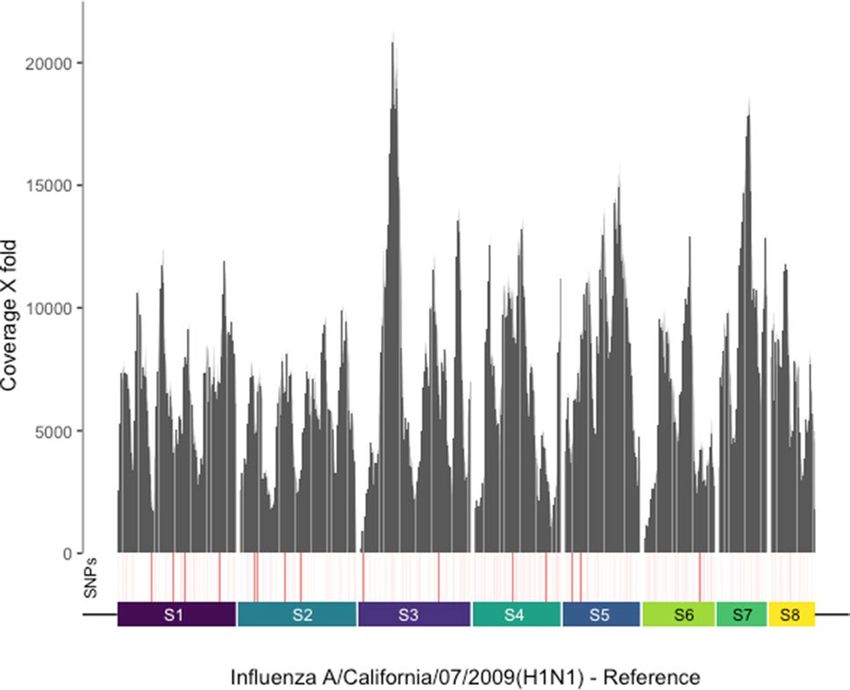
www.nature.com/scientificreports/

                                            Figure 3.  Complete SARS-CoV-2 genome coverage by sequences generated using the Twist Respiratory
                                            Virus Panel. (a) The number of sequence reads generated by VirCapSeq (blue) and Twist (red) hybrid-capture
                                            sequencing, aligned to SARS-CoV-2 in case samples (n = 83) with varying viral load determined by the qRT-
                                            PCR cycle threshold (Ct) value. (b) The fraction of SARS-CoV-2 genome covered at > 10X depth. Violin plot
                                            (left) shows the distribution of genome coverage in samples sequenced by VirCapSeq (blue) and Twist (red)
                                            capture with horizontal line indicating the median fraction of genome covered. Vertical dotted line indicates
                                            the Ct 30 border (right). (c) Distribution of aligned sequence reads across the SARS-CoV-2 reference genome
                                            (MN908947.3) and depth of coverage at each position in the genome (50-bp windows) normalized to the
                                            average coverage across the whole genome for a given sample.

                                            SARS‑CoV‑2 genome coverage. Viral WGS is being widely applied to study the transmission and evolu-
                                            tion of SARS-CoV-2. Amplicon-based sequencing is currently used most frequently but has some limitations
                                            in scalability and reproducibility. Given the high sensitivity of the Twist panel for detecting SARS-CoV-2 reads
                                            even at viral loads near the qRT-PCR limit of detection (Fig. 3a), we investigated whether the Twist sequenc-
                                            ing data provided sufficient coverage of SARS-CoV-2 for WGS analysis. The mean number of SARS-CoV-2
                                            reads detected by the Twist was > tenfold higher than for VirCapSeq (Fig. S3). For samples quantitated with a
                                            Ct < 30 on qRT-PCR, Twist capture sequencing achieved a minimum > tenfold sequencing depth across > 90%
                                            the SARS-CoV-2 genome for 95% (57/60) of samples (Fig. 3b), and of > 30-fold depth for 89% (53/60) of samples
                                            (Fig. S4). The highest Ct at which Twist provided > 90% coverage of > tenfold depth was 32.1. Even in the sample
                                            with the lowest viral load (Ct 39.7), 91% of genome was covered at 1X depth (Supplementary File 2).

          Scientific Reports |   (2021) 11:3934 |               https://doi.org/10.1038/s41598-021-83642-x                                                  4

Vol:.(1234567890)
www.nature.com/scientificreports/
Figure 4. Confirmation of a 328 nt ORF8 deletion in the SARS-CoV-2. Genome browser view of Twist
enriched Illumina (upper) and amplicon-based WGS ONT (lower) sequencing reads aligned across the SARS-
CoV-2 genome of nCoV_200 case specimen, zoomed in at the site of 328 nt ORF8 deletion. ONT sequence
alignment shows loss of coverage in the region targeted by the A7 amplicon primers, due to the deletion of a
primer-binding site within ORF8. In contrast, Twist sequence reads align continuously across this region (Genes
orf3a to orf7), providing greater breadth of coverage of the reference genome (MN908947.3).
Compared with the Twist platform, VirCapSeq did not achieve > 90% coverage even at 1X depth for all sam-
ples, except two with Ct < 20 (Fig. 3b; Fig. S4; Supplementary File 2). To test whether this low genome coverage
was primarily due to the fewer number of SARS-CoV-2 reads detected compared to Twist, SARS-CoV-2 reads
in the Twist dataset were sub-sampled to equal to that of VirCapSeq. Even after sub-sampling, Twist-enriched
sequences maintained > 90% coverage of 10X depth across the SARS-CoV-2 genome in > 50% of the samples
(Fig. S5). This demonstrated that the superior coverage of the SARS-CoV-2 genome achieved using Twist capture
sequencing was only partially due to the higher number of SARS-CoV-2 reads. Coverage heterogeneity was the
more important determinant, with reads being uniformly distributed across the SARS-CoV-2 genome in Twist
samples but scattered unevenly for VirCapSeq (Fig. 3c). Therefore, while the VirCapSeq panel is suitable for
detection of SARS-CoV-2 and coinfecting viruses, it is unsuitable for SARS-CoV-2 WGS.
Detection of inter‑individual variation of SARS‑CoV‑2. We evaluated the capacity to identify inter-
individual genetic variation of SARS-CoV-2 from Twist sequencing data. Among 83 cases examined by Twist
capture sequencing, the SARS-CoV-2 genomes of 48 cases were previously characterized from same samples
through amplicon-based WGS on the Illumina platform. This confirmed the presence of inter-individual single
nucleotide variants (SNVs) at the consensus l evel15. Taking the amplicon-WGS data as the truth set, we assessed
the sensitivity and precision of consensus sequence variants detected from Twist sequences. Overall, 338 con-
sensus level SNVs were detected with 96% sensitivity and 98% precision, perfectly identified in 88% (42/48) of
samples examined (Supplementary Table 6).
Detection of ORF8 deletion and validation using amplicon WGS. Multiple studies report major
structural variations (SVs) in the SARS-CoV-2 genome16–19, namely the 382 nt deletion in the open reading frame
8 (ORF8), associated with changes in the replicative fitness17 and milder infections18. Therefore, we investigated
if similar ORF8 deletions could be detected from the cases examined by Twist capture sequencing. We identified
two cases with a common 328 bp deletion in ORF8 (nCoV_200 and nCoV_225). Providing further validation,
the same deletion was detected in both cases through amplicon based WGS (Fig. 4; Fig. S6), using Oxford Nano-
pore Technology (ONT). Interestingly, in both cases, the deletion abolished a primer site, causing the failure of
an adjacent amplicon (2.5 kb) and resulting in incomplete coverage of the SARS-CoV-2 genome when profiled
by amplicon sequencing. By contrast, hybrid capture sequencing was able to achieve complete genome coverage.
This demonstrates that Twist capture sequencing achieves sufficient coverage to reliably detect large deletions in
the SARS-CoV-2 genome for clinical specimens of Ct < 30 and is more robust to large deletion or rearrangements
in the genome, which can disrupt amplicon schemes.
Discussion
Determining the co-infection rate and consequent clinical impacts on COVID-19 is critical, particularly where
therapeutic interventions for some coinfecting agents such as influenzavirus are available. In this study, we
sequenced the respiratory virome using two hybrid-capture approaches and multiple taxonomic read classifica-
tion pipelines, demonstrating an 8% rate of co-infection with other respiratory viruses among SARS-CoV-2 cases
in Australia. This is less than half the rate reported in Northern California2, but greater than the initial estimates
Scientific Reports | (2021) 11:3934 | https://doi.org/10.1038/s41598-021-83642-x 5
Vol.:(0123456789)www.nature.com/scientificreports/
from Wuhan (0.0%)1 and rates of viral co-infection reported from Chicago (1.6%)20, New York (2.0%)21, Singa-
pore (1.4%)22, Barcelona (0.6%)23 and Turkey (2.0%)6. Furthermore, it is higher than the 4.6% of co-infection
observed among 175 cases from the same region, diagnosed and tested during a similar time period using
multiplex qRT-PCR7. Such high inter- and intra-regional variability warrants further investigation, particularly
in developed countries with similar SARS-CoV-2 incidence to Australia. Recent data from I ran4 and Poland24
support higher mortality of COVID-19 patients as a result of respiratory viral co-infections.
Previous studies have reported co-infections between SARS-CoV-2 and common respiratory viruses includ-
ing rhinovirus, influenzavirus, meatapneumovirus, parainfluenzavirus and respiratory syncytial virus5,25. In our
results, co-infections between SARS-CoV-2 and rhinoviruses (6%) were predominant, lower for influenzavi-
ruses (2%). Interestingly, co-infection between SARS-CoV-2 and influenza was not observed in a recent report
of Australian SARS-CoV-2 c ases7. The case specimens examined in the present study were collected between
March and May 2020, overlapping with the start of the Southern Hemisphere influenza season. In Australia, the
flu season thus far has reported > 90% reduction in incidence of influenzavirus infections compared to the same
period in 2019 as a result of social distancing and mandatory quarantine measures applied during the COVID-
19 pandemic26. Therefore, the significant reduction in circulating influenzavirus may have contributed to its low
co-infection rate with SARS-CoV-2.
Our study has several limitations. All specimens examined in this study were freeze-thawed twice before
library preparation. This may have prevented detection of viruses that were originally at very low titer. Therefore,
the actual rate of co-infection may exceed 8%. To eliminate this potential in future analyses, double-stranded
cDNA should be generated on the same day as SARS-CoV-2 qRT-PCR, from the same nucleic acid extracts
avoiding freeze–thaw. A key limitation of our analysis was the lack of clinical metadata, precluding examina-
tion of potential associations between respiratory viral co-infection with SARS-CoV-2 and clinical outcomes of
COVID-19. Although comparable to other co-infection studies to date, our sample size was small and included
only a single timepoint for each case. Nevertheless, this represents the largest metagenomic sequencing study to
date, examining co-infections between SARS-CoV-2 and other respiratory viruses.
There is growing appreciation for SARS-CoV-2 WGS as an essential tool to investigate the transmission and
evolution of SARS-CoV-2, critical for research and public health responses to COVID-1915–17,27–31. Existing WGS
approaches can be divided into two main categories: 1. Amplicon sequencing; and 2. Hybrid-capture sequenc-
ing using SARS-CoV-2-specific probes. Neither are capable of simultaneously detecting co-infecting viruses.
Our analysis of the SARS-CoV-2 genome using Twist-enriched sequenced demonstrated high breadth and
depth of coverage for samples with Ct < 30, sufficient for downstream analysis of SNV, indels and SVs. This was
despite using single-end sequence data. Hence, even greater confidence in variant calling can be achieved using
paired-end sequencing. Overall, target enrichment sequencing using the Twist Respiratory Virus Panel offers
dual-functionality, providing effective characterization of co-infecting respiratory viruses and the full genome
of the SARS-CoV-2, simultaneously.
Unlike amplicon sequencing, Twist hybrid-capture does not require generation of SARS-CoV-2 amplicons.
This significantly reduces processing time and manual handling, lowering the risk of cross contamination. Using
the Twist’s fast hybridization and multiplexed capture workflow, libraries ready for high throughput sequencing
can be constructed from clinical specimen extracts in < 8 h. Although the amplicon approach can also construct
libraries within a similar timeframe, in our experience of using two published amplicon WGS methods15,28,32,
generating amplicons often took longer than anticipated due to certain parts of the genome amplifying poorly,
requiring continuous optimization. Furthermore, in this study, all libraries were hybridized with Twist probes
for 2 h. However, this can be reduced to 30 min with minimal loss in capture efficiency.
The default protocol for Twist hybrid-capture supports multiplexing up to 8 libraries (8-plex) per capture
hybridization, combining libraries by equal mass to make up 1.5 µg of total DNA, or up to 4 µg total without
compromising the efficacy of target enrichment. In this study, we performed Twist capture on libraries pooled
up to 20-plex, whilst still maintaining the 4 µg total DNA limit. This highly multiplexed sample processing
significantly reduced processing time, labor and cost per sample. Current per-sample cost of Twist Respiratory
Virus Panel in a 20-plex sample format is $25 USD. This compares favorably with the cost of VirCapSeq (~ $23
USD per sample), particularly given its advantages in sensitivity and genome coverage of SARS-CoV-2.
Taken together, we provide a practical and cost-effective strategy for characterizing both respiratory viral
co-infections and the full SARS-CoV-2 genome simultaneously, from clinical specimens with Ct < 30 or viral
load > 3,000 copies/mL. We also recommend IDseq as the preferred pipeline for taxonomic classification of viral
sequences in SARS-CoV-2 specimens, based on its high sensitivity for SARS-CoV-2 and other respiratory viruses,
ease of use, and minimal requirements in terms of infrastructure and bioinformatic expertise. We envision broad
application of our approach across research and clinical settings.
Methods
Clinical samples and SARS‑CoV‑2 qRT‑PCR. Respiratory specimens of SARS-CoV-2 cases (adults) in
NSW diagnosed between March and May 2020 were obtained from at the Prince of Wales Hospital in Randwick,
Sydney, Australia. Ethical approval and informed consent waiver was received from the South Eastern Sydney
Local Health District Human Research Ethics Committee (2020/ETH02639). All methods were performed in
accordance with the relevant guidelines and regulations. Prior to this study, samples were freeze-thawed twice
and stored at − 80 °C following diagnostic testing at the NSW Health Pathology East Serology and Virology Divi-
sion (SaViD). In total, 92 nasopharyngeal swabs suspended in Viral Transport Media (VTM) were selected for
virome capture sequencing, all positive for a combination of four SARS-CoV-2 target genes (RdRp, S, N and E)
on the Allplex SARS-CoV-2 qRT-PCR Assay (Seegene, Seoul, Korea). The approximate copy number of SARS-
CoV-2 RNA was calculated by plotting the Ct against a standard curve built from tenfold serial dilution of a
Scientific Reports | (2021) 11:3934 | https://doi.org/10.1038/s41598-021-83642-x 6
Vol:.(1234567890)www.nature.com/scientificreports/
quantified N-gene plasmid control, developed inhouse. To use as controls, two nasopharyngeal swabs confirmed
negative for SARS-CoV-2 from the same diagnostic laboratory and two negative controls prepared from purified
Salmon Sperm DNA (15632-011; Thermo Fisher Scientific, MA, USA) were also sequenced.
Total nucleic acid extraction, cDNA synthesis and library prep. Total nucleic acid was extracted
from 200 µL of swab suspension in VTM, using the AllPrep PowerViral DNA/RNA kits (Qiagen, Hilden, Ger-
many) with bead-beating and phenol/chloroform, following manufacturer’s protocol. Using Superscript III
(Thermo Fisher Scientific) and Klenow Fragment (NEB, MA, USA) with random hexamers, the RNA portion
was converted into double-stranded cDNA. Illumina sequencing libraries were prepared from 1ug of double-
stranded DNA/cDNA mixture, using the KAPA Hyper Plus (Roche, Basel, Switzerland) kit with Unique Dual-
Index adapters. Libraries were quantified by picogreen (Thermo Fisher Scientific) and the size distribution of
library fragments were measured on the LabChip GX Touch 24 (Perkin Elmer, MA, USA) bioanalyzer.
Target enrichment sequencing. For VirCapSeq hybrid-capture, individual libraries (92 cases, 2 coro-
navirus-negative controls and 2 salmon sperm DNA controls) were combined by equal mass into two capture
pools (48-plex) and hybridized to probes (VirCapSeq-VERT design; Roche) for 16 h as previously d escribed11,
following the SeqCap EZ HyperCap Worklfow v2.3 (Roche). For hybrid-capture using the Twist Respiratory
Virus Research Panel (103067; Twist Biosciences, San Francisco, CA), 87 libraries (83 cases, 2 coronavirus-neg-
ative controls and 2 salmon sperm DNA controls) were combined by equal mass into five capture pools (16- to
20-plex; average 17-plex). Pools were hybridized to probes for 2 h, following the Fast Hybridization Workflow
(Twist Biosciences). VirCapSeq and Twist post-capture library pools were PCR amplified 16 cycles and single-
end sequenced (1 × 100 bp) separately, up to 96 barcoded libraries maximum per lane of a NovaSeq 6000 S1
flowcell (Illumina, San Diego, CA) at the Ramaciotti Centre for Genomics (UNSW Sydney, Australia).
Taxonomic classification of metagenomic reads. By default, taxonomic classification of viral reads in
all samples was achieved using IDseq (v4.0)33, a cloud-based, open-source bioinformatics pipeline for metagen-
omic sequencing data. Raw fastq files were uploaded to the IDseq portal (https://idseq.net) using the Amazon
Web Services (AWS) Command Line Interface. All IDseq scripts and user instructions are available at https://
github.com/chanzuckerberg/idseq-dag. In brief, adapter and human host sequences were filtered, and remain-
ing short-read sequences were aligned to the NCBI nucleotide (nt) and nonredundant protein (nr) databases
(ftp://ftp.ncbi.nlm.nih.gov/blast/db/FASTA/) using GSNAPL34 and RAPsearch235, respectively. Putative acces-
sions were assigned to each read using the NCBI accession2taxid database (ftp://ftp.ncbi.nih.gov/pub/taxonomy/
accession2taxid) and a BLAST + (v 2.6.0)36 database. In parallel, short reads were de novo assembled into contigs
using SPAdes37. Raw reads were mapped back to the resulting contigs using Bowtie238, to identify the contig to
which they belong. Finally, each contig was aligned to the set of possible accessions represented by the BLAST
database, to improve the specificity of alignments to all the underlying reads. Only viruses detected at ≥ 20 rpM
based on nt alignments (NT rPM) were deemed positive and included in heatmaps generated using iheatmapr39.
For the comparative analysis between IDseq and other bioinformatic pipelines, taxonomic read classification
summaries were generated using VirMAP13 and OneCodex14. VirMAP was installed and run on the National
Computing Infrastructure (NCI) HPC Gadi with modifications described at https://github.com/rsoftone/virma
p. OneCodex is a premium cloud-based pipeline, for which raw fastq files generated using Twist hybrid-capture
sequencing were uploaded and summary reports downloaded using the web browser interface (https://app.
onecodex.com/).
Virus genome assembly, coverage analysis and variant detection. For samples containing
sequences corresponding to rhinoviruses/enteroviruses and influenzaviruses, host-filtered sequences from
IDseq were mapped to their respective reference genome sequence obtained from the NCBI database using
minimap2 (v2.17-r941)40. Coverage statistics and SNV reports were generated from the sorted bam file using
qualimap (v2.2.2-dev)41 and freebayes (v1.3.2-dirty)42, respectively. Genome assemblies and coverage statistics
in were also generated in Geneious Prime (v2020.2.2; Biomatters Ltd.)43 for supplementary tables and figures.
For all SARS-CoV-2 genome assemblies, host-filtered reads were aligned to the Wuhan-Hu-1 reference
genome (MN908947.3) using bwa mem (0.7.12-r1039)44, with only MapQ = 60 alignments retained. Per-base
coverage was calculated at each position in the SARS-CoV-2 genome using bedtools coverage (v2.25.0)45. Cover-
age breadth (fraction of positions covered) was calculated at a range of different minimum depths (≥ 1X, 2X,
5X, 10X, 20X, 30X, 50X, 100X). For samples where SARS-CoV-2 was detected at Ct < 30, SNVs were detected
using samtools mpileup (v1.9)46 and Varscan2 mpileup2snp (v2.4.3)47. SNVs with a minimum read-count fre-
quency ≥ 80% were retained as consensus SNVs. Variant detection performance was evaluated by comparing
detected consensus SNVs in Twist capture samples to matched specimens analyzed e lsewhere15 by amplicon-
based WGS (n = 48). Validation of ORF8 deletions by amplicon-based WGS using the ONT platform was per-
formed as previously described15 and alignment of reads across the deletion site was visualized in Integrative
Genomics Viewer (IGV; v2.8)48.
Data availability
All de-identified metagenomic sequencing data (raw and processed fastq files) will be made publicly available
in time for publication.
Scientific Reports | (2021) 11:3934 | https://doi.org/10.1038/s41598-021-83642-x 7
Vol.:(0123456789)www.nature.com/scientificreports/
Received: 6 November 2020; Accepted: 3 February 2021
References
1. Chen, N. et al. Epidemiological and clinical characteristics of 99 cases of 2019 novel coronavirus pneumonia in Wuhan, China: a
descriptive study. The Lancet 395, 507–513 (2020).
2. Kim, D., Quinn, J., Pinsky, B., Shah, N. H. & Brown, I. Rates of co-infection between SARS-CoV-2 and other respiratory pathogens.
JAMA 323, 2085–2086 (2020).
3. Langford, B. J. et al. Bacterial co-infection and secondary infection in patients with COVID-19: a living rapid review and meta-
analysis. Clin. Microbiol. Infect. 26, 1622–1629 (2020).
4. Hashemi, S. A., Safamanesh, S., Ghasemzadeh-Moghaddam, H., Ghafouri, M. & Amir, A. High prevalence of SARS-CoV-2 and
influenza A virus (H1N1) co-infection in dead patients in Northeastern Iran. J. Med. Virol. 93, 1008–1012 (2021).
5. Lai, C.-C., Wang, C.-Y. & Hsueh, P.-R. Co-infections among patients with COVID-19: the need for combination therapy with
non-anti-SARS-CoV-2 agents?. J. Microbiol. Immunol. Infect. 53, 505–512 (2020).
6. Alpaydin, A. O. et al. Clinical and radiological diagnosis of non-SARS-CoV-2 viruses in the era of Covid–19 pandemic. J. Med.
Virol. 93, 1119–1125 (2021).
7. Marriott, D. et al. Concomitant marked decline in prevalence of SARS-CoV-2 and other respiratory viruses among symptomatic
patients following public health interventions in Australia: data from St Vincent’s Hospital and associated screening clinics, Sydney,
NSW. Clin. Infect. Dis., ciaa1256 (2020).
8. Briese, T. et al. Virome capture sequencing enables sensitive viral diagnosis and comprehensive virome analysis. mBio 6, e01491-
01415 (2015).
9. Kim, K. W. et al. Distinct gut virome profile of pregnant women with type 1 diabetes in the ENDIA study. Open For. Infect. Dis. 6,
ofz025 (2019).
10. Kim, K. W. et al. Higher abundance of enterovirus A species in the gut of children with islet autoimmunity. Sci. Rep. 9, 1749 (2019).
11. Kim, K. W. et al. Higher frequency of vertebrate-infecting viruses in the gut of infants born to mothers with type 1 diabetes. Pediatr.
Diabetes 21, 271–279 (2020).
12. Sutton, T. D. S., Clooney, A. G., Ryan, F. J., Ross, R. P. & Hill, C. Choice of assembly software has a critical impact on virome
characterisation. Microbiome 7, 1–15 (2019).
13. Ajami, N. J., Wong, M. C., Ross, M. C., Lloyd, R. E. & Petrosino, J. F. Maximal viral information recovery from sequence data using
VirMAP. Nat. Commun. 9, 1–9 (2018).
14. Minot, S. S., Krumm, N. & Greenfield, N. B. One Codex: A Sensitive and Accurate Data Platform for Genomic Microbial Identifica-
tion. Preprint at http://biorxiv.org/content/early/2015/09/28/027607.abstract (2015).
15. Bull, R. A. et al. Analytical validity of nanopore sequencing for rapid SARS-CoV-2 genome analysis. Nat. Commun. 11, 6272 (2020).
16. Gong, Y.-N. et al. SARS-CoV-2 genomic surveillance in Taiwan revealed novel ORF8-deletion mutant and clade possibly associated
with infections in Middle East. Emerg. Microbes Infect. 9, 1–37 (2020).
17. Su, Y. C. F. et al. Discovery and genomic characterization of a 382-nucleotide deletion in ORF7b and ORF8 during the early evolu-
tion of SARS-CoV-2. mBio 11, e01610–20 (2020).
18. Young, B. E. et al. Effects of a major deletion in the SARS-CoV-2 genome on the severity of infection and the inflammatory
response: an observational cohort study. The Lancet 396, 603–611 (2020).
19. Andrés, C. et al. Naturally occurring SARS-CoV-2 gene deletions close to the spike S1/S2 cleavage site in the viral quasispecies of
COVID19 patients. Emerg. Microbes Infect. 9, 1900–1911 (2020).
20. Lehmann, C. J., Pho, M. T., Pitrak, D., Ridgway, J. P. & Pettit, N. N. Community acquired co-infection in COVID-19: a retrospective
observational experience. Clin. Infect. Dis., ciaa902 (2020).
21. Richardson, S. et al. Presenting characteristics, comorbidities, and outcomes among 5700 patients hospitalized with COVID-19
in the New York City area. JAMA 323, 2052 (2020).
22. Wee, L. E. et al. Community-acquired viral respiratory infections amongst hospitalized inpatients during a COVID-19 outbreak
in Singapore: co-infection and clinical outcomes. J. Clin. Virol. 128, 104436 (2020).
23. Garcia-Vidal, C. et al. Incidence of co-infections and superinfections in hospitalised patients with COVID-19: a retrospective
cohort study. Clin. Microbiol. Infect. 27, 83–88 (2021).
24. Biernat, M. M. et al. Nosocomial outbreak of SARS-CoV-2 infection in a haematological unit—high mortality rate in infected
patients with haematologic malignancies. J. Clin. Virol. 130, 104574 (2020).
25. Chen, X. et al. The microbial coinfection in COVID-19. Appl. Microbiol. Biotechnol. 104, 7777–7785 (2020).
26. Australian Government Department of Health. Australian Influenza Surveillance Report 11. https: //www1.health .gov.au/intern
et/
main/publishing.nsf/Content/ozflu-surveil-no11-20.htm (2020).
27. Lu, R. et al. Genomic characterisation and epidemiology of 2019 novel coronavirus: implications for virus origins and receptor
binding. The Lancet 395, 565–574 (2020).
28. Eden, J.-S. et al. An emergent clade of SARS-CoV-2 linked to returned travellers from Iran. Virus Evol. 6, veaa027 (2020).
29. Oude Munnink, B. B. et al. Rapid SARS-CoV-2 whole-genome sequencing and analysis for informed public health decision-making
in the Netherlands. Nat. Med. 26, 1405–1410 (2020).
30. Rockett, R. J. et al. Revealing COVID-19 transmission in Australia by SARS-CoV-2 genome sequencing and agent-based modeling.
Nat. Med. 26, 1398–1404 (2020).
31. Seemann, T. et al. Tracking the COVID-19 pandemic in Australia using genomics. Nat. Commun. 11, 1–9 (2020).
32. Quick, J. & Loman, N. J. hCoV-2019/nCoV-2019 Version 3 Amplicon Set. https://artic.network/resources/ncov/ncov-amplicon-v3.
pdf (2020).
33. Ramesh, A. et al. Metagenomic next-generation sequencing of samples from pediatric febrile illness in Tororo, Uganda. PLoS ONE
14, e0218318 (2019).
34. Wu, T. D., Reeder, J., Lawrence, M., Becker, G. & Brauer, M. J. GMAP and GSNAP for genomic sequence alignment: enhancements
to speed, accuracy, and functionality. Methods Mol. Biol. 1418, 283–334 (2016).
35. Zhao, Y., Tang, H. & Ye, Y. RAPSearch2: a fast and memory-efficient protein similarity search tool for next-generation sequencing
data. Bioinformatics 28, 125–126 (2012).
36. Altschul, S. F., Gish, W., Miller, W., Myers, E. W. & Lipman, D. J. Basic local alignment search tool. J. Mol. Biol. 215, 403–410 (1990).
37. Bankevich, A. et al. SPAdes: a new genome assembly algorithm and its applications to single-cell sequencing. J. Comput. Biol. 19,
455–477 (2012).
38. Langmead, B. & Salzberg, S. L. Fast gapped-read alignment with Bowtie 2. Nat. Methods 9, 357–359 (2012).
39. Schep, A. N. & Kummerfeld, S. K. iheatmapr: interactive complex heatmaps in R. J. Open Source Softw. 2, 359 (2017).
40. Li, H. Minimap2: pairwise alignment for nucleotide sequences. Bioinformatics 34, 3094–3100 (2018).
41. Okonechnikov, K., Conesa, A. & García-Alcalde, F. Qualimap 2: advanced multi-sample quality control for high-throughput
sequencing data. Bioinformatics (Oxford, England) 32, 292–294 (2016).
42. Garrison, E. & Marth, G. Haplotype-Based Variant Detection from Short-Read Sequencing. Preprint at https://arxiv.org/
pdf/1207.3907.pdf (2012).
Scientific Reports | (2021) 11:3934 | https://doi.org/10.1038/s41598-021-83642-x 8
Vol:.(1234567890)www.nature.com/scientificreports/
43. Kearse, M. et al. Geneious basic: an integrated and extendable desktop software platform for the organization and analysis of
sequence data. Bioinformatics 28, 1647–1649 (2012).
44. Li, H. Aligning Sequence Reads, Clone Sequences and Assembly Contigs with BWA-MEM. Preprint at https: //arxiv. org/pdf/1303.3997.
pdf (2013).
45. Quinlan, A. R. & Hall, I. M. BEDTools: a flexible suite of utilities for comparing genomic features. Bioinformatics 26, 841–842
(2010).
46. Li, H. A statistical framework for SNP calling, mutation discovery, association mapping and population genetical parameter
estimation from sequencing data. Bioinformatics 27, 2987–2993 (2011).
47. Koboldt, D. C. et al. VarScan 2: somatic mutation and copy number alteration discovery in cancer by exome sequencing. Genome
Res. 22, 568–576 (2012).
48. Robinson, J. T. et al. Integrative genomics viewer. Nat. Biotechnol. 29, 24–26 (2011).
Acknowledgements
We acknowledge the following funding support: UNSW COVID-19 Rapid Response Research Initiative (to
W.D.R.), NCI Australasian Leadership Computing COVID-19 Grant (to M.R.W., W.D.R., K.W.K., M.E.C. and
C.N.I.P.), MRFF Investigator Grant APP1173594 & Cancer Institute NSW Early Career Fellowship 2018/ECF013
(to I.W.D.), NSW State Government RAAP Scheme (to M.R.W. and C.N.I.P.), UNSW ResTech Support Scheme
(to M.E.C. and K.W.K) and JDRF International Postdoctoral Fellowship 3-PDF-2020-940-A-N (to K.W.K).
Author contributions
Z.N., M.Y., K.W.K., S.S.B., R.A.B., S.J.vH. & W.D.R. oversaw collection and handling of specimens. M.Y. per-
formed SARS-CoV-2 qRT-PCR. T.A., A.V., J.M.H., A.G.B. & I.S. performed SARS-CoV-2 amplicon sequencing.
K.W.K. performed Illumina library preparation and hybrid-capture sequencing. K.W.K., I.W.D., C.N.I.P., M.R.W.,
D.M. & S.Y. performed bioinformatics analysis. K.W.K., I.W.D., S.J.vH. & C.N.I.P. prepared the figures. K.W.K.,
I.W.D., M.E.C., S.J.vH. & W.D.R. prepared the manuscript with support from co-authors.
Competing interests
The authors declare no competing interests.
Additional information
Supplementary Information The online version contains supplementary material available at https://doi.
org/10.1038/s41598-021-83642-x.
Correspondence and requests for materials should be addressed to W.D.R.
Reprints and permissions information is available at www.nature.com/reprints.
Publisher’s note Springer Nature remains neutral with regard to jurisdictional claims in published maps and
institutional affiliations.
Open Access This article is licensed under a Creative Commons Attribution 4.0 International
License, which permits use, sharing, adaptation, distribution and reproduction in any medium or
format, as long as you give appropriate credit to the original author(s) and the source, provide a link to the
Creative Commons licence, and indicate if changes were made. The images or other third party material in this
article are included in the article’s Creative Commons licence, unless indicated otherwise in a credit line to the
material. If material is not included in the article’s Creative Commons licence and your intended use is not
permitted by statutory regulation or exceeds the permitted use, you will need to obtain permission directly from
the copyright holder. To view a copy of this licence, visit http://creativecommons.org/licenses/by/4.0/.
© The Author(s) 2021
Scientific Reports | (2021) 11:3934 | https://doi.org/10.1038/s41598-021-83642-x 9
Vol.:(0123456789)You can also read