Restriction site-associated DNA from Python-implemented Digestion Simulations (RApyDS): a companion tool for RAD sequencing experimental design ...
←
→
Page content transcription
If your browser does not render page correctly, please read the page content below
F1000Research 2021, 10:360 Last updated: 12 MAY 2021

SOFTWARE TOOL ARTICLE

Restriction site-associated DNA from Python-implemented
Digestion Simulations (RApyDS): a companion tool for RAD
sequencing experimental design [version 1; peer review:
awaiting peer review]
Kristianne Arielle Gabriel1, Maria Rejane Nepacina 1,2, Francis Tablizo1,
Carlo Lapid1, Mark Lenczner Mendoza1, Daniella Jean Pamulaklakin1,3,
Jobeth Domingo 1,4, Marc Jermaine Pontiveros1,5, Hannah Mae Magno1,6,
Joshua Gregor Dizon1, El King Morado1, Jan Michael Yap1
1Core Facility for Bioinformatics, Philippine Genome Center, University of the Philippines, Diliman, Quezon City, 1101, Philippines
2Science Education Institute, Department of Science and Technology, Bicutan, Taguig City, 1631, Philippines
3Institute of Weed Science, Entomology and Plant Pathology, College of Agriculture and Food Sciences, University of the Philippines

- Los Banos, Laguna, 4031, Philippines
4Division of Biological Sciences, College of Arts and Sciences, University of the Philippines Visayas, Miagao, Iloilo, 5023, Philippines
5Department of Physical Sciences and Mathematics, College of Arts and Sciences, University of the Philippines Manila, Manila, 1004,

Philippines
6Department of Computer Science, University of the Philippines Diliman, Quezon City, 1101, Philippines

v1   First published: 07 May 2021, 10:360                                            Open Peer Review
     https://doi.org/10.12688/f1000research.52141.1
     Latest published: 07 May 2021, 10:360
     https://doi.org/10.12688/f1000research.52141.1                                  Reviewer Status AWAITING PEER REVIEW

                                                                                     Any reports and responses or comments on the

Abstract                                                                             article can be found at the end of the article.
Reduced representation sequencing is a practical approach for
obtaining genetic variations from a random subsample of the
genome. RADseq (Restriction Site-Associated DNA Sequencing), as one
of the more popular reduced representation approaches, is currently
being used in a wide array of applications including marker
development, phylogenetics, and population genomics. A crucial step
in designing a RADseq experiment is the selection of one or a pair of
restriction enzymes (RE) that will result in sufficient density of loci to
meet the objectives of the study, which is not straightforward because
of difficulties in obtaining a standard set of REs that can generally be
applied to RADseq experimental designs. Here we present RApyDS, a
simulation tool that provides users with evaluation metrics to aid in
choosing suitable REs based on their target RADseq design. RApyDS
can perform simulations for single- or double-digest RADseq,
preferably with a supplied reference genome. The tool outputs an
overview page, electrophoresis visualization, mapping of restriction
cut sites, and RAD loci density across the genome. If supplied with an
annotation file, the program can also output evaluation metrics for a

                                                                                                                              Page 1 of 10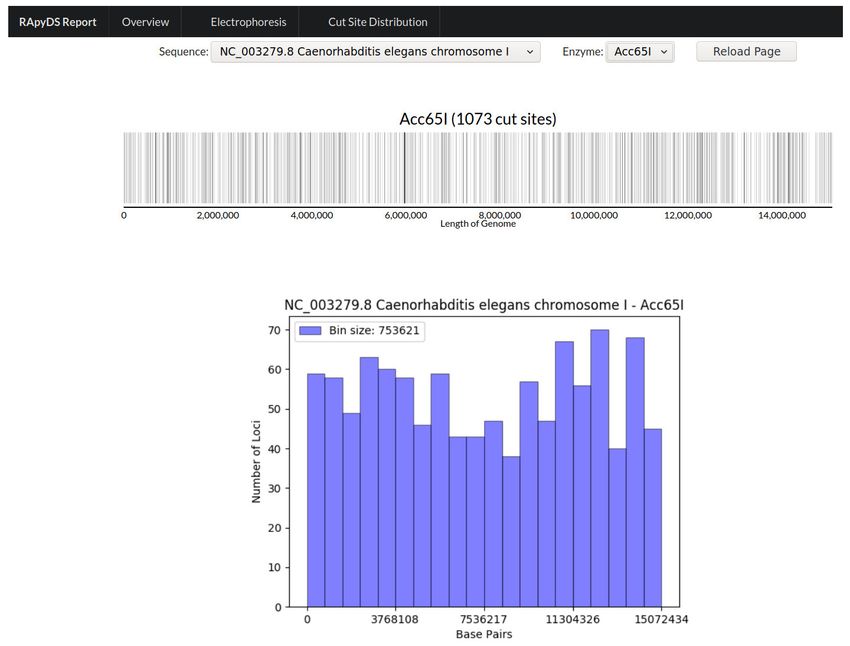
F1000Research 2021, 10:360 Last updated: 12 MAY 2021

specified genomic feature. The tool is currently available at
https://github.com/pgcbioinfo/rapyds.

Keywords
RApyDS, Restriction Site-Associated DNA Sequencing, RADseq,
simulation, companion tool, experimental design

                This article is included in the Python collection.

 Corresponding author: Jan Michael Yap (jcyap@up.edu.ph)
 Author roles: Gabriel KA: Conceptualization, Methodology, Software, Writing – Review & Editing; Nepacina MR: Conceptualization,
 Validation, Writing – Original Draft Preparation, Writing – Review & Editing; Tablizo F: Conceptualization, Methodology, Writing – Original
 Draft Preparation, Writing – Review & Editing; Lapid C: Conceptualization, Writing – Review & Editing; Mendoza ML: Methodology,
 Software; Pamulaklakin DJ: Methodology, Software; Domingo J: Investigation, Validation; Pontiveros MJ: Investigation, Validation;
 Magno HM: Investigation, Validation; Dizon JG: Conceptualization, Software, Writing – Review & Editing; Morado EK: Conceptualization,
 Writing – Review & Editing; Yap JM: Conceptualization, Supervision, Writing – Review & Editing
 Competing interests: No competing interests were disclosed.
 Grant information: This work was partially funded by the University of the Philippines – Philippine Genome Center (UP-PGC) and the
 Philippine Council for Industry, Energy and Emerging Technology Research and Development of the Department of Science and
 Technology (DOST-PCIEERD) through the Increased Local Bioinformatics Utility and Expertise (IMBUE) project (DOST-PCIEERD Funding
 No. 2019-101) granted to JMC Yap.
 Copyright: © 2021 Gabriel KA et al. This is an open access article distributed under the terms of the Creative Commons Attribution
 License, which permits unrestricted use, distribution, and reproduction in any medium, provided the original work is properly cited.
 How to cite this article: Gabriel KA, Nepacina MR, Tablizo F et al. Restriction site-associated DNA from Python-implemented
 Digestion Simulations (RApyDS): a companion tool for RAD sequencing experimental design [version 1; peer review: awaiting
 peer review] F1000Research 2021, 10:360 https://doi.org/10.12688/f1000research.52141.1
 First published: 07 May 2021, 10:360 https://doi.org/10.12688/f1000research.52141.1

                                                                                                                                  Page 2 of 10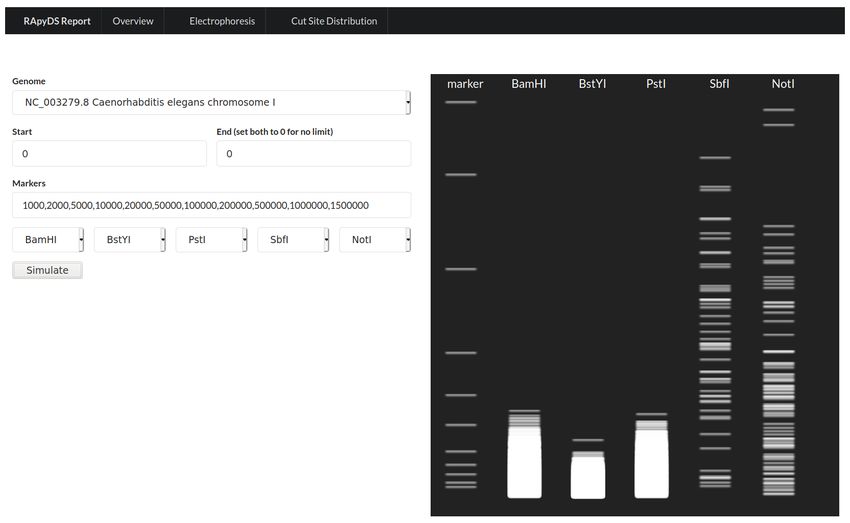
F1000Research 2021, 10:360 Last updated: 12 MAY 2021

Introduction                                                        frequency of cut-sites and fragments that will be produced by
Next-generation sequencing (NGS) technologies provide an            a given restriction enzyme.
avenue to obtain a broader view of the genetic landscape of
individual species, substantially impacting various applica-        To address the aforementioned impediments, we developed
tions such as molecular marker discovery (Shendure & Ji, 2008).     RApyDS (Restriction Site-Associated DNA from Python-
However, not all approaches and studies require sequenc-            implemented Digestion Simulation), a tool that aims to
ing of complete genomes, which may be cost-prohibitive              provide evaluation metrics to aid researchers in choosing the
and more difficult to analyze (Etter et al., 2011; Meger et al.,    best set of restriction enzymes for a RADseq study. It is a
2019). In dealing with whole-genome resequencing studies,           Python-based tool that simulates digestion of a given refer-
reduced representation genomic libraries (RRLs) are alterna-        ence genome in silico either by original RADseq or ddRAD
tively used to randomly subsample the genome for the discovery      protocols. The simulation tool generates estimates for the
of genetic markers and variations. Instead of resequencing          following: (i) the number of restriction sites, (ii) the number
at a lower depth of coverage to reduce the sequencing cost,         of fragments after digestion, (iii) the number of fragments
RRLs can increase the effective coverage depth but only for         after shearing and size selection (RAD loci), (iv) the number of
certain regions of the genome. Amongst RRLs, Restriction            RAD loci within repeat regions, (v) the cut-site distribution,
Site-Associated DNA Sequencing (RADseq) has gained a lot of         and (vi) the projected RAD loci density across the genome.
attention, as this approach utilizes the power of high-throughput   A gel electrophoresis view of the restriction fragments is also
sequencing to efficiently discover polymorphic markers on           shown to simulate the common laboratory method used for
organisms even in the absence of a reference genome (Etter          initial evaluation of restriction digestion. When supplied with
et al., 2011).                                                      an annotation file for the reference genome, the tool will also
                                                                    provide the number of RAD loci observed within annotated
RADseq, which utilizes restriction enzymes to sample a              regions. All of this information, taken together, will ena-
subset of the genome that is flanked by restriction sites, is       ble the user to better determine the top restriction enzyme
commonly used today for SNP discovery and genotyping (Davey         candidates and RADseq experimental design to implement for
et al., 2013). RADseq protocols may vary according to the           a particular RADseq or resequencing study.
number of restriction enzymes used and the frequency of cut
sites across the length of the DNA. In its original formula-        Methods
tion, RADseq relies on the fragments produced from the cut          Implementation
sites of a single restriction enzyme; whereas other protocols       Figure 1 shows an overview of the implementation work-
such as double-digest RADseq (ddRAD) produce fragments              flow of the RApyDS tool. Two distinct RADseq protocols are
with known distances from the cut-sites of two different restric-   implemented in RApyDS for simulation: the original RADseq
tion enzymes (Andrews et al., 2016). Briefly, the process           protocol (Baird et al., 2008), and the double-digest RAD-
begins with the digestion of high-quality genomic DNA by the        seq or ddRAD (Peterson et al., 2012). Global splitting was
chosen restriction enzyme. Molecular identifiers and adapters       implemented to represent the digestion of DNA sequence
are ligated to the sticky ends of the fragments. Samples            based on the selected restriction enzymes; one RE for original
are then pooled and randomly sheared. Another set of                RAD and two REs for ddRAD. In order to obtain simula-
adapters are attached to the sheared fragments to ensure            tion metrics based on the mapping of RAD loci to the reference
proper amplification. Finally, size selection is performed for      genomic sequence, we used the alignment tool BWA (BWA,
sequence-ready fragments. Random shearing is eliminated in          RRID:SCR_010910) (Li & Durbin, 2009). At present, the
the ddRAD protocol as it uses another restriction enzyme for a      primary output of RApyDS is an interactive HTML file that
second round of digestion instead (Davey & Blaxter, 2010).          can be viewed properly using the Mozilla Firefox browser.

Restriction enzymes are the key elements in RADseq. These are       Original RADseq Simulation. In this protocol, we simulate
essential in determining the genomic regions to be sequenced,       the original RADseq workflow by initially segmenting the
since the patterns of genetic variations to be observed will        reference sequence based on the presence of restriction enzyme
occur adjacent to the corresponding restriction sites (Andrews      cut sites. The procedure therefore assumes a complete diges-
et al., 2016). The choice of which enzyme to use thus deter-        tion of the intact genome. The resulting fragments are then
mines the number of markers that can be obtained and assayed,       further sheared and size-selected according to a user-defined
which in turn determines the amount of sequencing required,         insert size range. This process results into three fragment types:
the number of samples, the cost, and ultimately the success of      (1) those that are deemed too small after shearing and size
the project (Herrera et al., 2015). The lack of prior estimates     selection, (2) those that are within the insert size range but do
on the number of restriction sites, fragments that can be           not contain a sticky end (remnant of the restriction cut site),
produced, density of RAD loci that can be sequenced, or other       and (3) those that are within the defined insert size range and
projected effects of using one or a combination of restriction      contains both sticky and sheared ends. Type 1 fragments are
enzymes are some of the common impediments in successfully          filtered out by the program to simulate the size selection
designing and performing reduced representation library prep-       process in sequencing library preparation. Type 2 fragments,
arations for whole-genome resequencing. It is therefore of          on the other hand, are also filtered out by the program because
utmost importance to have a prior idea on the distribution and      the sticky end resulting from the restriction enzyme activity is

                                                                                                                           Page 3 of 10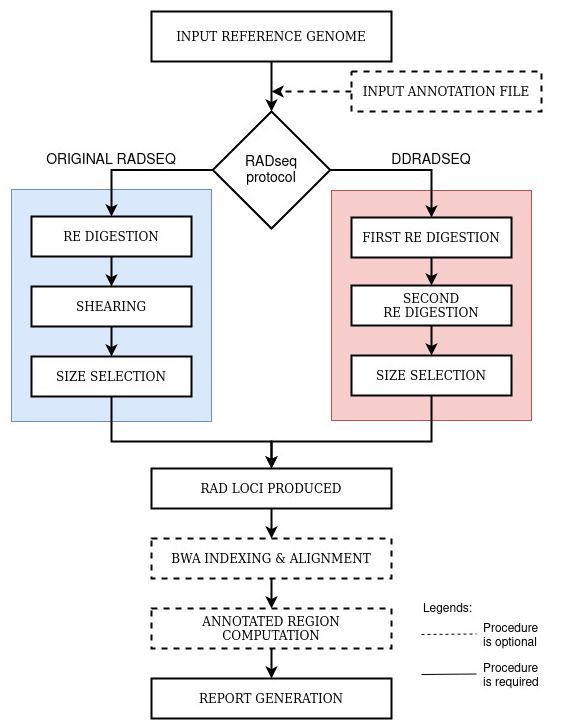
F1000Research 2021, 10:360 Last updated: 12 MAY 2021

Figure 1. Summary of RApyDS workflow.

needed for the attachment of the P1 sequencing adapter. Thus,      fragments are filtered out in the process. Type 2 fragments
only fragments containing a restriction enzyme cut site in one     will also be filtered out because the sticky ends from both
of the ends and whose lengths are within the insert size range     enzymes are necessary for the proper attachment of the sequenc-
(Type 3) will be considered as putative RAD loci for downstream    ing adaptor pairs. At the end of this step, only the Type 3
analysis.                                                          fragments will remain as putative RAD loci.

Double-digest RADseq Simulation. For the ddRAD proto-              Operation
col, the process similarly begins with the segmentation of the     RApyDS software runs on a Linux OS computing machine with
genome based on the positions of the first restriction enzyme      at least Python 3 installed and a minimum system requirement
cut sites. However, instead of implementing a shearing step        of 500 MB free memory (RAM) and a single CPU. Resource
afterwards, a second round of digestion based on the cut sites     consumption will depend on the size of the input genome.
of the second restriction enzyme is done. The resulting frag-      Installation of the Python module dependencies can be done
ments after the two rounds of digestion are then size selected     using pip. A complete guide on installation, usage, software
according to the user-defined insert size range. This procedure    requirements, and specifications can be accessed at https://github.
will generate the following fragment types: (1) those that are     com/pgcbioinfo/rapyds.
shorter than the minimum insert size, (2) those that are within
the insert size range but contain sticky ends from only a single   Use cases
enzyme, and (3) those that are within the insert size range        Program inputs
and contain sticky ends from both of the enzymes used. Again,      The program requires a genome or a DNA sequence in FASTA
to simulate size selection during library preparation, Type 1      format as input. Whenever a corresponding annotation in

                                                                                                                          Page 4 of 10
F1000Research 2021, 10:360 Last updated: 12 MAY 2021
GFF/GTF format is available, this can also be supplied together covered by these loci, single-copy and repetitive loci, and loci
with the sequence to enable counting of RAD loci within within annotated regions if an annotation file has been supplied.
target regions. In cases where a reference genome is not avail- To further facilitate assessment of the results, the table can be
able, the tool can randomly generate a hypothetical reference sorted in increasing or decreasing order based on the values
sequence based on a user-defined GC content and sequence from a particular column by clicking on the column header.
length using the algorithm implemented in SimRAD (Lepais &
Weir, 2014). By default, the tool will evaluate a total of 56 We note here that the number of single-copy and repeti-
commonly used restriction enzymes which recognition tive RAD loci is based on alignment results. In certain cases,
sequences were acquired from New England Biolabs Inc. . The the alignment step may take a substantial amount of time to
users may also select any subset of these enzymes for evalu- complete. Thus, we included a parameter flag to skip the align-
ation and are given the option to add new restriction enzyme ment step if the user prefers to speed up the simulation process
information if these are not yet included in the current list. at the expense of repeat information. Table 2 shows the aver-
age processing times for the following simulations: (i) with
Outputs and implementation features alignment and reference indexing, (ii) with alignment only
A successful RApyDS run will generate a compressed ZIP file wherein an indexed reference is supplied, and (iii) without
as final output. This archived file contains simulation reports alignment. A reduction in processing time of around two to
in hypertext markup language (HTML) format, all of which can five times can be obtained when running RApyDS using the
be accessed interactively through the main file index.html. latter options.
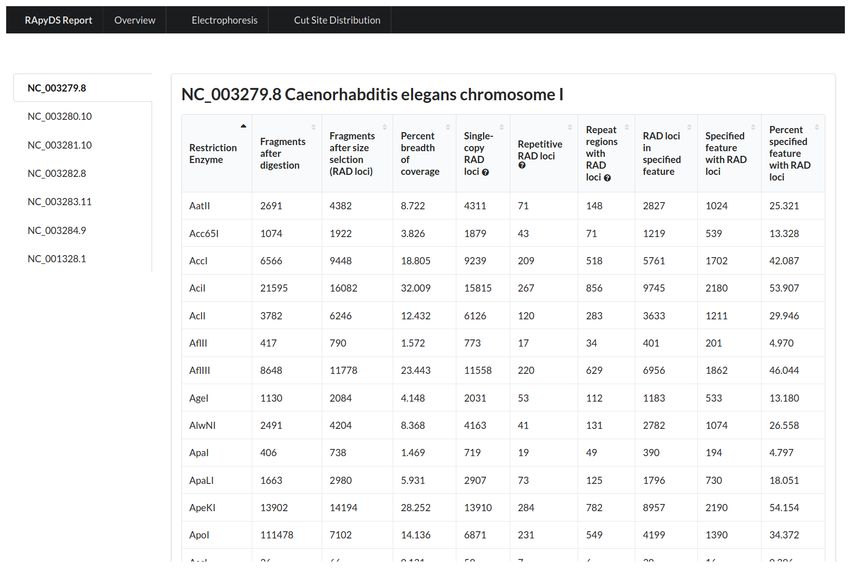
The landing page (Overview tab) shows a table containing
various simulation metrics for each of the restriction enzymes In addition to the overview metrics, graphical views of the
tested (Figure 2). These metrics are described in more detail in results in various forms are also made available to the users.
Table 1. Briefly, the table contains information on the number The first is a virtual gel electrophoresis output based on the
of predicted RAD loci, the breadth of reference sequence obtained fragments after digestion simulations (Figure 3). For this
Figure 2. Overview report of an Original RAD protocol simulation of the C. elegans reference genome.
Page 5 of 10F1000Research 2021, 10:360 Last updated: 12 MAY 2021
Table 1. Description of column headers in the overview page of RApyDs simulation report.
Column headers Description
Restriction enzyme Restriction enzymes tested
Fragments after Number of fragments produced after enzymatic digestion. For ddRAD this accounts for the first and
digestion second digestion.
Fragments after size Number of fragments produced after size selection. This is equivalent to the number of RAD loci produced
selection (RAD loci)
Percent breadth of Percent of the input sequence length covered by the RAD loci
coverage
Single-copy RAD loci Number of RAD loci found only once in the reference sequence. If at least one of the read pairs
representing the RAD loci maps uniquely to the reference genome, the loci is considered to be single-copy.
Repetitive RAD loci Number of RAD loci found multiple times in the reference sequence. If none of the read pairs representing
the RAD loci maps uniquely to the reference genome, the loci is considered to be repetitive.
Repeat regions with Number of repeat regions in the reference sequence harboring RAD loci
RAD loci
RAD loci in specified Number of RAD loci that are found within the specified sequence feature
feature
Specified feature with Number of specified sequence feature in the reference harboring RAD loci
RAD loci
Percent specified Percentage of specified sequence feature with RAD loci based on total number of specified feature
feature with RAD loci
Table 2. Average running time of RApyDS (with histogram graphing skipped) on
each species using a server with 16 CPU Cores of Intel(R) Xeon(R) CPU E5-2640 v2
@ 2.00GHz and 50GB of memory allocation.
Average Processing Time (sec)
FASTA file With Alignment With
Species Without
size (MB) and Reference Alignment
Alignment
Indexing Only
Eescherichia colia 4.50 16.89 14.56 6.41
Caenorhabditis elegansa 97.00 656.18 530.86 132.85
Brassica napusb 943.00 2093.52 722.63 356.56
Aedes aegyptib 1200.00 4092.68 1684.06 584.77
Zea mays b
2000.00 8291.83 4311.70 899.99
Callithrix jacchus b
2700.00 8063.47 2165.91 1288.30
a
RApyDS default parameters (original RAD, entire enzyme database)
b
RApyDS ddRAD parameters (enzymes used: NlaIII-MluCI)
visualization, the user can specify the sizes of the DNA ladder To give the users information on the distribution and den-
rungs to display (Lane 1), and can also choose up to five sity of the enzyme cut sites across the entire length of the
enzymes for which the simulated banding patterns will be reference sequence, the tool also outputs a view of the cut
shown (Lanes 2 to 6). This particular view can be helpful site distribution for each of the enzymes included in the
to researchers who are more adept at assessing the utility of simulation (Figure 4). This view can be magnified to focus
restriction enzymes based on gel electrophoresis profiles. on specific regions with greater resolution. A histogram
Page 6 of 10F1000Research 2021, 10:360 Last updated: 12 MAY 2021
Figure 3. Gel visualization of the simulation results on C. elegans reference genome using an Original RAD protocol with
BamHI, BstYI, PstI, SbfI and NotI as REs.
of the enzyme cut site density per binned region is also can be utilized to evaluate which restriction enzyme or restric-
generated. tion enzyme pair can generate the desired RAD loci den-
sity and distribution given a range of insert sizes and within
Sample application certain genomic features (e.g., genes, exons) if an annota-
In general, the users can do RAD simulations for a given tar- tion file is supplied. By default, the tool will also output the
get fragment size range to be generated from one or more REs number of single- and multi-copy RAD loci based on mapping
available in the tool’s database. Alternatively, if a particular RE information, which can also be a consideration in deciding
is not included in the database, information on this RE can be which particular restriction enzyme to use.
manually added and subsequently used. It is also recom-
mended for the users to have a prior idea of an appropriate
reference genome to be used in estimating the distribution of To demonstrate the use of RapyDS, an original RAD simula-
target features across the entire genome length. For instance, tion was implemented on the C. elegans reference genome
in capturing polymorphic sites, the number of RAD loci using all the REs present in the tool’s database. Figure 2 shows
may drastically change when using common cutter enzymes a portion of the results arranged alphabetically based on RE
exclusively or in combination with rare cutter enzymes. names. We can infer from these results that using AciI on
C. elegans chromosome I produced the highest number of
Certain resequencing studies also involve calling variants RAD loci (16,082), covering 32% of the reference sequence
using whole genome data sets sequenced at low coverage length with the default size selection range of 200-300 bp.
depth in an attempt to reduce the overall sequencing cost. How- Based on alignment results, AciI enzyme is predicted to yield
ever, a RADseq approach can result in a similar cost reduction mostly single-copy RAD loci (15,815), with only 1.66%
(O’Rourke et al., 2011) without sacrificing coverage depth and (267) repetitive RAD loci detected and 5.32% (856) occur-
variant loci density if an appropriate set of restriction enzymes ring at repeat regions. The number of sequenced repetitive RAD
is used. Specifically, enzymes that can generate a relatively loci and/or RAD loci repeat regions can pose issues in down-
even fragment length distribution across the entire genome stream analysis that are heavily dependent on mapping and
are generally desirable (Roszik et al., 2017). Thus, RApyDS alignment approaches.
Page 7 of 10F1000Research 2021, 10:360 Last updated: 12 MAY 2021
Figure 4. Cut site and RAD loci density distribution of the restriction enzyme Acc65I on chromosome I of C. elegans.
Future developments NCBI Assembly: ASM584v2. RefSeq assembly accession:
There are certain biological factors not accounted for in GCF_000005845.2
the current implementation of RApyDS that may affect actual
RADSeq experiments. For instance, certain restriction NCBI Assembly: B73 RefGen_v4. RefSeq assembly accession:
enzymes can be sensitive to the methylation state of a particu- GCF_000005005.2.
lar nucleotide (Mülhardt & Beese, 2007), which is usually not
reflected in the reference sequence. Single nucleotide polymor- NCBI Assembly: Bra_napus_v2.0. RefSeq assembly accession:
phisms in the enzyme recognition sites can also result in allele GCF_000686985.2.
drop-outs that can further lead to a systematic underestima-
tion of the overall diversity in population studies, particularly
NCBI Assembly: Callithrix jacchus-3.2. RefSeq assembly
for organisms with relatively high mutation rates (Andrews
accession: GCF_000004665.1.
et al., 2016). We will try to further incorporate some of these
biological considerations in future releases of RApyDS in
order to obtain simulation metrics that can more closely reflect NCBI Assembly: WBcel235. RefSeq assembly accession:
the results from real experimental data sets. GCF_000002985.6.
Data availability Software availability
Underlying data Source code available from: https://github.com/pgcbioinfo/rapyds.
NCBI Assembly: AaegL5.0. RefSeq assembly accession:
GCF_002204515.2. License: GNU General Public License v3 (GPLv3).
Page 8 of 10F1000Research 2021, 10:360 Last updated: 12 MAY 2021
References
Andrews KR, Good JM, Miller MR, et al.: Harnessing the power of RADseq for Burrows-Wheeler transform. Bioinformatics. 2009; 25(14): 1754–1760.
ecological and evolutionary genomics. Nat Rev Genet. 2016; 17(2): 81–92. PubMed Abstract | Publisher Full Text | Free Full Text
PubMed Abstract | Publisher Full Text | Free Full Text Mülhardt C, Beese EW: The Tools. Molecular Biology and Genomics. Oxford:
Baird NA, Etter PD, Atwood TS, et al.: Rapid SNP Discovery and Genetic Academic Press. 2007; 37–63.
Mapping Using Sequenced RAD Markers. PLoS One. 2008; 3(10): e3376. Publisher Full Text
PubMed Abstract | Publisher Full Text | Free Full Text Meger J, Ulaszewski B, Vendramin GG, et al.: Using reduced representation
Davey JW, Blaxter ML: RADSeq: next-generation population genetics. Brief libraries sequencing methods to identify cpDNA polymorphisms in
Funct Genomics. 2010; 9(5–6): 416–423. European beech (Fagus sylvatica L). Tree Genet Genomes. 2019; 15(1): 7.
PubMed Abstract | Publisher Full Text | Free Full Text Publisher Full Text
Davey JW, Cezard T, Fuentes-Utrilla P, et al.: Special features of RAD O’Rourke SM, Yochem J, Connolly AA, et al.: Rapid Mapping and Identification
Sequencing data: implications for genotyping. Mol Ecol. 2013; 22(11): of Mutations in Caenorhabditis elegans by Restriction Site-Associated DNA
3151–3164. Mapping and Genomic Interval Pull-Down Sequencing. Genetics. 2011;
PubMed Abstract | Publisher Full Text | Free Full Text 189(3): 767–778.
Etter PD, Bassham S, Hohenlohe PA, et al.: SNP discovery and genotyping for PubMed Abstract | Publisher Full Text | Free Full Text
evolutionary genetics using RAD sequencing. Methods Mol Biol. 2011; 772: Peterson BK, Weber JN, Kay EH, et al.: Double Digest RADseq: An Inexpensive
157–178. Method for De Novo SNP Discovery and Genotyping in Model and Non-
PubMed Abstract | Publisher Full Text | Free Full Text Model Species. PLoS One. 2012; 7(5): e37135.
Herrera S, Reyes-Herrera PH, Shank TM: Predicting RAD-seq Marker Numbers PubMed Abstract | Publisher Full Text | Free Full Text
across the Eukaryotic Tree of Life. Genome Biol Evol. 2015; 7(12): 3207–3225. Roszik J, Fenyőfalvi G, Halász L, et al.: In Silico Restriction Enzyme Digests to
PubMed Abstract | Publisher Full Text | Free Full Text Minimize Mapping Bias in Genomic Sequencing. Mol Ther Methods Clin Dev.
Lepais O, Weir JT: SimRAD: an R package for simulation-based prediction 2017; 6: 66–67.
of the number of loci expected in RADseq and similar genotyping by PubMed Abstract | Publisher Full Text | Free Full Text
sequencing approaches. Mol Ecol Resour. 2014; 14(6): 1314–1321. Shendure J, Ji H: Next-generation DNA sequencing. Nat Biotechnol. 2008;
PubMed Abstract | Publisher Full Text 26(10): 1135–1145.
Li H, Durbin R: Fast and accurate short read alignment with PubMed Abstract | Publisher Full Text
Page 9 of 10F1000Research 2021, 10:360 Last updated: 12 MAY 2021
The benefits of publishing with F1000Research:
• Your article is published within days, with no editorial bias
• You can publish traditional articles, null/negative results, case reports, data notes and more
• The peer review process is transparent and collaborative
• Your article is indexed in PubMed after passing peer review
• Dedicated customer support at every stage
For pre-submission enquiries, contact research@f1000.com
Page 10 of 10You can also read