Revised Regulatory Impact Statement: Single-use Plastics By-law October 2019 - Hobart City Council
←
→
Page content transcription
If your browser does not render page correctly, please read the page content below
10.19
Revised Regulatory
Impact Statement:
Single-use Plastics By-law
October 2019

        hobartcity.com.au/singleuseplastics
EXECUTIVE SUMMARY
     The Hobart City Council resolved on 4 March 2019 to introduce a Single Use Plastics By-Law
     banning single use plastic takeaway packaging from Hobart food retailers. As part of this process,
     the City prepared and submitted to the Director of Location Government a Regulatory Impact
     Assessment (RIS) on the proposed by-law. This revised RIS addresses additional questions posed
     by the Director of Local Government, encompassing the current state of takeaway packaging in
     the City of Hobart and providing a policy impact analysis. The impact analysis includes:
     •     A Cost Benefit Analysis (CBA).
     •     An assessment of inter-council competition impacts.
     To gain some insight into the state of Hobart’s takeaway packaging, a survey of food retailers
     provided information on number of packaging units per annum and tonnage of packaging per
     annum. When viewed by units per annum: 55% of takeaway packaging was compostable, 43%
     was landfill, and 2% recycling. When viewed by tonnes per annum: 67% was compostable,
     30% landfill and 3% recyclable. The difference between units and weight is likely due to the
     lightweight nature of single-use plastic packaging, such as straws and drink stirrers.
     Using data gather from a food retailer survey, the level of single-use plastic litter was estimated. It
     was approximated that 9,030,180 pieces of single-use plastic are littered each year in the City of
     Hobart. When expressed as a weight, this worked out to be 36.85 tonnes of single-use plastic per
     year in plastic litter. Further investigation lead to the conclusion that a mandatory ban on single-
     use plastic would result in a 25% reduction in land-based litter.
     During the policy impact analysis it was estimated that the average increase in food retailer
     packaging costs would be approximately $700 per annum. Takeaway food retailers and Bakeries
     were found to have the highest average increase in packaging costs. The maximum increase in
     annual costs was approximately $21,000, while the minimum was -$175.
     Two scenarios were tested over a six year period (2019 to 2025) during the Cost Benefit Analysis
     (CBA);
     •     A Mandatory Ban by-law.
     •     A Voluntary Program.
     The results of the CBA can be seen below:

                                            Option 1: Voluntary program           Option 2: By-law

         NPV                                -$1,379,577                           -$2,710,318

         Units of landfill (LF) plastic     81,759,921                            148,650,145
         avoided

         Tonnes of landfill (LF)            334                                   607
         plastic avoided

ii                                                        Revised Regulatory Impact Statement: Single-use Plastic By-law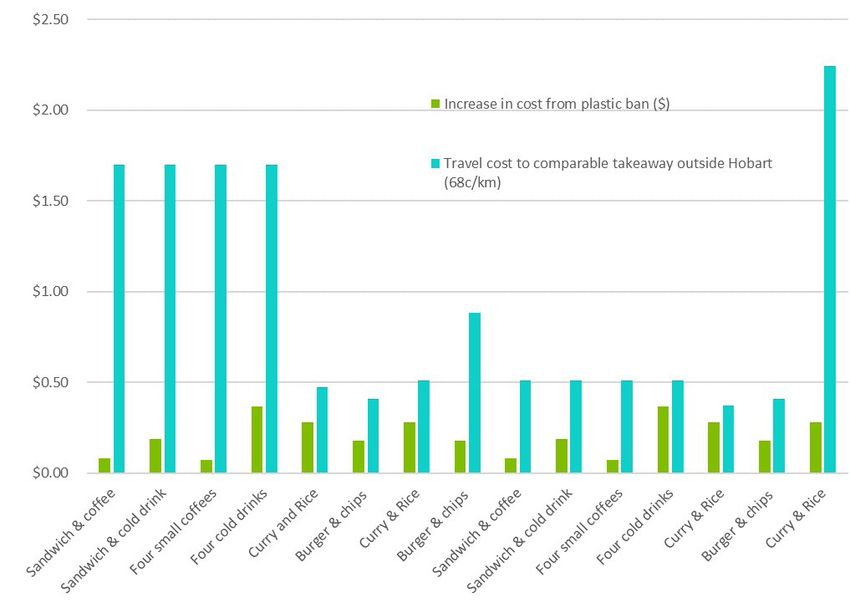
It is acknowledged that the CBA benefits were conservatively priced. Some benefits were possibly
under-priced and at least one potential benefit was given a zero value; marine biodiversity. A
Benefit Transfer carried out separately to the CBA, estimated the value of conserving 10% of
marine biodiversity in the Hobart region to be approximately $4,500,000.
The competition impact analysis, carried out by SGS Economics and Planning showed that Hobart
takeaway food prices already have a premium over neighbouring councils. When travel costs
were compared against the increased cost of takeaway packaging, travel costs were found to
be greater than the increase in packaging costs. It was concluded there would be no significant
impact on competition from restrictions on single-use plastics. However, there is some risk that
national or multi-national chains may outsource their packaging to avoid the by-law.
The revised RIS took four findings into consideration when deciding upon the appropriate course
of action:
•   The Net Present Value (NPV) results from the CBA.
•   The amount of waste avoided.
•   The Benefit Transfer.
•   The assessment of inter-council competition impacts.
If the assumptions behind the Benefit Transfer stand, then the losses seen in the CBA would be
neutralised. This leaves the Single-use Plastics by-law as being the preferred option, due to the
greatest waste and litter avoidance and little to no competition impact.

Revised Regulatory Impact Statement: Single-use Plastic By-law                                      iii
ACRONYMS
     APCO   Australian Packaging Covenant 		    LGA          Local Government Area
            Organisation                        MRF          Material Recovery Facility
     ATO    Australian Tax Office               NPV          Net Present Value
     BCR    Benefit Cost Ratio                  PLA          Polylactic Acidw
     CBA    Cost Benefit Analysis               PV           Present Value
     CUAD   Clean Up Australia Day              RIS          Regulatory Impact Statement
     EPR    Extended Producer
            Responsibility

iv                                             Revised Regulatory Impact Statement: Single-use Plastic By-law
GLOSSARY
Compostable means (when used in relation                         Net Present Value (NPV) is the difference
to a bioplastic), when treated in an industrial                  between the present value of cash inflows and
composting facility, the following requirements                  present value of cash outflows over a period
are met: (a) 60% decomposition (aerobic)                         of time.
within 180 days, (b) 90% disintegration to less
than 2mm in 84 days, and (c) is non-toxic.                       Plastic means a material that contains large
                                                                 molecular weight organic polymeric substances
Food packaging means any container which                         as an essential ingredient, but does not include
used to carry food from a retailer’s premises                    plastic which is compostable.
to the point where the food is consumed, and
related items, included but not limited to: (a)                  Single-use product means a product that is
tubs and lids, (b) cups and cup lids, (c) utensils,              not conceived, designed or placed on the
including cutlery, stirrers and straws, and (d)                  market to accomplish, within its life span,
sachets or packets which provide single serves                   multiple use by being returned to the retailer
of condiments including but not limited to soy                   for refill or re-used for the same purpose for
sauce, wasabi and tomato sauce.                                  which it was conceived.

Industrial composting facility means a
commercial scale facility which provides
composting services at a minimum
temperature of 55°C for at least 15 days
(which may be non-consecutive) during the
composting period.
Non-toxic means that the following tests
are satisfied:
a. Plant germination test. The germination
   rate and the plant biomasss from a sample
   compost (using compost derived from the
   food packaging) shall be more than 90% of
   the germination rate and the plant biomass
   from a sample compost which does not
   contain the food packaging.
b. Packaging composition test. The food
   packaging will not exceed the following
   elemental limits: Zn 1400mg/kg, Cu 750
   mg/kg, Ni 210 mg/kg, Cd 17 mg/kg, Pb
   150 mg/kg, Hg 8.5 mg/kg, Se 50 mg/kg,
   As 20.5 mg/kg.

Revised Regulatory Impact Statement: Single-use Plastic By-law                                                      v
CONTENTS
1. Purpose of a Regulatory Impact Statement 1
2. Objectives of the by-law 1
3. Background and context of the City’s takeaway packaging 2
3.1 The City’s Takeaway Packaging Profile 2
3.2 The whole litter stream 6
3.3 Related plastic waste actions 9
4. Impact on business and restriction of competition 11
4.1 Change in takeaway packaging costs 12
4.2 Method to test cross-border competition impact 13
4.3 Competition impacts and travel costs 16
4.4 National and multi-national chains vs small business 18
5. Options to address the problem 19
6. Policy impact analysis 20
6.1 Cost Benefit Analysis 20
6.2 Benefit Transfer - to assess value of Hobart’s marine diversity 26
7. Proposed Public Consultation Process 27
References 28
Appendix 30
Appendix A: Survey structure 30
Appendix B: Assumed weight per product type 34
Appendix C: Average number of Takeaway packaging products
and material types per week 35
Appendix D: Litter figures derived from survey 36
Appendix E: Packaging types vs material types 37
Appendix F: Change in packaging costs 38
Appendix G: Cost Benefit Analysis 39
Appendix H: Benefit Transfer 42
Appendix I: Packaging cost as a proportion of meal price 43
vi Revised Regulatory Impact Statement: Single-use Plastics By-law1. PURPOSE OF A REGULATORY IMPACT STATEMENT
When a council seeks to make a new by-law or This RIS will assess two options to reduce
a significant amendment to an existing by-law, the effect of Single-Use Plastic Takeaway
the Local Government Act 1993 requires a Packaging on the environment:
Regulatory Impact Statement (RIS) be prepared.
• A voluntary program
The preparation of a RIS is a rigorous process
aimed at analysing the most efficient and • A mandatory ban on single-use plastic
effective options available to address a particular takeaway packaging
issue and avoiding unnecessary regulation. The voluntary program envisages an
A RIS is required to identify whether the accreditation system managed by the City
benefits of regulation outweigh the cost of of Hobart (hereafter referred to as ‘the City’),
a restriction on competition or an impact on used to encourage food retailers to move away
business imposed by the by-law. It requires from single-use plastics. A mandatory ban
an assessment of direct and indirect social, describes the creation of a by-law, mandating
economic and environmental impacts of the the removal of single-use takeaway plastic
proposed by-law and alternatives considered. packaging from food retailers.
A RIS should also briefly detail its purpose
and the statutory context in which it operates
to help the general public understand the
function and role.
2. OBJECTIVES OF THE BY-LAW
The City has the following aims in relation to single-use plastics:
• To minimise the exposure of community and the environment to the risks and harm associated
with single-use plastic in takeaway food packaging.
• To reduce the overall quantity of plastic litter arising from takeaway food retailing, and its long-
term impacts.
• To provide a stimulus for the development and uptake of innovative and sustainable takeaway
food packaging solutions.
• To align the practices of takeaway food retailers with growing community concern regarding the
risks of single-use plastic in everyday life.
Revised Regulatory Impact Statement: Single-use Plastics By-law 13. BACKGROUND AND CONTEXT OF THE CITY’S
TAKEAWAY PACKAGING
To provide additional context for the policy impact discussion, this section of the RIS presents the
current profile of the City’s takeaway packaging, provides additional information about Hobart’s litter
stream and discusses other single-use plastic policy being implemented.
3.1 THE CITY’S TAKEAWAY PACKAGING PROFILE
Hobart food retailers use a diverse mix of takeaway packaging. This has been demonstrated by a
survey of Hobart food retailers, which provided insight into takeaway product types and takeaway
product material types. Twelve takeaway packaging products were included in the survey and are
presented in Table 1. Additional detail regarding the survey structure can be found in Appendix A.
Table 1. List of products included in the Food Retailer survey
Surveyed Products
Hot chip containers Drink stirrers
Noodle boxes Straws
Sandwich wedges Coffee cups
Food containers Coffee cup lids
Cutlery Cold drink cups
Sauce sachets Cold drink cup lids
When profiled by material type, takeaway packaging was categorised into nine categories (Table
2). These categories were subsequently separated into ‘plastic’ or ‘plastic free’ products. Takeaway
packaging labelled ‘plastic free’ included materials such as paper/cardboard, compostable
bioplastic, wood, aluminium/cardboard, and cardboard/bioplastic. ‘Plastic’ or ‘plastic composite’
takeaway packaging consisted of plastic, cardboard/plastic, aluminium/plastic and unknown material
types. A summary of these categories can be seen in Table 2.
Table 2. Material types included in plastic free or plastic categories
Plastic free Plastic or plastic composite
Paper/cardboard Plastic
Compostable Bioplastic (e.g. Cardboard/plastic
PLA)
Wood Aluminium/plastic
Aluminium/cardboard Unknown
Cardboard/bioplastic
2 Revised Regulatory Impact Statement: Single-use Plastics By-lawUsing the categories from Table 1 and 2, the food retailer survey provided a profile of the City’s
takeaway packaging (Figure 1). Food containers and Hot Chip containers were predominantly plastic
free, being dominated by paper/cardboard packaging (see Appendix C). A review of coffee cups
and cold drink cups demonstrated that a significant proportion were cardboard/PLA lined, wholly
PLA or wholly cardboard compostable cups. PLA or wooden cutlery and PLA coffee cups lids were
also in common use. However, the survey demonstrated that the remaining products are mostly
single-use plastic packaging.
Hobart takeaway packaging profile
1.60E+07
Hobart takeaway packaging (units/annum)
Plastic free
1.40E+07
Plastic or plastic composite
1.20E+07
1.00E+07
8.00E+06
6.00E+06
4.00E+06
2.00E+06
0.00E+00
Figure 1. Plastic free vs plastic takeaway packaging (by product type)The survey data also allowed for estimation of the quantities of takeaway packaging considered
landfill, recyclable or compostable. The City’s annual usage was forecasted using; a weekly
packaging profile of an ‘average’ City food retailer, the categories seen in Table 3, and Equation
1. The results from this analysis can be seen in Figure 2. It should be noted that the use of these
categories does not account for incorrect disposal, and therefore should only be used to understand
the composition of the takeaway waste stream, not the final destination of takeaway packaging.
Table 3. Product types and their construction material matched to disposal categories
Landfill Recycling Composting
Plastic lined noodle boxes Rigid plastic sandwich Cardboard hot chip containers
wedges
Plastic cutlery Rigid plastic food containers Bioplastic (PLA) sandwich
wedges
Plastic sauce sachets Bagasse food containers
Plastic drink stirrers Bioplastic (PLA) food containers
Plastic straws Cardboard food containers
Plastic lined coffee cups Bioplastic (PLA) cutlery
Plastic coffee cup lids Wood cutlery
Plastic lined cold drink Wood drink stirrers
cups
Plastic cold drink cups Bioplastic (PLA) drink stirrers
Plastic cold drink cup lids Paper straws
Bioplastic (PLA) straws
Bioplastic (PLA) lined coffee cups
Bioplastic (PLA) coffee cup lids
Bagasse coffee cup lids
Bioplastic (PLA) lined cold drink
cups
Paper cups
Bioplastic (PLA) cold drink cups
4 Revised Regulatory Impact Statement: Single-use Plastics By-lawunits
City units per annum=average week
×52 weeks ×1083 food retailers 4/2 [1]
The annual tonnage of takeaway packaging has also been calculated using assumed weights for
each type of packaging. These assigned weights, for the twelve products in Table 1, can be found in
Appendix B. The results from these calculations can be seen in Figure 2.
When viewed by ‘weight’, 30% of Hobart’s takeaway packaging contains plastic. However, when
viewed by ‘number of items’ this increases to 43%. This significant change is likely due to small,
lightweight plastic products, such as drink stirrers and straws, having minimal impact on litter weight
but a large impact on unit count.
total Hobart usage (units/annum) Hobart Takeaway Packaging Annual Mass
(Tonnes)
183.46
33,445,112 30%
43%
42,172,284 408.69
55% 67%
19.62
3%
1,739,739
2%
Compost Recycling Landfill
Figure 2. (a) City of Hobart Takeaway packaging quantities by number of units,
and (b) takeaway packaging quantities by weight.
Revised Regulatory Impact Statement: Single-use Plastics By-law 5It is also possible to include litter as a disposal category, if an assumption is made about the
proportion of takeaway packaging becoming litter. In a 2014 Regulatory Impact Statement
investigating plastic bag bans, a litter rate of 27% was used for ‘away from home’ packaging1. If this
proportion is applied to the figures seen in Figure 2, this would result in 165.18 tonnes of litter per
annum or 20,886,426 pieces of litter. If it is assumed that the proportions seen in Figures 2 (a) and
(b) are the same for litter, this results in the quantities seen in Table 4. Additional information about
litter quantities can be found in Appendix D.
Table 4. City of Hobart takeaway packaging litter quantities derived from takeaway packaging survey
Units/annum Tonnes/annum
Compostable 11,386,517 110.35
Recyclable 469,729 5.30
Landfill 9,030,180 49.53
Total 20,886,426 165.18
3.2 THE WHOLE LITTER STREAM
It is also necessary to consider how takeaway packaging litter fits within the whole City litter stream.
This requires asking:
• What proportion of the Hobart litter stream is takeaway packaging?
• What proportion of City of Hobart land-based litter enters the Derwent Estuary?
• What proportion of Derwent Estuary plastic litter originates from the City of Hobart?
• The rate compostable packaging decomposes when littered.
When these questions are resolved, it is possible to determine the estimated impact of reducing
plastic takeaway packaging will have on the City and the Derwent Estuary litter levels.
1
NEPC, 2014, Packaging Impacts: Decision Regulation Impact Statement
6 Revised Regulatory Impact Statement: Single-use Plastics By-lawTable 5. Domestic and international action on single-use plastics reduction
Query Answer
A What proportion This analysis will use data from the National Litter Index, 50%
of the Hobart that infers approximately 50% of the litter stream is takeaway
litter stream packaging2.
is takeaway
packaging?
B What proportion When investigating the proportion of land-based litter that 80%
of City of Hobart enters the Derwent Estuary, it is possible to rely on existing
land-based academic studies. For instance, the Ocean Conservancy
litter enters the estimates that 59% of all marine litter is from land-based
Derwent Estuary? shoreline and recreational activities. An academic study
estimated that about 80% of marine plastics come from land,
while UNEP assumes 100% of land based litter becomes
marine litter3 4. This RIS will assume that 80% of land-based
litter will reach the Derwent Estuary.
C What proportion The proportion of plastic litter that the City of Hobart 20%
of Derwent contributes to the Derwent Estuary is unknown. However, the
Estuary plastic City of Hobart is one of five major metropolitan councils with
litter originates significant Derwent Estuary coast lines. Ideally, an analysis
from the City of would be made of these councils and the quantity of plastic
Hobart? litter they release into the Derwent Estuary. As this data is not
currently accessible, an assumption will be made that the City
of Hobart contributes 20% of the plastic litter found in the
Derwent Estuary.
D The rate There is also considerable uncertainty around the behaviour 50%
compostable of certified compostable packaging when present as land or
packaging marine litter. The City of Hobart will estimate a 50% drop in
decomposes takeaway packaging litter levels (by number of items) if the by-
when littered. law is implemented. This estimate is based upon the following:
• As paper, cardboard, bagasse and wood are home
compostable, they will compost over weeks or months
if littered5.
• All known products impacted by the by-law have home
compostable options except for coffee cups, sandwich
wedges and cold drink cup lids (see Appendix E).
• Compostable bioplastics that are coated onto paper/
cardboard will experience significant decomposition over 1
to 2 years in a land-based or marine environment6.
• Solid compostable bioplastics (e.g. PLA cutlery, PLA cup
lids,PLA bioplastic cups, PLA bioplastic bowls) will take a
significant time to decompose as terrestrial or marine litter7.
2
KAB, 2018, National Litter Index – Tasmania (Cigarette butts and General other excluded)
3
Li, W.C. et al, 2016, Plastic waste in the marine environment: A review of sources, occurence and effects
4
UNEP, 2014, Valuing Plastic: The Business Case for Measuring, Managing and Disclosing Plastic Use in the Consumer Goods Industry
5
5 Gyres, 2017, Better Alternatives Now: Ban List 2.0, pg 21
6
ibid
7
5 Gyres, 2017, Better Alternatives Now: Ban List 2.0, pg 21 & 23
Revised Regulatory Impact Statement: Single-use Plastics By-law 7When combined, these assumptions result in a 25% reduction in land litter and a 4% reduction in
marine litter. The land litter figure was derived using figures discussed in this section and Equation 2,
and marine litter was calculated from figures discussed in this section and Equation 3.
( 100
A
x - 100
D
) x 100 = % reduction in land litter [2]
( 100
A
x 100
B
x 100
C
x - 100
D
) x 100 = % reduction in marine litter [3]
The City of Hobart will encourage the use of takeaway packaging using a hierarchy system,
prioritising avoidance or reduction of takeaway packaging, followed by the use of reusable
containers, then home compostable packaging, and finally industrial compostables or non-plastic
recyclables (Figure 3).
Avoid takeaway packaging
Reduce takeaway packaging
Adopt reusable
takeaway packaging
Adopt home compostable
takeaway packaging
Adopt industrial compostable
or non-plastic recyclable
takeaway packaging
Figure 3. Takeaway packaging hierarchy
8 Revised Regulatory Impact Statement: Single-use Plastics By-law3.3 RELATED PLASTIC WASTE ACTIONS The City of Hobart Single-use Plastics By-law is not an isolated action on single-use plastics. A non-exhaustive summary of related policies at a local, state, national and international level can be seen in Table 3. For instance, the City of Hobart waste strategy focuses upon litter clean-up and offers general support for Extended Producer Responsibility (EPR). The reference to an EPR infers support for the 2025 the Australian Packaging Covenant Organisation (APCO) targets, a national packaging EPR program. APCO is a co-regulatory body, working with its business members and government to meet the packaging goals seen in Table 3, and its targets are likely to be a significant influence on the use of single-use plastics nationwide8. Two of the APCO targets also appear in similar form in the Draft Tasmanian Waste Action Plan, released by the Tasmanian state government in June 2019; • 100% of packaging to be reusable, recyclable or compostable by 2025 • the elimination of problematic single-use plastics As there is reference to the APCO targets at the local, state and national level; this suggests they will be a key influence on all single-use plastic packaging over the next six years, and should be considered in any impact analysis of the Single-use Plastics By-law. In addition, the South Australian (SA) and European Union (EU) have announced single-use plastic product bans.9 10 A list of impacted products can be seen in Table 3. These product bans, while being significant new policy, do not directly impact single-use plastics in the City of Hobart. 8 APCO, 2019, Australian Packaging Covenant Strategic Plan 2017-2022 9 EP, 2019, Reduction of the impact of certain plastic products on the environment 10 GI, 2019, Turning the tide on single-use plastic products: Approach and next steps Revised Regulatory Impact Statement: Single-use Plastics By-law 9
Table 5. Domestic and international action on single-use plastics reduction

                                        Target/ Products banned
          City of Hobart                •    Action 5.1: Support extended producer responsibility programs to
          Waste Management                   address localised litter generation and removal
          Strategy11
                                        •    Action 5.2: Continue to refine the public waste and recycling bin
                                             program, including locations, sizes, and collection frequencies, and
                                             increasing the number of recycling bins.
                                        •    Action 5.6: Monitor the quality and appearance of waterways through
                                             regular testing and litter reduction measures.
          Tasmanian Waste               •    Ensure 100% of packaging is reusable, recyclable or compostable
          Action Plan12                      by 2025.
                                        •    Have the lowest incidence of littering in the country by 2023.
                                        •    Work at the national level and with local government and businesses in
                                             Tasmania to phase out problematic and unnecessary plastics by 2030.
          South Australia13             •    Banning plastic straws, cutlery, and drink stirrers.
                                        •    Also considering the banning of polystyrene containers and cups,
                                             coffee cups and reusable plastic bags.

          National Waste Policy         •    100% of packaging to be reusable, recyclable or compostable
          (APCO targets)14                   by 2025.
                                        •    70% of Australia’s plastic packaging will be recycled or composted
                                             by 2025.
                                        •    30% average recycled content will be included across all packaging
                                             by 2025.
                                        •    Problematic and unnecessary single-use plastic packaging will be
                                             phased out through design, innovation or introduction of alternatives.

          EU15                          •    Ban on plastic cutlery, cotton buds, plastic plates, plastic balloon sticks,
                                             oxo-degradable plastics, plastic food containers, expanded polystyrene
                                             cups, straws and drink stirrers by 2021.

     11
        COH, 2016, Waste Management Strategy 2015-2030
     12
        DPIPWE, 2019, Draft Waste Action Plan, pg 10
     13
        GI, 2019, Turning the tide on single-use plastic products: Approach and next steps
     14
        APCO, 2019, Australian Packaging Covenant Strategic Plan 2017-2022
     15
        EP, 2019, Reduction of the impact of certain plastic products on the environment

10                                                                        Revised Regulatory Impact Statement: Single-use Plastics By-law
4. IMPACT ON BUSINESS AND RESTRICTION OF
COMPETITION
This section examines the possibility of businesses within Hobart City Council losing business
to neighbouring areas as a result of increased prices resultant of the plastic by-law. Section 4.1
examined the impact of a plastic ban on takeaway packaging prices, using data collected from the
survey of food retailer packaging.
Sections 4.2, 4.3 and 4.4 include an investigation of cross-municipality competition impacts, a
review of the likelihood of bylaw shifting demand to lower-cost municipalities, and a discussion
regarding possible biases towards National and multi-national companies over small business.
These analyses were completed by SGS Economics and Planning. Figure 6 highlights the City of
Hobart and surrounding councils to provide context for municipality competition.
Figure 4. Hobart City Council & Neighbouring Councils, 2016
Revised Regulatory Impact Statement: Single-use Plastics By-law 114.1 CHANGE IN TAKEAWAY PACKAGING COSTS
Using the survey responses from Hobart food retailers, the change in annual packaging costs were
able to be estimated. To achieve this, a generic price change was assumed for each of the twelve
takeaway packaging items seen in the survey (see Appendix F). These price changes were then
multiplied against the annual packaging use for each of the survey responders. The City of Hobart
registered food business database was used to categorise food retailers by business type (e.g.
Takeaway food retailer, Bar & Brewery). The results of these calculations can be seen in Figure 5.
25000
Additional packaging costs per annum ($/annum)
20000
Food Manufacturer
Café & Restaurant
School Canteen
15000
Home Kitchen
Bar & Brewery
Food vehicle
Food Stall
Takeaway
Butcher
Bakery
10000
Vessel
Retail
5000
0
05 01 00 1502 00
-5000
Hobart Food Retailers
Figure 5. Annual change in takeaway packaging costs
for food retailer survey responders, by business type
When these results are reviewed, some interesting patterns are observed (Table 6). There appear
to be a category of highly impacted food retailers, and a second class of retailers experiencing
milder packaging cost effects. In the high risk category we found Takeaways, Bakeries, Butchers
and Cafes & Restaurants. This group is characterised by a higher average annual increase in
packaging cost, particularly regarding the Takeaway food businesses. Within the Takeaway
retailers, we also saw the maximum increase in annual packaging cost. This maximum indicated
that high customer volume takeaway franchises would likely be heavily impacted by a ban on
single-use takeaway plastics.
The low risk category of food retailers consisted of mobile businesses and businesses unlikely
to use high quantities of single-use packaging, with average annual increases in packaging cost
ranging from zero to the low hundreds. Zero values represented no change in annual packaging
costs. This may occur because a business does not use takeaway packaging, or has already
adopted non-plastic takeaway packaging.
12 Revised Regulatory Impact Statement: Single-use Plastics By-lawTable 6. Change in annual takeaway packaging costs
Average annual Min ($) Max ($) Median ($)
change in costs
($)
Food 0 0 0 0
Manufacturer
Home Kitchen 0 0 0 0
Bar & Brewery 0 0 0 0
Vessel 0 0 0 0
Retail $5.61 0 $53.04 0
School Canteen $21.23 0 $127.4 0
Food Stall $62.54 0 $1393.6 0
Food Vehicle $153.24 0 $603.2 0
Café & $674.94 0 $7612.8 $195
Restaurant
Butcher $696.80 $696.80 $696.80 $696.80
Bakery $2861.69 0 $6579.56 $2433.6
Takeaway $2956.02 -$175.76 $21060 $483.6
Total $700.90 -$175.76 $21060 0
4.2 METHOD TO TEST CROSS-BORDER
COMPETITION IMPACT
This assessment is based on the reasoning that the single-use plastic by-laws in the City could
have cross-border competition impacts if:
• Takeaway food prices close to the borders were similar.
• The plastic ban increases the price of takeaway food in Hobart.
• Travel costs from Hobart to the nearest takeaway in a neighbouring LGA are less than the
price impact of the plastic ban.
To test this theory, SGS conducted a search of online menus for cafes and restaurants with similar
takeaway options within the Council areas of Hobart, Glenorchy and Kingborough, focusing on
food outlets close to the council borders.
Revised Regulatory Impact Statement: Single-use Plastics By-law 13Glenorchy and Kingborough Councils were selected for comparison as they share borders with
the City and have retail/hospitality offerings that are within 5km of similar offerings on the other
side of the Council border. Clarence City Council and Brighton Council were not chosen as there
are no comparable retail/hospitality offerings within 5km of similar offerings in the City of Hobart.
Table 7 shows the average prices of five typical and comparable takeaways in Hobart,
Kingborough and Glenorchy, mostly from restaurants or cafes close to the LGA borders. The
average price of the drinks was the same in all three LGAs, while the average price of takeaway
meals was higher in Hobart.
Table 7: Impact on takeaway food prices
Meal Price in Price in Price in Packaging Price increase % increase
Hobart Kingborough Glenorchy required from plastics in Hobart
ban meal price
Café Sandwich $28.00 $18.50 $20.00 Box, cup, lid $0.08 0.27%
& coffee
Café Sandwich $29.00 $22.00 $22.00 Box, cold $0.19 0.64%
/ Burger cup, cold
& cold lid, straw
drink
Café 4 small $16.00 $16.00 $16.00 4 x cup, 4 $0.07 0.45%
coffees x lid
Café 4 cold $24.00 $24.00 $24.00 4 x cold $0.37 1.53%
drinks cup, 4 x
cold lid, 4 x
straw
Restaurant Curry & $23.83 $21.00 $21.70 Large $0.28 1.18%
Rice takeaway
container,
small
takeaway
container,
fork
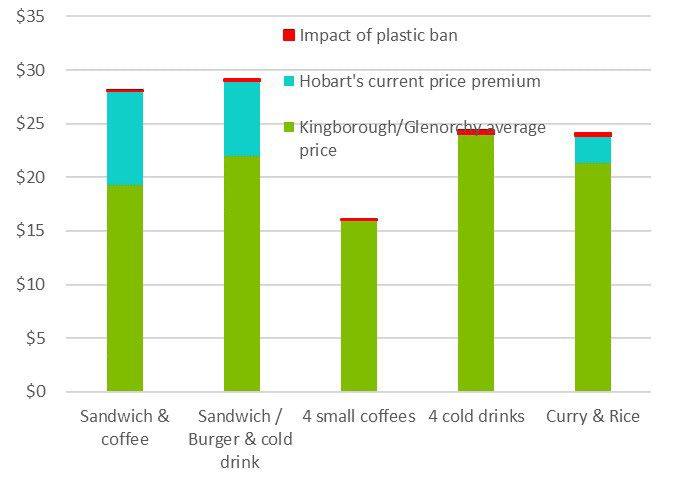
14 Revised Regulatory Impact Statement: Single-use Plastics By-lawFigure 6 shows the current price premium of Hobart meals and drinks compared to average prices
in Glenorchy and Kingborough, and the impact on price of the plastics ban. It shows that the price
premiums that already exist in Hobart takeaway food prices are greater than the potential impacts
of the plastics ban.
Figure 6. Takeaway food prices differences between local government regions
Revised Regulatory Impact Statement: Single-use Plastics By-law 154.3 COMPETITION IMPACTS AND TRAVEL COSTS
Table 8 compares the cost to the consumer per meal of the plastic ban compared to the travel
costs of travelling to neighbouring councils. Travel costs were calculated by multiplying the
Australian Taxation Office’s (ATO) standard cents per kilometre car costs for tax purposes (0.68c/
km) by the distance between a takeaway store close to the City’s border with comparable
takeaways over the border in Kingborough and Glenorchy. Only takeaway stores less than 5km
from the LGA borders were compared.
The full cost comparisons of takeaway food between the LGAs are shown in Appendix I.
Table 8: consumer Costs incurred from plastic ban compared to travel costs
Meal Cost outside of Increase in cost Travel distance Travel cost
Hobart from plastic ban ($) between options (68c/km)
(km)
Kingborough
Sandwich & $20.00 $0.08 2.50 $1.70
coffee
Sandwich & $22.00 $0.19 2.50 $1.70
cold drink
Four small $16.00 $0.07 2.50 $1.70
coffees
Four cold drinks $24.00 $0.37 2.50 $1.70
Glenorchy
Curry and Rice $25.00 $0.18 0.70 $0.48
Burger & chips $24.00 $0.28 0.60 $0.41
Curry & Rice $19.00 $0.18 0.75 $0.51
Burger & chips $15.00 $0.08 1.30 $0.88
Sandwich & $20.00 $0.19 0.75 $0.51
coffee
Sandwich & $22.00 $0.07 0.75 $0.51
cold drink
Four small $16.00 $0.37 0.75 $0.51
coffees
Four cold drinks $24.00 $0.28 0.75 $0.51
Curry & Rice $19.00 $0.18 0.55 $0.37
Burger & chips $24.00 $0.28 0.60 $0.41
Curry & Rice $23.80 $0.08 3.30 $2.24
16 Revised Regulatory Impact Statement: Single-use Plastics By-lawFor every takeaway food option considered, travelling from the City to Glenorchy or Kingborough
to a takeaway that is cheaper due to stocking plastic packaging would not be an economic
decision – the vehicle costs of travelling over the border outweigh the savings from purchasing
takeaway that is packaged in plastic instead of non-plastic packaging (refer to Table 8).
It is possible that a person making a bulk order of takeaway food may save enough from travelling
outside the City for takeaway, but these would only be in very limited circumstances. If a person was:
• Making a large order of a takeaway foods that have a relatively large cost differential between
plastic and compostables.
• Crossing the border to get to an alternative takeaway in Glenorchy or Kingborough would add
less than 1km to the journey.
• Otherwise indifferent to other price and quality factors of the comparable stores.
then they might consider driving from the City to another LGA. For example, based on Table 8
and Figure 7, a person might be prepared to drive around 750 metres outside the LGA to buy two
curries and rice, three burgers and chips or eight cold drinks. This is a very marginal case.
Figure 7. Takeaway meal price Increase incurred from
plastic ban & Travel cost to travel to neighbouring LGAs
Revised Regulatory Impact Statement: Single-use Plastics By-law 17While the plastic by-law will make takeaway food prices marginally more expensive in Hobart than
those in neighbouring LGAs, the cost of travelling even a few hundred metres to a neighbouring LGA
is higher than the cost of compostable packaging. The impacts on inter-LGA competition are expected
to be minimal to none. The costs of takeaway meals in Hobart, Glenorchy and Kingborough already
show price variation much greater than the potential price increase from compostable packaging.
4.4 NATIONAL AND MULTI-NATIONAL CHAINS
VS SMALL BUSINESS
Comments from DPAC on the RIS suggested that larger national and multi-national chains might
find it easier than small firms to either adapt to or avoid the ban on plastics. The comments suggest
two ways in which this could occur:
• National and multi-national chains might find it easier than smaller chains to switch away from
plastic packaging.
• Chains may contract with unrelated entities who supply their foods in single-use plastic; for
example buying pre-packaged plastic wrapped muffins from a separate company for same.
This would fall outside the scope of the ban, but a small store that prepares their own muffins
would not be liable for the ban.
These questions have been discussed qualitatively, with some reference to the quantitative analysis
on from previous sections. It was not possible to obtain information from chains on their costs of
packaging and the costs of switching to alternatives due to commercial factors, although some
stores have provided general information through personal communications.
The City is engaging with large chain takeaway stores to discuss their use of plastic. The stores
spoken to have generally been supportive of the concept and are planning to phase out disposable
plastic in their stores, however, they are unsure if they can meet the City’s proposed timeframe.
In this case, it may be easier for small stores to switch compared to large chains. Small stores
simply need to buy compostable packaging from their current supplier instead of plastic, or find
a new supplier. There may need to be some lead time to allow suppliers to meet demand, but
these products are already available. For example, one multi-national expressed concern that they
wouldn’t be able to access the quantity of product required for their stores in time to meet the by-
law’s proposed dates. This issue will not impact smaller operators.
Large chains who make their own packaging or have it made to their specifications may need to
make arrangements to change their whole manufacturing process, which is likely to take significant
time and resources. Consultation conducted suggests that the cost for individual Hobart retailers will
be around $700 per year, while multinational chains could face cost increases of $20,000 to $30,000
due to needing to make significant changes to their supply chain.
It is possible that larger chains could get around the ban by ordering more pre-packaged takeaway
food, which falls outside the ban. There would be nothing in the by-law stopping large chains from
doing so, or from stopping small chains from doing so. If many takeaway stores did this, then it
would thwart the intention of the ban.
The impact of this is likely to be small to insignificant for the same reasons discussed in Sections 4.2
and 4.3 – the costs of using compostable or biodegradable packaging is minimal compared to the
overall price of the product.
18 Revised Regulatory Impact Statement: Single-use Plastics By-law5. OPTIONS TO ADDRESS THE PROBLEM
Two scenarios have been considered in regard to Single-use plastics. A description of each of
these options is provided in Table 9.
Table 9. Single-use takeaway plastic scenarios
1. • An accreditation system that acknowledges and rewards retailers that adopt
Voluntary non-plastic takeaway packaging.
scheme • Use composting certifications as the benchmark (i.e. AS4736, AS5810, ASTM
D6400, EN13432).
• The City acts as the accreditation body.
• City Officers act as accreditation officers, however any checks would be
requested by the Food Retailer to receive “accreditation”.
• Focusing upon education, incentives and encouragement.
2. • A ban on plastic takeaway packaging from food retailers implemented by the
Mandatory City.
ban • Use composting certifications as the benchmark (i.e. AS4736, AS5810, ASTM
D6400, EN13432).
• City Officers act as compliance officers.
• Combined with education and encouragement.
A Cost Benefit Analysis (CBA) has been undertaken for each of these scenarios and covered in
Section 6.
Compostable products
Revised Regulatory Impact Statement: Single-use Plastics By-law 196. POLICY IMPACT ANALYSIS
To measure the impact of single-use plastic policies, two analyses were completed; a Cost Benefit
Analysis (CBA) and a Benefit Transfer.
6.1 COST BENEFIT ANALYSIS
To assess the economic impact of Single-use Plastics policy, a Cost Benefit Analysis was employed.
Using a timeframe of 2019 to 2025, the two scenarios discussed in Section 5 were modelled. The
scenarios included: a Voluntary Scheme and a Mandatory Single-use Plastics Ban. The 2025 end
date was applied to align with the APCO 2025 goals. Due to the APCO goals, it is assumed that all
Australian food retailers will be using reusable, recyclable or compostable takeaway packaging by 2025.
However, as the City of Hobart is emphasising the removal of all plastic takeaway packaging, a
‘compliant’ food retailer would be prohibited from using recyclable plastic takeaway packaging.
This sets a stricter standard than the APCO targets. It should therefore be clearly stated, that for the
purposes of this Cost Benefit Analysis, a food retailer is only described as fully ‘compliant’, when it
has transitioned to reusable, compostable or non-plastic recyclable takeaway packaging. If a food
retailer has met APCO’s target of using reusable, recyclable or compostable packaging, it will not be
considered fully ‘compliant’ in City of Hobart as they may still be using recyclable plastics.
As both the Voluntary Scheme and the Mandatory Ban focus on removing single-use plastic takeaway
packaging, there is the assumption that all single-use plastic will be removed from takeaway packaging
before 2025, thus resulting in 100% compliant packaging. It is also expected for this packaging
transition to have differing ‘rates of change’. The assumed ‘rates of change’ can be seen in Figure 8.
Proportion of compliant packaging (# of units)
0.9
0.8
0.7
0.6
0.5
0.4
2019 2020 20212 022 2023 2024
Ban Voluntary No action
program
Figure 8. Assumed rate of packaging change for each scenario
20 Revised Regulatory Impact Statement: Single-use Plastics By-lawA summary of the Cost Benefit Analysis results can be seen in Table 12 and 13. It is evident that costs
generally outweigh benefits over all scenarios. A Mandatory Ban on Single-use Plastics resulted in the
greatest NPV deficit, followed by the Voluntary Scheme. When focusing upon the avoidance of Single-
use plastics, again the Mandatory Ban By-law had the greatest impact, with lesser effects seen in the
Voluntary Scheme.
Table 10. CBA results
Option 1: Voluntary program Option 2: By-law
Costs (PV)* $1,645,606 $3,248,568
Benefits (PV)* $266,028 $538,250
NPV* -$1,379,577 -$2,710,318
BCR* 0.162 0.166
Units of LF plastic avoided 81,759,921 148,650,145
Tonnes of LF plastic avoided 334 607
*Discount rate of 7% used, based upon recommendations by DPMC Guidance Note 16
Table 11. Incremental annual costs and benefits over the analysis period (7% discount rate)
Option 1: Voluntary program Option 2: By-law
Costs Benefits Costs Benefits
2019 0 0 $6120 0
2020 $118,076 $16,817 $789,448 $116,487
2021 $199,935 $31,434 $675,629 $104,422
2022 $270,578 $44,065 $562,424 $93,438
2023 $331,123 $54,911 $475,140 $83,444
2024 $390,365 $64,148 $396,871 $74,357
2025 $335,529 $54,653 $342,936 $66,102
Total $1,645,606 $266,028 $3,248,568 $538,250
Additional insights are possible when costs and benefits are disaggregated. For instance, it is apparent
from Table 12 that the greatest cost increases are due to a rise in packaging costs and organic collection
costs, both borne by food retailers. The City is also impacted, due to lower landfill revenue and
increased costs for education, administration and compliance. The Hobart recycling facility may also see
some revenue loss due to decreased quantities of recyclable plastic packaging in use under the by-law.
Revised Regulatory Impact Statement: Single-use Plastics By-law 21Table 12. A summary of costs (7% discount rate)
Description of cost Data source Option 1: Option 2:
Voluntary By-law
program
Education Annual hours for by-law • Estimated annual $29,166 $34,238
costs education of business hours dedicated to
& residents* Waste education
Education Officer hourly
wage
By-law Annual hours for by- • Estimated annual 0 $34,238
compliance law compliance * hours dedicated to
costs Environmental Health by-law compliance
Officer hourly wage
Administration Annual hours for • Estimated annual $47,665 0
costs administration * Council hours dedicated to
officer hourly wage voluntary program
admin
Reduced Tonnage of landfill • Tonnage of landfill $21,564 $59,693
Landfill avoided * gate fee avoided estimated
revenue from food retailer
survey
Takeaway Average weekly change • Change in packaging $1,427,956 $2,840,925
packaging in packaging cost * # of cost sourced from
costs Hobart food retailers*52 food retailer survey.
weeks/annum • # of Hobart food
retailers sourced from
Council data set
Retailer # of food retailers • Estimated number of $119,255 $241,812
organics adopting organics Hobart food retailers
collection collection * pick-up fee adopting organics
collection
• Cost of organics
collection based upon
council FOGO service
Non- # of infringements * fine • Estimated number of 0 $4,673
compliance per infringement infringements
cost
Loss of Recyclables tonnage * • Recyclables tonnage 0 $32,989
recyclables market price sourced from food
retailer survey.
Total $1,645,606 $3,248,568
22 Revised Regulatory Impact Statement: Single-use Plastics By-lawWith regard to benefits, the greatest impact was seen in forms of litter collection; including formal
collections, marina clean ups and shipping de-fouling (Table 13). Significant benefits were also seen
in marine tourism, due to a decrease in plastic marine litter. The impact on marine tourism was based
upon studies showing a relationship between environmental cleanliness and tourism levels. Empirical
evidence was also used to support the claim that decreased levels of plastic litter would benefit fisheries
and aquaculture. Smaller financial benefits were observed for the City landfill and compost facilities.
It was found that landfill operational costs decrease if there are reduced inputs and compost revenues
increase due to increased organic inputs.
Table 13. A summary of benefits (7% discount rate)
Description of benefit Data source Option 1: Option 2:
Voluntary By-law
program
Reduction in Reduction in landfill • The full cost of landfill $5,675 $15,477
landfill GHG tonnage * GHG emission disposal in Australia
emissions costs/tonne report19.
• Tonnage of landfill
avoided estimated
from food retailer
survey
Reduction Reduction in landfill • The full cost of landfill $9,080 $24,763
in landfill tonnage * OPEX/tonne disposal in Australia
operation report.
costs
• Tonnage of landfill
avoided estimated
from food retailer
survey
Compost Increased tonnage of • Increased tonnage $11,350 $30,953
facility compostables * compost of compostables
revenue facility gate fees estimated from food
retailer survey
• Composting fees
19
BDA Group, 2009, The full cost of landfill disposal in Australia. DEWHA.
Revised Regulatory Impact Statement: Single-use Plastics By-law 23Aquaculture % impact of marine • Economic Impacts of $13,115 $25,531
(salmon) plastics on aquaculture Marine Litter report20
revenue * salmon
aquaculture revenue • Australian fisheries
and aquaculture
statistics 2017 -
Production.21
Fisheries % impact of marine • Economic Impacts of $34,399 $66,965
(abalone) plastics on fishery Marine Litter report.
revenue * abalone fishery
revenue • Tasmanian Abalone
Fishery - 2010.22
• Abalone Council
Annual Report
2017/2018.23
Marine % impact of plastic • Guidelines on the $44,386 $86,406
tourism pollution of marine use of market-based
tourism revenue * marine instruments to
tourism revenue address the problem
of marine litter.24
Formal litter Volunteer hours * • Based on CUAD and $70,347 $136,944
collection average Tasmanian City Bushcare figures
hourly wage*Fractional
decrease in litter after
by-law
Marina Clean- Cost of marina litter • Impacts of Marine $46,236 $90,007
up collection Debirs and oil:
Economic and social
costs to coastal
communities.25
Shipping de- Cost of de-fouling • Impacts of Marine $31,440 $61,204
fouling shipping due to plastic Debirs and oil:
pollution Economic and social
costs to coastal
communities.
Total $266,028 $538,250
20
Mouat, J., Lopez Lozano, R. & Bateson, H. 2010. Economic impacts of marine litter. KIMO.
21
ABARES. 2017. Australian fisheries and aquaculture statistics 2017 – Production. Department of Agriculture.
22
Tarbath, D & Gardner, C. 2011. Tasmanian Abalone Fishery – 2010. IMAS.
23
TAC. 2018. Annual report 2017/2018. Tasmanian Abalone council.
24
Ten Brink, P., Lutchman, I., Bassi, S., Speck, S., Sheavly, S., Register, K. & Woolaway, C. 2009. Guidelines on the use of market-based
instruments to address the problem of marine litter. IEEP.
25
Hall, K. 2000. Impacts of marine debris and oil: economic and social costs to coastal communities. KIMO.
24 Revised Regulatory Impact Statement: Single-use Plastics By-lawIt should be emphasised that the benefit region. It is possible that land-based tourism or
pricing was carried out conservatively, with a more diverse range of marine tourism could
some benefits potentially under-priced and be effected by reduced plastic litter in land and
other possible benefits being given a zero marine environments.
value (Appendix G). For example, a price was
Furthermore, while potential savings were
assigned to the economic benefit of reduced
assigned to formal litter collections, such as
plastic marine litter on Hobart’s commercial
Clean Up Australia Day (CUAD) or Hobart
fisheries and marine tourism. However, only
Bush Care, it was not possible to estimate the
Salmon aquaculture and Abalone fisheries
savings from reduced informal litter collection.
were considered, due to their close proximity
It is expected that if informal litter collection
to the Derwent Estuary system. Nevertheless,
was also tallied, significantly higher savings
it is highly likely that other fisheries would be
would be seen.
impacted by a reduction in plastic marine litter.
As a final point, the impact of reduced plastic
It should also be noted that only three marine-
litter on marine biodiversity went completely
focused tourist companies were considered
unpriced. An attempt to estimate some of this
when pricing the impact of marine plastics on
value will be carried out in the next section
tourism. Again, these were companies that
using a Benefit Transfer.
operated in or around to the Derwent Estuary
Photo: Alastair Bett, Hobart waterfront
26
M. Barbera, 2010, Benefit Transfer Approaches
27
ibid
28
Ressurreicao, A. 2011, Economic valuation of species loss in the open sea
29
IMAS, 2018, Economic and social assessment of Tasmanian fisheries 2017/18
Revised Regulatory Impact Statement: Single-use Plastics By-law 256.2 BENEFIT TRANSFER - TO ASSESS VALUE OF
HOBART’S MARINE DIVERSITY
A Benefit Transfer is a commonly used the service being valued and the quality of
technique to assess the value of intangible (or the study. The assessment can be found in
difficult to measure) variables using results from Appendix H.
existing research, when significant research
To determine the value of Hobart marine
resources are not available. A Benefit Transfer
biodiversity, the Willingness to Pay to conserve
has been used in this RIS to estimate the value
10% of marine biodiversity was taken from
of Hobart’s marine biodiversity or natural capital.
the chosen study. In addition, an estimate
Four steps were followed to complete the was made of the proportion of Hobart’s adult
Benefit Transfer; (a) a study was identified for population engaged with marine biodiversity.
the transfer, (b) a decision was made regarding The proportion of the population participating
whether the values were transferable, (c) the in fishing sports was used as a surrogate for
quality of study was evaluated, and (d) values engagement with marine biodiversity. These
were adjusted to better reflect the values for figures were multiplied to estimate the total
the site under consideration. The chosen amount that would make a one-off payment by
study measured the economic value of marine City of Hobart population to conserve 10% of
biodiversity in a Portuguese autonomous marine biodiversity in this region (Equation 3).
region. An assessment was made about The result of this calculation was $4,522,250,
the comparability of locations, similarity of and can be seen in Table 12.
Value of Hobart marine biodiversity=WTP×engaged population
Table 14. Benefit Transfer summary table
Benefit Transfer metrics
Willingness to pay (WTP) (per person) $65430
Engaged population (City of Hobart) 726031 32
Value of Hobart marine biodiversity $4,522,250
It was assumed that a 4% reduction in marine litter would preserve 10% of marine biodiversity in this
region. The 10% figure was taken from the Benefit Transfer study.
30
Ressurreicao, A. 2011
31
IMAS, 2018
32
ABS, http://quickstats.censusdata.abs.gov.au/census_services/getproduct/census/2016/quickstat/LGA62810
26 Revised Regulatory Impact Statement: Single-use Plastics By-law7. PROPOSED PUBLIC CONSULTATION PROCESS
The City of Hobart has resolved to make Over half of the City’s approximately 1000
the proposed by-law, and this revised RIS food and beverage businesses already supply
completes the further information required some form of compostable packaging,
to be submitted to the Director of Local demonstrating there is minimal competitive
Government. If satisfied the RIS meets the disadvantage to retailers supplying this type of
statutory requirements, a public consultation packaging. In surveys to date, businesses have
process will be undertaken. indicated a favourable response to banning
single-use plastic packaging, with a strong
The City of Hobart’s research and consultation
understanding of the reasons behind it.
with businesses and the community to date
shows a favourable response to banning Copies of the proposed by-law and RIS will be
single-use plastic packaging in takeaway made available to the public, and feedback
food businesses. invited from businesses and the community via
the City’s facebook page, website and on-line
A community survey conducted from February
forum at yoursay.hobartcity.com.au.
to March 2018 returned a significant response
strongly in favour of reducing the use of Targeted consultation will also be held with
single-use plastic. Of the 2,962 responses, business groups. Where appropriate, focus
96% disagreed wen asked “do you think it groups will be established in order to test out
is appropriate to use single-use plastics?” certain packaging requirements and share
An overwhelming 90% said they were willing solutions with others.
to pay more for food and drinks if it meant
Affected businesses will receive an information
that sustainable packaging was used. Survey
pack or ‘toolkit’ explaining how to achieve
responses indicated a sensitivity to how much
compliance. The kit will include a list of
more consumers would be willing to pay, with
replacement products and suppliers.
around two-thirds willing to pay up to 5% extra.
Businesses will be offered support during the
While a state government ban was perceived transition to compliance, including one-on-one
more favourably, 75% of surveyed participants education with business owners.
felt that a local government ban would be
The City will continue to consult with all
an effective or highly effective way of getting
stakeholders to clarify the scope of the by-law
more takeaway food businesses to use less
and minimise any disadvantage that arises
single-use packaging. A ban was perceived to
due to new single-use plastics policy (e.g.
be significantly more effective than the use of
disability access).
support and education.
In a separate poll, 96% of the 638 survey
responses supported a ban on single-use
plastic takeaway items.
Revised Regulatory Impact Statement: Single-use Plastics By-law 27REFERENCES
NEPC, “Packaging impacts Decision Regulation Impact Statement,” National Environment
Protection Council, Canberra, 2014.
UNEP, “Valuing Plastic: The Business Case for Measuring, Managing and Disclosing Plastic Use in
the Consumer Goods Industry,” United Nations Environment Programme, Nairobi, 2014.
W. T. H. &. F. L. Li, “Plastic waste in the marine environment: A review of sources, occurence and
effects,” Science of the Total Environment, 2016.
5 Gyres, “Better Alternatives Now: Ban List 2.0,” 2017.
DPIPWE, “Draft Waste Action Plan,” Department of Primary Industries, Parks, Water and
Environment, Hobart, 2019.
COH, “Waste Management Strategy 2015-2030,” City of Hobart, Hobart, 2016.
APCO, “Australian Packaging Covenant Strategic Plan 2017-2022,” Australian Packaging
Covenant Organisation, Sydney, 2019.
GI, “Turning the tide on single-use plastic products: Approach and next steps,” Green Industries
SA, Adelaide, 2019.
EP, “Reduction of the impact of certain plastic products on the environment,” European
Parliament, Strasbourg, 2019.
UNEP, “Proposals to amend annexes II, VIII and IX of the Basel Convention on the Control of
Transboundary Movements of Hazardous Wastes and their Disposal,” United Nations Environment
Programme, Geneva, 2018.
A. G. J. D. T. K. M. S. R. &. E.-J. G. Ressurreicao, “Economic valuation of species loss in the open
sea,” Ecological Economics, pp. 729-739, 2011.
ABS, “2016 Census QuickStats,” 2 July 2019. [Online]. Available: http://quickstats.censusdata.abs.
gov.au/census_services/getproduct/census/2016/quickstat/LGA62810.
EP, “Research for REGI Committee: The economic, social and territorial situation of the Azores,”
European Parliament, 2017.
IMAS, “Economic and social assessment of Tasmanian fisheries 2017/18,” Institute for Marine and
Antarctic Studies, Hobart, 2018.
J. &. B. A. Lavers, “Exceptional and rapid accumulation of anthropogenic debris on one of the
world’s most remote and pristine islands,” PNAS, pp. 6052-6055, 2017.
M. Barbera, “Benefit Transfer Approaches,” Auckland Council, Auckland, 2010.
28 Revised Regulatory Impact Statement: Single-use Plastics By-lawYou can also read