Global Famine after Nuclear War - Research Square
←
→
Page content transcription
If your browser does not render page correctly, please read the page content below
Global Famine after Nuclear War Lili Xia ( lilixia@envsci.rutgers.edu ) Rutgers University Alan Robock Rutgers University https://orcid.org/0000-0002-6319-5656 Kim Scherrer Universitat Autònoma de Barcelona Cheryl Harrison The University of Texas Rio Grande Valley Jonas Jaegermeyr Columbia University https://orcid.org/0000-0002-8368-0018 Charles Bardeen National Center for Atmospheric Research Owen Toon University of Colorado Ryan Heneghan Queensland University of Technology Article Keywords: global famine, nuclear war, climate impact Posted Date: September 8th, 2021 DOI: https://doi.org/10.21203/rs.3.rs-830419/v1 License: This work is licensed under a Creative Commons Attribution 4.0 International License. Read Full License
1 Global Famine after Nuclear War
 2
 3 Lili Xia1,✉, Alan Robock1, Kim Scherrer2, Cheryl S. Harrison3,4, Jonas Jägermeyr5,6,7, Charles G.
 4 Bardeen8, Owen B. Toon9, and Ryan Heneghan10
 5
 1
 6 Department of Environmental Sciences, Rutgers University, New Brunswick, NJ, USA
 2
 7 Institut de Ciència i Tecnologia Ambientals (ICTA), Universitat Autònoma de Barcelona,
 8 Cerdanyola del Vallès, Spain
 3
 9 School of Earth Environmental and Marine Science, University of Texas Rio Grande Valley,
10 Port Isabel, TX, USA
 4
11 Now at: College of the Coast and Environment, Center for Computation and Technology,
12 Louisiana State University, Baton Rouge, Louisiana, USA
 5
13 NASA Goddard Institute for Space Studies, New York, NY, USA
 6
14 Center for Climate Systems Research, Columbia University, New York, NY, USA
 7
15 Potsdam Institute for Climate Impact Research (PIK), Potsdam, Germany
 8
16 National Center for Atmospheric Research, Boulder, CO, 5 USA
 9
17 Laboratory for Atmospheric and Space Physics, Department of Atmospheric and Ocean
18 Sciences, University of Colorado, Boulder, CO, USA
 10
19 School of Mathematical Sciences, Queensland University of Technology, Brisbane, QLD,
20 Australia
 ✉
21 email: lilixia@envsci.rutgers.edu
22
23 Corresponding Author: Lili Xia, lilixia@envsci.rutgers.edu
24
25
26
27 Submitted as an Article to Nature Food
28
29 August, 2021
30
31
2

32 In a nuclear war, bombs targeted on cities and industrial areas would start firestorms,

33 injecting large amounts of soot into the upper atmosphere, which would spread globally and

34 rapidly cool the planet 1 , 2 , 3 . The soot loadings would cause decadal disruptions in Earth’s

35 climate4,5,6, which would impact food production systems on land and in the oceans. In 1980s,

36 investigations of nuclear winter impacts on global agricultural production7 and food availability8

37 for 15 nations, but new information now allows us to update those estimates. Recently, several

38 studies analyzed changes of major grain crops9,10,11 and marine wild-catch fisheries12 for different

39 scenarios of regional nuclear war using sophisticated models. However, the impact on the total

40 food supply available to humans is more complex. Here we show that considering all food sources

41 and potential adaptation measures, such as using animal feed directly for humans, famine would

42 result for most of Earth even from a war between India and Pakistan using less than 3% of the

43 global nuclear arsenal. We look at the climate impacts from a range of scales from regional to

44 global nuclear war, and estimate the total amount of food calories available in each nation,

45 including crops, livestock, and fisheries, for each year following a nuclear holocaust. Our findings

46 quantify the global indirect impacts of nuclear war away from target areas, and demonstrate the

47 need to prevent any scale of nuclear war.

48

49 Extraordinary events such as large volcanic eruptions or nuclear war could cause sudden

50 global climate disruptions. Global volcanic cooling from sulfates has resulted in severe famines

51 and political instability, for example after the 1783 Laki eruption in Iceland13 or the 1815 Tambora

52 eruption in Indonesia14,15. For a nuclear war, the global cooling would depend on the yields of the

53 weapons, the number of weapons, and the targets, among other atmospheric and geographic

54 factors. A war between India and Pakistan could produce a stratospheric loading of 5-47 Tg of
3

55 soot16,17 and a war between the United States, its allies, and Russia, who possess more than 90%

56 of the global nuclear arsenal, could produce more than 150 Tg of soot and a nuclear winter1-6.

57 Recent catastrophic forest fires in Canada in 201718 and Australia in 2019 and 202019,20 produced

58 0.3-1 Tg of smoke (0.006-0.02 Tg soot), which was subsequently heated by sunlight and lofted

59 high in the stratosphere, adding confidence to nuclear war simulations that predict the same process

60 will occur after nuclear war.

61 Climate disruption from nuclear war would impact food production systems on land and in

62 the oceans, but so far an integrated estimate of the impacts of the entire range of war scenarios on

63 both land- and ocean-based food production is missing. Here, we examine the impacts of six war

64 scenarios, generating 5 to 150 Tg of soot, on the food supply. We use model simulations of major

65 crops and wild-caught marine fish together with estimated changes in other food and livestock

66 productivity to assess the impacts on global calorie supply.

67 Because soot disperses globally once it reaches the upper atmosphere, our results apply

68 regardless of the warring nations. There are many war scenarios that could result in similar

69 amounts of smoke and thus similar climate shocks, including wars involving the other nuclear-

70 armed nations (China, France, the UK, North Korea, and Israel).

71 Impacts on crops, and fish catch productivity

72 Using climate, crop, and fishery models (Methods), we calculate the supply of food, in

73 terms of daily energy per person, for each year after a range of six different stratospheric soot

74 injections. The climatic impacts would last for about a decade, but peak in the first few years

75 (Figure 1).

76 Global averaged calories from the crops we simulated decreased 7% in years 1-5 after the

77 conflict even under the smallest, 5 Tg soot scenario (Figure 2a; comparable to previous multi-

4

 78 model results11, Figure S1) and up to 50% under the 47 Tg scenario. In the 150 Tg soot case,

 79 global average calories from crops would decrease by around 90% 3-4 years after the nuclear

 80 conflict. The changes would induce a catastrophic disruption of global food markets, as even a

 81 7% global yield decline would exceed the largest anomaly ever recorded since the beginning of

 82 the FAO observational records in 196111.

 83 Fish are another important food resource, especially in terms of protein supply. Nuclear

 84 war would reduce the wild fish catch12, but the reduction would be less than for land agriculture

 85 (Figure 2b), since reduction in oceanic net primary productivity – the base of the marine food-

 86 web– is moderate (from 3% in 5 Tg to 37% in 150 Tg), and temperature changes are less

 87 pronounced (Figure 1). Terrestrial agricultural production dominates the total calorie change of

 88 crops and fisheries combined (Figure 2c), since global crop production is 24 times that of wild

 89 fisheries and staple crops contain around five times more calories than fish per unit mass21,22. In

 90 total, marine wild capture contributes 0.5% of total calories, but 3.5% of global average protein

 91 supply (Figures 3 and S2).

 92 Calorie reduction from agriculture and marine fisheries shows regional differences (Figure

 93 S3), with the strongest percentage reductions over high latitudes in the Northern Hemisphere.

 94 Cooling from nuclear conflicts causes temperature limitations for crops, leading to delayed

 95 physiological maturity and additional cold stress11. Even for the India-Pakistan case, many regions

 96 become unsuitable for agriculture for multiple years. For example, in the 27 Tg case, mid- to high-

 97 latitudes of the Northern Hemisphere show crop reductions > 50%, along with fish catch reductions

 98 of 20-30%. The nuclear-armed nations in mid- to high-latitude regions (China, Russia, United

 99 States, France, North Korea, and United Kingdom) show calorie reduction from 30% to 86%, and

100 in lower latitudes (India, Pakistan and Israel) the reduction is less than 10% (Tables S1 and S2).
5

101 We underline that impacts in warring nations are likely to be dominated by local problems, like

102 infrastructure destruction and radioactive contamination, so the results here apply only to indirect

103 effects from soot injection in remote locations.

104 Impacts on total human calorie intake

105 To estimate the effect on the total food energy available for human consumption, we

106 consider diet composition, energy content of different food types, crop usage, and changes in foods

107 that we did not directly model (Methods). In 2013, the Food and Agriculture Organization21,22

108 reported that 51% of global calorie intake was from cereal, 31% from vegetables, fruit, roots,

109 tubers, and nuts, and 18% from meat and related products, of which fish contributed 7%, with

110 marine wild catch contributing 3% (Figure 3a). The crops and fish we simulated provide almost

111 half of these calories and 40% of the protein. Further, only portions of the simulated foods are

112 consumed by humans. Many crops (e.g., maize and soybean) are used mainly for livestock feed

113 and biofuel (Figure 3c).

114 In addition, the total number of calories available as food is highly dependent on human

115 reactions to nuclear conflicts. We assume that international trade in food is suspended as food

116 exporting nations halt exports in response to declining food production (Methods). Furthermore,

117 we considered two societal responses, Livestock and No Livestock, two contrasting extreme

118 scenarios (see Table S3), in between which the complex societal reactions would be likely to fall.

119 For the Livestock response scenario, representing a minimal adaptation to the climate-driven

120 reduction in food supply, people continue to maintain livestock and fish as normal. Calories from

121 all cereals, vegetables, fruit and nuts are reduced by the average reduction in our four simulated

122 crops, and caloric changes from marine wild-caught fish are calculated with business-as-usual

123 fishing behavior. Grass leaf carbon (Figure 2d) is used to estimate pasture change, and simulated
6

124 crop production change is used to estimate animal feed from grains. Average animal feed has ratio

125 of 46% grass to 54% crops23. The No Livestock response represents a scenario where livestock

126 (including dairy and eggs) and aquaculture production are not maintained after the first year, and

127 the national fractions of crop production previously used as feed are now available to feed humans.

128 In addition, fishing pressure intensifies through a five-fold increase in fish price12. Similar

129 responses took place in New England in the “Year Without a Summer” after the 1815 Tambora

130 volcanic eruption. Even though the temperature changes were smaller than modeled in any of the

131 nuclear war scenarios here, crop failures forced farmers to sell their livestock because they could

132 not feed them15 and previously unpalatable fish were added to their diet14,15,24. Since all livestock

133 feed from crops is not easily adaptable for human consumption, we test a full range (0%-100%) of

134 the fraction of animal feed that could be used by humans, and use 50% as an example in some

135 plots and tables. In all responses, we do not consider reduced human populations due to direct or

136 indirect mortality or farmer adaptations such as changes in planting dates, cultivar selection, or

137 switching to more cold-tolerating crops.

138 National consequences of calorie loss depend on fallow cropland, regional climate impacts,

139 population levels, and assuming a complete halt of international food trade (Methods; Figure 4).

140 Here, we focus on two calorie intake levels: 2200 kcal/capita/day and 1600 kcal/capita/day. Food

141 consumption of less than 2200 kcal/capita/day would not allow a person to maintain their weight,

142 and less than 1600 kcal/capita/day would be less than needed to maintain a basal metabolic rate

143 (also known as the resting energy expenditure), and thus would quickly lead to death24. With a 5

144 Tg injection, most nations show decreasing calorie intake relative to the 2013 level (Table S4), but

145 still sufficient to maintain weight (Figure 4). With larger soot injection cases, severe starvation

146 occurs in most of the mid-high latitude nations under the Livestock Case. When 50% of livestock
7

147 feed is converted for human consumption in each nation, some nations (such as U.S.) would

148 maintain sufficient calorie intake under scenarios with smaller soot injections, but weight loss or

149 even severe starvation would occur under larger soot injection cases (Figure 4, Table S5). Under

150 the 150 Tg scenario, most nations would have calorie intake lower than resting energy

151 expenditure24 except for Australia (see Figure 4 caption). However, this analysis is limited by the

152 Food and Agriculture Organization data, which are collected at national levels. Within each

153 nation, particularly large ones, there may be large regional inequities driven by infrastructure

154 limitations, economic structures, and government policies.

155 The global average caloric supply post-war (Figure 5a) implies that extreme regional

156 reductions (Figure 4) could be overcome to some extent through trade, but equal distribution of

157 food is likely to be a major challenge. One could make the assumption of optimal food distribution

158 within each country8, in which the maximum number of people are given the 2200 kcal/capita/day

159 needed to maintain their weight and level of activity and calculate the percentage of population

160 that could be supported this way (Figure 5b). Under the 150 Tg case, most countries will have less

161 than 25% of the population survive by the end of Year 2 (Figure S4). However, people and

162 surviving governments would react in more complex ways, and that is a subject for future research.

163 For example, if some favored people get more than the minimum, then more people would die.

164 Discussion and conclusions

165 Using state-of-the-art climate, crop, and fishery models, we calculate how the availability

166 of food would change in the world under various nuclear war scenarios. We combined crops and

167 marine fish, and also consider whether livestock, including dairy and eggs, continues to be an

168 important food source.
8

169 Even for a regional nuclear war, large parts of the world would have famine. Using

170 livestock feed as human food could offset food losses locally, but does not make much difference

171 in the total amount of food available globally, especially at large soot injections when the growth

172 of feed crops and pastures is severely impaired by the climate perturbation. We find particularly

173 severe crop declines in major exporting countries like Russia, U.S., and China, which could easily

174 trigger export restrictions and then cause severe disruptions in import dependent countries25. Our

175 no-trade response illustrates this risk, and shows that African and Middle Eastern countries would

176 be severely affected.

177 Our analysis of the potential impacts of nuclear war on the food system does not address

178 some aspects of the problem leaving them for future research. These include reduced availability

179 of fuel and infrastructure for food production after a war, the effect of elevated UV on food

180 production, and radioactive contamination26. We also underline that while this analysis focuses

181 on calories, humans would also need proteins and micronutrients to survive the ensuing years of

182 food deficiency, and we estimate the impact on protein supply in Figure S2. Large-scale use of

183 alternative foods requiring little-to-no light to grow in a cold environment27, if possible, has not

184 been considered.

185 In conclusion, the reduced light, global cooling and likely trade restrictions after nuclear

186 wars would be a global catastrophe for food security. The negative impact of climate perturbations

187 on the total crop production can generally not be offset by livestock and aquatic food (Figure 5a).

188 The results here provide further support to the 1985 statement by U.S. President Ronald Reagan

189 and Soviet General Secretary Mikhail Gorbachev, and restated by Presidents Biden and Putin in

190 2021, that “a nuclear war cannot be won and must never be fought.”

191
9

192 Methods

193 We use a state-of-the-art global climate model to calculate the climatic and biogeochemical

194 changes caused by a range of stratospheric soot injections, each associated with a nuclear war

195 scenario (Table 1, ref. 17). Simulated changes in surface air temperature, precipitation, and

196 downward direct and diffuse solar radiation, are used to force a state-of-the-art crop model to

197 estimate how the productivity of the major cereal crops (maize, rice, spring wheat, and soybean)

198 would be affected globally, and changes in oceanic net primary production and sea surface

199 temperature are used to force a global marine fisheries model. We combine these results with

200 assumptions about how other crop production, livestock production, fish production and food trade

201 could change and calculate the amount of food that would be available for each country in the

202 world after a nuclear war.

203 The simulated surface climate disruptions due to the nuclear war scenarios are summarized

204 in Figure 1. Averaged over the current crop regions, surface downwelling solar radiation reduces

205 by 10 W/m2 (5 Tg soot injection) to 130 W/m2 (150 Tg soot injection). With less energy received,

206 the maximum average 2 m air temperature reductions range from 1.5°C (5 Tg soot injection) to

207 14.8°C (150 Tg soot injection) peaking within 1-2 years after the war with temperature reduction

208 lasting for more than 10 years. The cooling also reduces precipitation over summer monsoon

209 regions. Similar but smaller reductions of solar radiation and temperature are projected in marine

210 regions (Figures 1b and 1d), with resulting changes in lower trophic level marine primary

211 productivity. We applied local changes at every grid cell to the crop and fish models.

212 Climate model

213 All nuclear war scenarios6,17 are simulated using the Community Earth System Model

214 (CESM)28. This model includes interactive atmosphere, land, ocean, and sea ice. Both atmosphere
10

215 and land have a horizontal resolution of 1.9°x2.5°, and the ocean has a horizontal resolution of 1°.

216 The atmospheric model is the Whole Atmosphere Community Climate Model version 429. The

217 land model is the Community Land Model version 4 with the carbon-nitrogen cycle. CESM output

218 at 1- and 3-hourly resolution, including 2 m air temperature, precipitation, humidity, and

219 downward longwave radiation and solar radiation (direct and diffuse radiation) are used to drive

220 the offline crop model simulations. There are three ensemble members of the control simulation,

221 which repeats the climate forcing of 2000 for 15 years, three ensemble members of the 5 Tg case,

222 and one simulation for each other nuclear war scenario.

223 Direct climate model output use

224 Because climate models have biases, it is typical to bias-correct model output before using

225 it as input for crop models. There are various techniques that attempt to use past observational

226 data to address changes in the mean as well as variance, but none are perfect and all are limited by

227 assumptions that future relations between model output and crop model input can be based on the

228 recent past. A common method11 is the delta-method, in which an observational reanalysis weather

229 dataset is used and monthly means of temperature, precipitation, and insolation are modified

230 according to the climate model simulations. This comes with the advantage of realistic internal

231 variability important for crop modeling9-11, but does not adjust changes in variance, which might

232 be an unrealistic assumption under higher emission scenarios, such as the 150 Tg case. Here,

233 because we are using a crop model that has already been calibrated with the same climate model

234 that we are using, we use raw climate model output (1.9°x2.5°) to force the crop model, and this

235 allows variance to change, too.
11

236 Crop model

237 Crop simulation is conducted by the Community Land Model version 5 crop

238 (CLM5crop)30,31 in the Community Earth System Model version 2 (CESM2). Dynamic vegetation

239 is not turned on. CLM5crop has six active crops: maize, rice, soybeans, spring wheat, sugar cane,

240 and cotton, and also simulates natural vegetation, such as grasses. In this study, we used the output

241 of the cereals, maize, rice, soybeans, and spring wheat, and of grasses. Although CLM5crop does

242 not simulate winter wheat, we assume winter wheat production is changed by the same amount as

243 spring wheat, which has been found in other studies11, however this may underestimate the winter

244 wheat response, because winter wheat would experience colder temperatures during its growing

245 period that would be more likely to cross critical thresholds11. Surface ozone and downward

246 ultraviolet radiation would also be impacted by nuclear war 32 , but CLM5crop is not able to

247 consider those impacts, which might exacerbate the losses. In addition, the crop model does not

248 consider the availability of pollinators, killing frost, and alternative seeds. The model simulates

249 rainfed crops and irrigated crops separately, and all results presented here refer to the total

250 production of rainfed and irrigated crops. Irrigated crops are simulated under the assumption that

251 fresh water availability is not limiting. Irrigation water is from the nearby runoff or the ocean33.

252 Although evaporation is reduced with cooling, it is possible that our result may underestimate the

253 negative impact from precipitation reduction, especially for the large injection cases.

254 CLM5crop is spun up for 1060 years by repeating the last 10 years of the CESM control to

255 reach the equilibrium of four soil carbon pools. The crop simulations are at the same resolution

256 as CESM simulations (1.9°x2.5°). The crop planting date is determined by growing degree days,

257 and the location of cropland is fixed for all crops.
12

258 Fishery model

259 Fish and fisheries responses are simulated with the BiOeconomic mArine Trophic Size-

260 spectrum (BOATS) model12,34,35. BOATS was used to calculate the size-structured biomass of

261 commercially targeted fish based on gridded (1° horizontal resolution) inputs of sea surface

262 temperature and oceanic net primary production from CESM. The model also interactively

263 simulated fishing effort and fish catch through a bioeconomic component that depends on fish

264 price, cost of fishing, catchability and fisheries regulation34,36. Details are found in ref. 12 and

265 references therein.

266 Combining crop and marine fish data

267 Table S1 shows the total calorie reductions for each of the nine nuclear states from just the

268 simulated crops and marine fish. Data for all the countries in the world can be found in Table S2.

269 To calculate nation-level calories available from simulated crops and fish, we weight the

270 production by the caloric content of each type of food. We use data from the Food and Agricultural

271 Organization21,22. Nation-level calorie reduction (%) from total production of maize, rice,

272 soybean, wheat and marine fish is thus calculated as:

273 = ∑5 (1)
 =1

274 = ∑5 =1 (2)

275 Where index i is maize, rice, soybean, wheat, or marine fish wild catch, wiy is the caloric weight

276 of each commodity per country each year, Pi is the national production of item i in FAO- Food

277 Balance Sheet (FBS)21,22, ci is calories per 100 g dry mass for each item21, Riy is national production

278 reduction (%) of each item in year y after the nuclear conflicts, and Ry is nation-averaged calorie

279 reduction (%) of the five items in year y after the nuclear conflicts.
13

280 Effects on other food types

281 Other cereal, vegetables, fruit, roots, tubers and nuts. National averaged calorie reduction

282 (%) of the four simulated crops is applied to the total calories of other cereals, vegetables, fruit,

283 roots, tubers and nuts in 2013 to estimate simulated nuclear war impacts on this category.

284 Livestock and aquaculture. We assume these two types of food share a similar response

285 to simulated nuclear war as they involve feeding animals in a relatively controlled environment.

286 For livestock we assume that 46% are fed by pasture, and 54% are fed by crops and processed

287 products23. Livestock production is linearly correlated with the feed. Annual leaf carbon of grass

288 (both C3 and C4) is used to estimate pasture changes, and reduction of the four simulated crops is

289 used for crop feed changes. For aquaculture, the feed is only from crops and processed products,

290 and the production is also linearly correlated with the amount of feed they receive. Direct climate

291 change impacts on livestock and fish are not considered.

292 Inland fish capture is not considered in this study. Since inland fish only contributes to 7%

293 of total fish production37, adding inland fishery will not significantly change the main conclusions

294 of this study.

295 International trade

296 All food commodity trade calculations are based on the 2013 Food and Agriculture

297 Organization (FAO) data Commodity Balance Sheet (FAO-CBS) and FAO-FBS21,22. This data

298 set also provides the production and consumption of each food type and non-food type for each

299 country, as well as the imports and exports, and thus allows the calculation on a national basis of

300 diet consumption and food usage.

301 Domestic availability of a food commodity in each country comes from domestic

302 production and reserves, reduced by exports and increased by imports. We calculate no
14

303 international trade by applying the ratio of domestic production (element code 5511 in FAO-FBS),

304 and domestic supply (element code 5301 in FAO-FBS) to each food category, and the food

305 production in different usages:

306

307 − = × (3)

308 − = × (4)

309

310 where Cfood is national level calorie supply from different food types in FAO-FBS, Cfood-notrade is

311 national level calorie supply from different food types in FAO-FBS with the assumption of no

312 international trade, Pdp is national level domestic production for each type of food in FAO-FBS,

313 and Pds is national level domestic supply for each type of food in FAO-FBS. Domestic supply is

314 the available food on the market, including domestic production, export, import and changes in

315 stocks and Pusage is the national level food usage. Food usage includes food, feed, seed, losses,

316 processing, residuals, tourist consumption and other use (non-food). For a detailed description,

317 see Definitions and Standards in FAO-NFB. Pusage-notrade is the national level food usage with the

318 assumption of no international trade.

319 Food usage of maize, soybean, rice and wheat is calculated from FAO-CBS. In FAO-CBS,

320 maize products are maize and by-product maize germ oil, soybean products are soybean, and by-

321 products soybean oil and soybean cake, rice products are rice and by-product rice bran oil, and

322 wheat product is wheat. Products for food purposes is the sum of food supply in each category,

323 and also the processing product minus the total by-products (the difference includes processing for

324 the purpose of alcohol or sugar).
15

325 Caloric requirements

326 The population percentage supported by available calories calculated for the Livestock and

327 No Livestock responses indicate the macro-level consequences for food security (Figure 4). The

328 current average human caloric intake is 2844 kcal/capita/day (Figure 3). Caloric requirements

329 vary significantly with age, gender, size, climate, level of activity, and underlying medical

330 conditions. The consumption of less than 2200 kcal/capita/day would not allow an average person

331 to maintain their weight24. 1600 kcal/day is the resting energy expenditure for an average person

332 and a sustained diet less than that would be life threatening in someone who did not have

333 substantial stores of body fat24. We assume 2200 kcal/capita/day is needed to support life and

334 regular labor activity, which means that in Year 2 after the six nuclear scenarios, there are billions

335 of people threatened by food insufficiency (Figure 4).

336 Uncertainties

337 This work was done with one Earth system model, with only one ensemble member for all

338 the cases with soot injections > 5 Tg, only one crop model, and only one fishery model. For the 5

339 Tg case and the control, there are three ensemble members, but only the ensemble averages are

340 used. The three ensemble members for the 5 Tg case are very similar (Figure S5), so climate

341 variability for the larger forcings would be much smaller than the signal.

342 CESM is a state-of-the-art climate model, and its simulations of the impacts of nuclear war

343 have been almost identical to simulations with other models for the 5 Tg38,39 and 150 Tg6 cases.

344 However, further developments in climate models, such as including organic carbon in fire

345 emissions, and better simulating aerosol growth and interactions with the surrounding

346 environment, may improve climate prediction after a nuclear war.
16

347 CLM5crop and BOATS are also state-of-the-art models, but future simulations with

348 different models would certainly be useful. CLM5crop compares well with other crop models in

349 response to nuclear war forcing11 (Figure S1). If anything, CLM5crop underestimates the crop

350 response to nuclear war (Figures 2, S1). Because most crop models were developed for the current

351 or warmer climates, further research is needed to understand how crops react to a suddenly cold

352 environment. Our study is the first step to reveal national food security after nuclear conflicts, but

353 crops may not respond uniformly the same forcing in each nation, given different farming

354 practices. In addition, multi-model assessment will be essential to fully investigate this problem,

355 and crop model developments are important to understand impacts from surface ozone, UV and

356 freshwater availability.

357 Some assumptions in this study could be examined in future work. For example, to turn

358 off international trade, the ratio of local production to domestic supply is applied on a national

359 level. Also, to calculate national calorie intake after nuclear wars, we assume that food is evenly

360 distributed in each country. Economic models will be necessary to further understand the

361 contributions of trade and local food distribution systems to human calorie intake after nuclear

362 conflicts.

363 This study uses calorie intake from FAO data, and food loss and waste are not considered,

364 which account for around 1/3 of the world’s food. If human behavior and the food industry would

365 change substantially, this would affect our conclusions.

366

367 Data Availability

368 The source code for the CESM(WACCM) model used in this study is freely available at

369 https://www.cesm.ucar.edu/working_groups/Whole-Atmosphere/code-release.html, and the code
17

370 for CLM5 is available at https://www.cesm.ucar.edu/models/cesm2/land/. The crop yield and

371 grass production data are available at https://osf.io/YRBSE/. Additional data that support the

372 findings of this study are available from the corresponding author upon reasonable request.

373

374 Acknowledgments

375 This study was supported by the Open Philanthropy Project, with partial support from the

376 European Research Council under the European Union’s Horizon 2020 Research and Innovation

377 Programme under Grant Agreement 682602. Alan Robock and Lili Xia were supported by

378 National Science Foundation grants AGS-2017113 and ENG-2028541. We thank Ira Helfand and

379 Benjamin Bodirsky for valuable suggestions on the work.

380

381 Author Contributions

382 L.X., A.R., K.S., and C.H. designed the study. C.G.B. conducted the climate model simulations,

383 L.X. conducted the crop simulations, and K.S. and R.H. conducted the fishery simulations. L.X.

384 analyzed the data with contributions from all the authors. A.R. and L.X. wrote the first draft and

385 all authors contributed to editing and revising the manuscript.

386

387 Competing interests

388 The authors declare no competing interests.

389
18

390 Table 1. Computed calorie changes (%) in Year 2 after a nuclear conflict for the nations with
391 nuclear weapons and global average assuming no trade after simulated nuclear conflicts under both
392 the Livestock Case and the No Livestock Case, with 50% livestock feed to human consumption.
393 The total calorie reduction is referenced to the observed production in 2013.
394
 Nations 5 Tg 16 Tg 27 Tg 37 Tg 47 Tg 150 Tg
 Livestock Case
 China -13.2 -47.5 -64.3 -78.1 -84.4 -99.7
 France -5.3 -21.5 -24.4 -31.4 -34.7 -99.4
 India -2.6 -0.7 0.9 -7.5 -21.3 -68.4
 Israel 27.3 14.7 11.1 8.3 -2.6 -80.0
 North Korea -12.6 -90.3 -92.4 -98.9 -99.6 -100.0
 Pakistan -1.9 13.7 15.1 -18.2 -23.7 -86.2
 Russia -2.4 -67.5 -86.2 -91.7 -92.2 -99.7
 United Kingdom 0.7 -32.7 -43.8 -62.1 -78.5 -95.8
 United States -12.8 -47.3 -63.3 -76.6 -86.9 -98.8
 Global -8.1 -23.7 -33.2 -42.0 -49.0 -81.1
 No Livestock Case (50% livestock feed to human consumption)
 China -12.3 -48.7 -65.5 -79.2 -84.3 -98.3
 France 49.0 18.3 14.0 3.3 -1.6 -99.2
 India -8.7 -6.2 -4.7 -11.2 -23.3 -64.3
 Israel 7.0 4.6 -0.3 -2.7 -17.8 -77.8
 North Korea -11.4 -91.0 -93.2 -99.8 -99.9 -100.0
 Pakistan -31.3 -15.5 -16.2 -41.1 -42.8 -88.6
 Russia 11.8 -64.7 -84.8 -90.6 -90.8 -99.1
 United Kingdom 17.9 -22.5 -35.8 -58.3 -78.4 -98.7
 United States 62.9 -8.9 -39.1 -64.4 -80.3 -94.7
 Global -5.8 -22.2 -32.0 -41.2 -48.5 -82.2
395
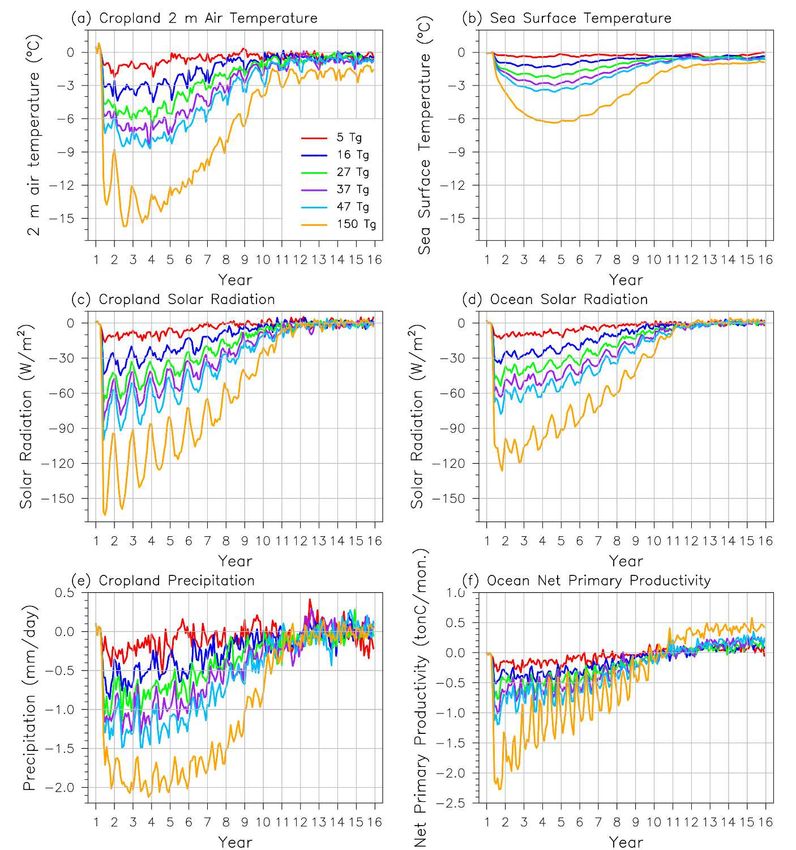
19

396
397 Figure 1. Change in surface temperature, solar radiation, and precipitation averaged over global
398 crop regions, and sea surface temperature, solar radiation, and net primary productivity over the
399 oceans following the six stratospheric soot loading scenarios studied here, for 15 years following
400 a nuclear war, derived from simulations in ref. 13. The anomalies are monthly climate variables
401 from simulated nuclear war minus the climatology of the control simulation, which is the average
402 of 45 years of simulation. The wars take place on 15 May of Year 1, and the year labels are on 1
403 January of each year. For comparison, during the last Ice Age 20,000 years ago, global average
404 surface temperatures were about 5°C cooler than present. Ocean temperatures decline less than
405 for crops, because of the ocean’s large heat capacity. Ocean solar radiation loss is less than for
406 crops because most ocean is in the Southern Hemisphere, where slightly less smoke is present.
407
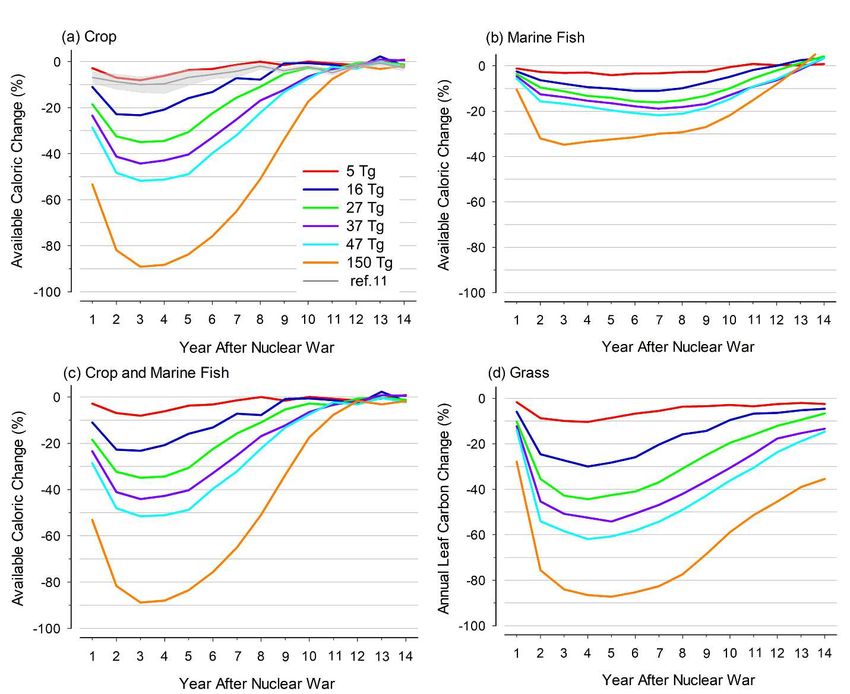
20

408
409
410 Figure 2. (a) Global average annual crop calorie change (%) (maize, wheat, rice, and soy,

411 weighted by their observed production (2018) and calorie content), (b) marine fish calorie changes

412 (%) after nuclear war, for the different soot injection scenarios, and (c) combined impact of crops

413 and marine fish on available caloric input. Grass leaf carbon is a combination of C3 and C4 grass

414 and the change is calculated as annual accumulated carbon. The gray line in (a) is the average of

415 six crop models from ref. 11 under the 5 Tg scenario, and the light gray envelope in (a) is the

416 standard deviation of the six crop models. If anything, CLM5 underestimates the crop response to

417 nuclear war.

418
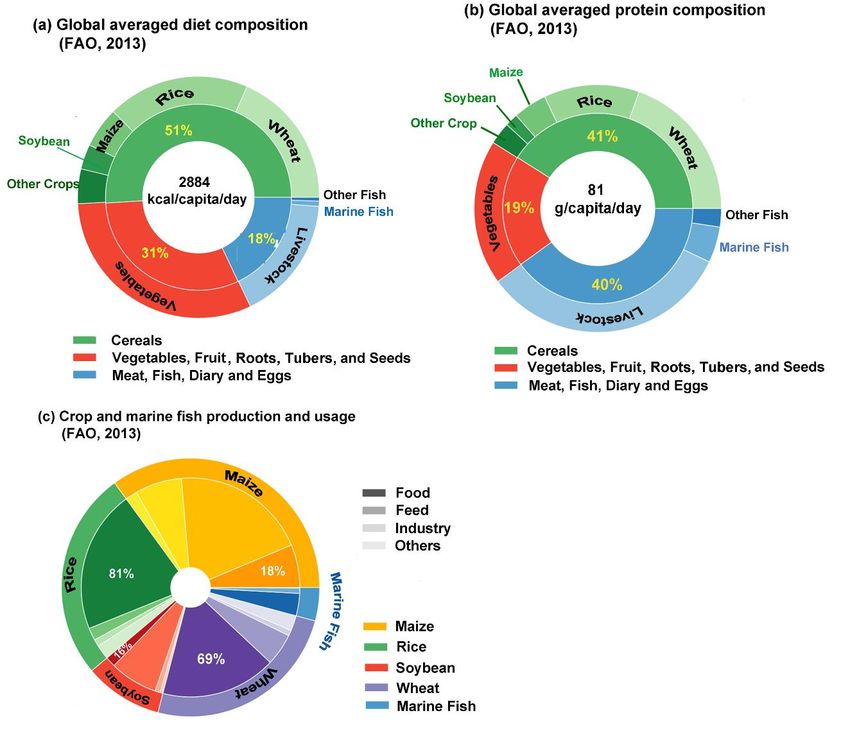
21

419

420
421 Figure 3. (a) Global average human diet composition22. (b) Global average human protein diet

422 composition22. Marine wild capture contributes 75% of marine fish40. (c) Distribution of four

423 major cereal crops and marine fish between human food and other uses22,41. The color gradient

424 legend in gray in (c) illustrates the usage of different crops and fish in colors. While humans

425 consume most of the wheat and rice grown, most maize and soybeans is used for livestock feed.

426
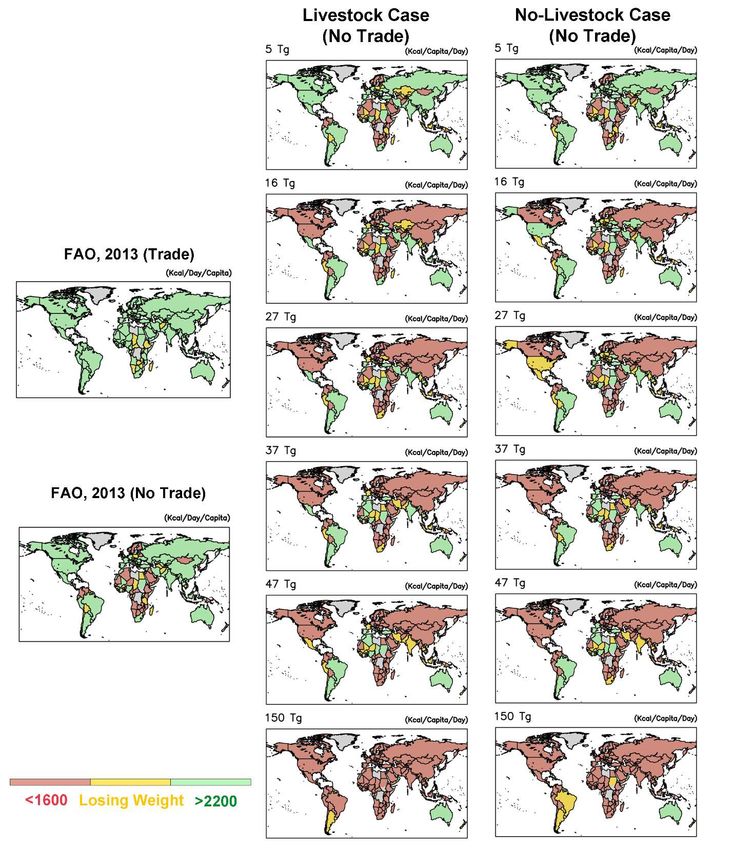
22

427
428 Figure 4. Food availability (Kcal/Capita/Day) in Year 2 after different nuclear war soot injections.

429 The left two maps are the caloric intake status in 2013 with international trade on and off, the

430 middle column is the Livestock Case, and the right column is the No Livestock Case with 50% of

431 livestock feed used for human food. All assume no international trade and that the total calories
23

432 are evenly distributed within each nation. Food consumption of less than 2200 Kcal/Capita/Day

433 would not allow an average seized adult to maintain their weight, and less than 1600

434 Kcal/Capita/Day would be less than needed to maintain a basal metabolic rate (also called resting

435 energy expenditure)24, and thus would lead to death after an individual exhausted their body energy

436 reserves in stored fat and expendable muscle. Australia is the only nation with enough calorie

437 intake under the 150 Tg scenario, but it may be greatly overestimated. After we turn off

438 international trade, wheat contributes almost 50% of the calorie intake in Australia, and production

439 of rice, maize, and soybean in Australia are less than 1% that of wheat22. Therefore, the wheat

440 response to simulated nuclear wars largely determines calorie intake in Australia. Since we use

441 spring wheat to represent wheat, and simulated spring wheat in Australia shows increasing or small

442 reductions under nuclear war scenarios in which more favorable temperatures occur for food

443 production, the calorie intake in Australia is more than other nations.

444
24

445
446
447 Figure 5. Overview of global calorie intake and sensitivity to livestock and trade assumptions. (a)

448 The global average change in caloric intake per person per day in year 2 post-war under the

449 Livestock case (yellow bars), in which all food sources except livestock are reduced for the

450 different soot injections averaged, and for the No Livestock case (red bars), in which also there are

451 no meat, dairy, or eggs. For the No Livestock case, additional calories potentially available by

452 human consumption of animal feed, mainly maize and soybeans, are plotted for various portions

453 of converted animal feed (pink tick marks). Critical food intake levels are marked in the right

454 margin. (b) Without international trade, the global population (%) that could be supported by

455 domestic food production at the end of Year 2 after a nuclear war if they receive 2200

456 Kcal/Capita/Day and the rest population would receive no food, under the Livestock and No

457 Livestock cases. National data are calculated first (Figure S6), and then aggregated to global data.

458
25

459 References

 1. Turco, R. P., Toon, O. B., Ackerman, T. P., Pollack J. B. & Sagan, C. Nuclear winter: Global

 consequences of multiple nuclear explosions, Science, 222, 1283-1292 (1983).

 2. Aleksandrov, V. V. & Stenchikov, G. L. On the modeling of the climatic consequences of the

 nuclear war, Proc. Appl. Math, 21 pp., Comput. Cent., Russ. Acad. of Sci., Moscow

 (1983).

 3. Robock, A. Snow and ice feedbacks prolong effects of nuclear winter. Nature, 310, 667-670

 (1984).

 4. Robock, A. et al. Climatic consequences of regional nuclear conflicts. Atm. Chem. Phys., 7,

 2003-2012 (2007).

 5. Robock, A., Oman, L. & Stenchikov, G. L. Nuclear winter revisited with a modern climate

 model and current nuclear arsenals: Still catastrophic consequences. J. Geophys. Res., 112,

 D13107 (2007).

 6. Coupe, J., Bardeen C. G., Robock, A. & Toon, O. B. Nuclear winter responses to global

 nuclear war in the Whole Atmosphere Community Climate Model Version 4 and the

 Goddard Institute for Space Studies ModelE. J. Geophys. Res. Atmos., 124, 8522-8543

 (2019).

 7. Harwell, M. A. & Cropper Jr., W. P. Potential effects of nuclear war on agricultural

 productivity, Chapter 4 of Environmental consequences of nuclear war, SCOPE 28,

 Volume II Ecological and Agricultural Effects, Second Edition. (Harwell, M. A. &

 Hutchinson, T. C., eds.). Wiley, Chichester, pp. 271-355 (1989).

 8. Cropper Jr., W. P. & Harwell, M. A. Food availability after nuclear war, Chapter 5 of

 Environmental consequences of nuclear war, SCOPE 28, Volume II Ecological and
26

 Agricultural Effects, Second Edition. (Harwell, M. A. & Hutchinson, T. C., eds.). Wiley,

 Chichester, pp. 359-426 (1989).

9. Xia, L. & Robock, A. Impacts of a nuclear war in South Asia on rice production in mainland

 China. Climatic Change, 116, 357-372 (2013).

10. Özdoğan, M., Robock, A. & Kucharik, C. Impacts of a nuclear war in South Asia on soybean

 and maize production in the Midwest United States. Climatic Change, 116, 373-387

 (2013).

11. Jägermeyr, J. et al. A regional nuclear conflict would compromise global food security. Proc.

 Nat. Acad. Sci., 117, 7071-7081 (2020).

12. Scherrer, K. J. N. et al. Marine wild-capture fisheries after nuclear war. Proc. Nat. Acad. Sci.,

 117(47), 29,748-29,758 (2020).

13. Oman, L., Robock, A., Stenchikov, G. L. & Thordarson, T. High-latitude eruptions cast

 shadow over the African monsoon and the flow of the Nile. Geophys. Res. Lett., 33,

 L18711, doi:10.1029/2006GL027665 (2006).

14. Wood, G. D. Tambora: The Eruption That Changed The World (Princeton University Press,

 Princeton, NJ) (2014).

15. Stommel, H. & Stommel, E., Volcano Weather; The Story of 1816, The Year Without a

 Summer, Seven Seas Press, Newport, RI, USA (1983).

16. Toon, O. B. et al. Atmospheric effects and societal consequences of regional scale nuclear

 conflicts and acts of individual nuclear terrorism. Atm. Chem. Phys., 7, 1973-2002 (2007).

17. Toon, O. B. et al. Rapid expansion of nuclear arsenals by Pakistan and India portends

 regional and global catastrophe. Science Advances, 5, eaay5478 (2019).
27

18. Yu, P. et al. Black carbon lofts wildfire smoke high into the stratosphere to form a persistent

 plume. Science, 365, 587-590 (2019).

19. Yu, P. et al. Persistent stratospheric warming due to 2019–2020 Australian wildfire smoke.

 Geophysical Research Letters, 48, e2021GL092609 (2021).

20. Peterson, D. A. et al. Australia’s Black Summer pyrocumulonimbus super outbreak reveals

 potential for increasingly extreme stratospheric smoke events. npj Climate and

 Atmospheric Science, 4, 38 (2021).

21. Food Composition Tables, FAO, http://www.fao.org/3/X9892E/X9892e05.htm, accessed 20

 June 2021.

22. Food and Agriculture Organization (FAO) of the United Nations. Food Balances

 http://www.fao.org/faostat/en/#data/FBSH, accessed 6 June 2021.

23. Mottet, A., et al. Livestock: On our plates or eating at our table? A new analysis of the

 feed/food debate, Global Food Security, 14, 1-8 (2017).

24. National Research Council, Energy, Chapter 3 of Recommended Dietary Allowances, 10th

 Edition. (U.S. National Academies Press, Washington, DC),

 https://www.ncbi.nlm.nih.gov/books/NBK234938/ (1989)

25. Falkendal, T., Otto, C., Schewe, J. et al. Grain export restrictions during COVID-19 risk food

 insecurity in many low- and middle-income countries. Nat Food 2, 11–14 (2021).

 https://doi.org/10.1038/s43016-020-00211-7

26. Grover, H. D. & Harwell, M. A. Biological effects of nuclear war II: Impact on the

 biosphere. Bioscience 35, 576–583 (1985).

27. Denkenberger, D. C., Pearce, J. M. Feeding everyone: Solving the food crisis in event of

 global catastrophes that kill crops or obscure the sun, Futures, 72, 57-68 (September 2015)
28

28. Hurrell, J. W. et al. The Community Earth System Model: A framework for collaborative

 research, Bull. Am. Meteorol. Soc., 94, 1339-1360, doi:10.1175/BAMS-D-12-00121.1.

 (2013).

29. Marsh, D. R., Mills, M. J., Kinnison, D. E., Lamarque, J.-F., Calvo, N. & Polvani, L. M.

 Climate change from 1850 to 2005 simulated in CESM1(WACCM), J. Clim., 26, 7372-

 7390, doi:10.1175/JCLI-D-12-00558.1 (2013).

30. Lombardozzi, D. L., Y. Lu, P. J. Lawrence, D. M. Lawrence, S. Swenson, K. W. Oleson,

 2020: Simulating agriculture in the Community Land Model Version 5. J. Geophys. Res.

 Biogeosciences, 125, e2019JG005529. https://doi.org/ 10.1029/2019JG005529

31. Fan, Y., Tjiputra, J., Muri, H., Lombardozzi, D., Park, C.-E., Wu, S., & Keith, D., Solar

 geoengineering can alleviate climate change pressure on crop yields, Nature Food, 2, 373-

 381, https://doi.org/10.1038/s43016-021-00278-w (2021).

32. Bardeen, C. G. et al. Extreme ozone loss following nuclear war resulting in enhanced surface

 ultraviolet radiation. Submitted to J. Geophys. Res. Atmos. (2021).

33. CLM Technical Note, https://escomp.github.io/ctsm-docs/versions/release-

 clm5.0/html/tech_note/, Accessed 20 June 2021.

34. Carozza, D. A., Bianchi, D. & Galbraith, E. D. Formulation, general features and global

 calibration of a bioenergetically-constrained fishery model. PLOS ONE, 12, e0169763

 (2017).

35. Carozza, D. A., Bianchi, D. & Galbraith, E. D. The ecological module of BOATS-1.0: A

 bioenergetically constrained model of marine upper trophic levels suitable for studies of

 fisheries and ocean biogeochemistry. Geosci. Model Dev., 9, 1545-1565 (2016).
29

36. Scherrer, K. & Galbraith, E. Regulation strength and technology creep play key roles in

 global long-term projections of wild capture fisheries. ICES J. Mar. Sci. (2020)

 doi:10.1093/icesjms/fsaa109.

37. FAO, 2020, The State of World Fisheries and Aquaculture 2020. Sustainability in action.

 Rome. https://doi.org/10.4060/ca9229en

38. Mills, M. J., Toon, O. B., Lee-Taylor, J., & Robock, A. Multi-decadal global cooling and

 unprecedented ozone loss following a regional nuclear conflict. Earth’s Future, 2, 161-176,

 doi:10.1002/2013EF000205 (2014).

39. Stenke, A., Hoyle, C. R., Luo, B., Rozanov, E., Gröbner, J., Maag, L., Brönnimann, S. &

 Peter T. Climate and chemistry effects of a regional scale nuclear conflict, Atmos. Chem.

 Phys., 13, 9713–9729, doi:10.5194/acp-13-9713-2013 (2013).

40. Food and Agriculture Organization (FAO) of the United Nations. The State of World

 Fisheries and Aquaculture 2020. Sustainability in Action. Rome.

 https://doi.org/10.4060/ca9229en.

41. Food and Agriculture Organization (FAO) of the United Nations. Commodity Balances.

 http://www.fao.org/faostat/en/#data/CB, accessed July 22 2021.
Supplementary Files
This is a list of supplementary les associated with this preprint. Click to download.

 NatureFoodNW13Supplementary.pdf
You can also read