RIIO-ED2 Engineering Justification Paper (EJP) Salisbury-Amesbury 132 kV Network Reinforcement - Investment Reference No: 57/SEPD/LRE/AMESBURY ...
←
→
Page content transcription
If your browser does not render page correctly, please read the page content below

RIIO-ED2 Engineering Justification Paper (EJP)

Salisbury-Amesbury 132 kV Network Reinforcement
Investment Reference No: 57/SEPD/LRE/AMESBURY
_______________________________________________________________________________________

Contents
1     Executive Summary ...................................................................................................................................... 4
2     Investment Summary Table ......................................................................................................................... 5
3     Introduction ................................................................................................................................................. 6
4     Background Information and Analysis ......................................................................................................... 7
    4.1      Existing Network Arrangement ............................................................................................................ 7
    4.2      Approved Works Associated with Connection Offer for Customer Supply ......................................... 8
    4.3      Local Energy Plan ................................................................................................................................. 9
    4.4      Demand and Generation Forecast ....................................................................................................... 9
    4.5      Existing Asset Condition ..................................................................................................................... 12
5     Detailed Analysis ........................................................................................................................................ 13
    5.1      Thermal Load Flow Analysis ............................................................................................................... 13
6     Optioneering .............................................................................................................................................. 15
    6.1      Summary of Options .......................................................................................................................... 16
    6.2      Option 1: Do-Minimum ...................................................................................................................... 17
    6.3      Option 2: Asset Replacement............................................................................................................. 18
      6.3.1          Thermal Load Flow Analysis ....................................................................................................... 18
    6.4      Option 3: Add New Assets.................................................................................................................. 18
    6.5      Option 4: Flexible Solution ................................................................................................................. 20
7     Summary of Cost Benefit Analysis (CBA).................................................................................................... 23
    7.1      Cost Benefit Analysis comparisons .................................................................................................... 23
    7.2      Summary of Cost ................................................................................................................................ 23
8     Deliverability and Risk ................................................................................................................................ 24
9     Conclusion .................................................................................................................................................. 25
10        Appendix 1. Assumptions....................................................................................................................... 26
Appendix 2: Demand Forecasts ......................................................................................................................... 27
Appendix 3. Initial System Analysis Results ....................................................................................................... 28
Appendix 4. Option 3 System Analysis Results .................................................................................................. 29
Appendix 5: Whole Systems consideration ....................................................................................................... 30

_________________________________________________________________________________________
                                        Page 2 of 31
_______________________________________________________________________________________
Definitions and Abbreviations
Acronym Definition
AIS Air-insulated Switchgear
ASCR Aluminium Conductor Steel Reinforced
BSP Bulk Supply Point
CBA Cost Benefit Analysis
CBRM Condition Based Risk Management
CEM Common Evaluation Methodology
CI Customer Interruptions
CML Customer Minutes Lost
CT Consumer Transformation
DFES Distribution Future Energy Scenarios
DNO Distribution Network Operator
EJP Engineering Justification Paper
ESA Electricity Supply Area
EV Electric Vehicle
FCO First Circuit Outage
FES Future Energy Scenarios
GIS Geographic Information System
GM Ground Mounted
GSP Grid Supply Point
HI Health Index
IDP Investment Decision Pack
LCT Low Carbon Technology
LEP Local Enterprise Partnership
LI Load Index
LRE Load Related Expenditure
LW Leading the Way
NPV Net Present Value
OHL Overhead Line
PM Pole Mounted
PV Photovoltaics
RSN Relevant Section of Network
SCO Second Circuit Outage
SSEN Scottish and Southern Electricity Network
SP Steady Progression
ST System Transformation
XLPE Cross-linked Polyethylene
_________________________________________________________________________________________
Page 3 of 31_______________________________________________________________________________________
1 Executive Summary
This Engineering Justification Paper (EJP) identifies the need to carry out works on the Salisbury-Amesbury
132kV network in the SEPD licence to accommodate the forecast load growth which will result in
network/circuit overloading, under our stakeholder supported Distribution Future Energy Scenario (DFES). The
current load index (LI) of this substation is LI1 however without any intervention to mitigate the risk of thermal
overloading this will progress to LI5. The primary driver for this scheme is Load-related.
Following optioneering and detailed analysis, as set out in this paper, the proposed scope of works is:
• Installation of a 132 kV isolator at Amesbury 132 kV substation and connection on to
Salisbury/Amesbury tee 132 kV circuit 2.
• Installation of 132 kV cable terminations on tower DD1 or DD2 on the Salisbury/Amesbury tee 132 kV
circuit 2 and laying of 132 kV cable to cable termination structure of Amesbury circuit 2 132 kV incomer
circuit breaker bay.
• Extension of the Salisbury 132 kV busbar to establish a second new 132 kV incomer circuit breaker
with associated equipment.
The cost to deliver the preferred solution is £1.6m and the works are planned to be completed in 2024/2025.
This scheme delivers the following outputs and benefits:
• The uplift in network capacity, under N-2, from 135MVA to 370MVA to meet the needs of our
customers.
• Facilitates the efficient, economic, and co-ordinated development of our Distribution Network for Net
Zero.
_________________________________________________________________________________________
Page 4 of 31_______________________________________________________________________________________
2 Investment Summary Table
Error! Reference source not found. below provides a high level summary of the key information relevant to
this Engineering Justification Paper (EJP) and installation of new assets on the Salisbury-Amesbury 132 kV
network.
Engineering Justification Paper Investment Summary
Name of Salisbury-Amesbury 132 kV network reinforcement
Scheme/Programme
Primary Investment Load - thermal overloading under SCO conditions
Driver
Scheme reference/ 57/SEPD/LRE/AMESBURY
mechanism or category
Output reference/type 132kV Circuits
Cost £1.6m
Delivery Year 2024/2025
Reporting Table CV1: Primary Reinforcement
Outputs in RIIO ED1
No
Business Plan?
(£m) ED1 ED2 ED3+
Spend Apportionment
SEPD - 1.6 -
Table 1: Investment Summary
_________________________________________________________________________________________
Page 5 of 31_______________________________________________________________________________________
3 Introduction
Our Load Annex sets out our methodology for assessing load-related expenditure and describes how we use
the Distribution Future Energy Scenarios (DFES) 2020 as the basis for our proposals. We have established a
baseline view of demand which provides a credible forward projection of load-related expenditure for the ED2
period and reflects strongly evidenced support from our stakeholders. Our ex-ante baseline funding request
is based on the minimum investment required under all credible scenarios. Our plan will create smart, flexible,
local energy networks that accelerate progress towards net zero – with an increased focus on collaboration
and whole-systems approaches.
This Engineering Justification Paper (EJP) describes our proposed load related investment plan for the
reinforcement of Salisbury/Amesbury 132 kV System in RIIO-ED2. The primary driver considered within this
paper is to manage exceedance of thermal capacity under second circuit outage (SCO) conditions on the 132
kV circuits from Mannington GSP
This EJP provides high-level background information for this proposed scheme explaining the existing network
arranges, the load growth forecasts the Distribution Future Energy Scenarios (DFES) and setting out the need
for this project. The Detailed Analysis section of the EJP describes the network studies undertaken, detailing
the results which further justify the need of the proposed investment.
In order to establish the most economic and efficient solution, the EJP provides an exhaustive list of the options
considered through the optioneering process. Each option is described in detail, with the EJP setting out the
justification for those options which are deemed unviable solutions, and therefore not taken forward to the
Cost Benefit Analysis.
The Cost Benefit Analysis (CBA) Summary section provides the comparative results of all the options considered
within the CBA and sets out the rationale and justification for the preferred solution.
Finally, this EJP also describes how we have established the cost efficiency of the plan with reference to the
unit costs that have been chosen, and the deliverability of the plan for RIIO-ED2.
_________________________________________________________________________________________
Page 6 of 31_______________________________________________________________________________________
4 Background Information and Analysis
In February 2019, a formal offer for a temporary supply of 30 MVA for a customer project was issued, triggering
the need for reinforcement of the Salisbury-Amesbury 132kV network to provide the minimum scheme for
this customer connection (see section 5.2 for further details). After delays on the customer’s side, this
temporary supply is expected to be required between winter 2022 and winter 2026 and is planned to be
supplied from Salisbury 132/33 kV BSP. Following the five year period of the temporary supply, the permanent
supply to that load is forecast to be 10 MVA.
In parallel, SSEN has carried out extensive scenario studies of demand and generation changes – the
Distribution Future Energy Scenarios (DFES) – on the basis of National Grid’s Future Energy Scenarios (FES)
2020. This framework comprises four potential pathways for the future of energy based on how much energy
may be needed and where it might come from. The variables for the four scenarios are driven by government
policy, economics and consumer attitudes related to the speed of decarbonisation and the level of
decentralisation of the energy industry. We have worked closely with our partner Regen to develop the
forecasts between 2020 and 2050 through enhanced engagement with the local authorities, local enterprise
partnerships (LEPs), devolved governments, community energy groups and other stakeholders.
The accepted offer to carry out the network reinforcement has allowed SSEN to investigate the long-term
adequacy of the infrastructure on the Salisbury-Amesbury 132 kV network to meet the DFES forecasts. It allows
us to propose network strengthening which can be carried out shortly after the reinforcements necessitated
by the temporary supply and ensure efficient use of assets beyond the required period of the temporary
supply.
4.1 Existing Network Arrangement
Salisbury and Amesbury BSPs are 132/33 kV substations which are supplied, under normal operating
conditions, by Mannington and Melksham GSP, respectively. Mannington GSP has four SGTs (plus one standby)
which are rated at 240 MVA each but can be operated at a winter rating of 288 MVA. From there, two 132 kV
circuits feed Salisbury BSP.
Amesbury BSP can be connected to Salisbury BSP via a 132 kV tee-off from one circuit of the
Mannington/Salisbury 132 kV double circuit line. Although the tee-off to Amesbury is constructed as a double
circuit line itself, only circuit 1 is presently energised, and the network is operated with a normally open point
at Amesbury BSP.
_________________________________________________________________________________________
Page 7 of 31_______________________________________________________________________________________
Figure 1: SLD of existing Mannington-Salisbury-Amesbury 132 kV network
4.2 Approved Works Associated with Connection Offer for Customer Supply
As part of the reinforcement scope within the customer quotation, there is a requirement to connect the
existing Salisbury/Amesbury 132 kV circuit (which is presently tee’d off the Mannington/Salisbury 132 kV
circuit 2) directly to the Salisbury 132 kV busbar. The need for this reinforcement is triggered by second circuit
outage (SCO) limitations on the Mannington 132 kV network, which have been brought forward by the
additional temporary load. This proposal is the minimum reinforcement required for securing SCO limitations
and was included as part of the non-contestable works charged to the customer.
The full scope is listed below and illustrated in Figure 2.
A. Extension of the Salisbury 132 kV busbar to establish a new 132 kV incomer circuit breaker with
associated equipment.
B. Installation of 132 kV cable terminations on tower DD1/DD2 on Salisbury/Amesbury tee 132 kV circuit
and laying of 0.4 km of 132 kV cable to cable termination structure of new 132 kV incomer circuit
breaker bay.
C. Reinforcement of the existing cable section (1.3 km) on the Mannington/Salisbury/Amesbury tee
132 kV circuit with a new 132 kV underground cable (minimum spring/autumn rating of 145 MVA).
D. Reinforcement of the existing cable section (1.3 km) on the Mannington/Salisbury 132 kV circuit with
a new 132 kV underground cable, (minimum spring/autumn rating of 145 MVA).
_________________________________________________________________________________________
Page 8 of 31_______________________________________________________________________________________
Figure 2: Annotated SLD of non-contestable works related to customer temporary supply
For the purposes of this study, it has been assumed that these works would have been completed by the
start of the ED2 price control period.
4.3 Local Energy Plan
The Swindon & Wiltshire Local Energy Strategy was published in 2018, detailing four strategic energy priorities
for the councils and both councils have pledged to be carbon neutral by 2030. As part of the drive to become
carbon neutral by 2030 the councils are taking the following actions:
• Developed parking standards requiring developer to install EV charge points where there is a need for
parking for both residential and non-residential development
• Both Councils have received funding to develop additional EV charge points within the local area
• Deployed the use of LED street Lighting
• Constructed renewable energy generation sites, i.e. solar farms, to offset energy needs
• Support the development of community energy projects
• Increase access to public transport including the use if electric buses
• Improve the energy efficiency of homes
4.4 Demand and Generation Forecast
Figure 3 and Figure 4 below show the forecast Winter Demand against the substation firm capacity limit for
Salisbury and Amesbury for all DFES scenarios out to Winter of 2032.
_________________________________________________________________________________________
Page 9 of 31_______________________________________________________________________________________
Load Forecast at Salsibusy BSP Winter (MVA)
160.00
140.00
120.00
100.00
80.00
60.00
40.00
20.00
0.00
Figure 3: Winter Demand Forecast at Salisbury BSP
Load Forecast at Amesbury BSP Winter(MVA)
140.00
120.00
100.00
80.00
60.00
40.00
20.00
0.00
Figure 4: Winter Demand Forecast at Amesbury BSP
_________________________________________________________________________________________
Page 10 of 31_______________________________________________________________________________________
There is a substantial quantity of existing generation connected to both the 11kV and 33 kV network which
exceeds 350 MW, with over 90% of this being solar PV. A further 112 MW of generation and approximately
100 MW of battery storage has been accepted for connection. Generation has not been included in demand
adequacy studies to ensure a conservative approach to meeting load requirements.
Winter Demand Forecast for Mannington-Salisbury / Poole-Shaftesbury Circuits
350.00
300.00
250.00
200.00
150.00
100.00
50.00
0.00
Figure 5 shows the forecast diversified Winter Demand for the combined Mannington-Salisbury 132 kV circuits
(including the battery charging load for the planned Salisbury BESS) and the Poole-Shaftesbury 132 kV circuit,
against the firm capacity of these three circuits (all supplied from Mannington GSP) for all FES scenarios out to
Winter of 2032. The 42.5MW Salisbury Battery Energy Scheme, scheduled from 2022/2023 onwards, has not
been included in the 2020 DFES evaluation and has been manually added to the data to provide the plot below.
Consideration of this additional 42.5 MW diversified load does not appear to take the load over its firm capacity
limit.
_________________________________________________________________________________________
Page 11 of 31_______________________________________________________________________________________
Winter Demand Forecast for Mannington-Salisbury / Poole-Shaftesbury Circuits
350.00
300.00
250.00
200.00
150.00
100.00
50.00
0.00
Figure 5: Winter Group Demand Forecast for Mannington-Salisbury/Poole-Shaftsbury
The projected primary demand at Salisbury and Amesbury BSPs by the end of ED2 is split as in Figure 6 and
Figure 7 below by demand type. The chart shows the largest impact on demand in the area is from EVs and
heat pumps, equating to 9.9% and 12% for Salisbury of the overall projected demand increase respectively and
6.5% and 9.8% for Amesbury.
Salisbury BSP 2027/2028 Winter Peak
Demand (MVA)
9.9% Baseline demand 68.95
MVA
Domestic 1.69 MVA
12.0%
2.0% Non-domestic 1.9 MVA
1.8%
Heat Pump 11.2 MVA
Evs 9.27 MVA
74.0%
Figure 6: Salisbury 2027/2028 Demand Type
_________________________________________________________________________________________
Page 12 of 31_______________________________________________________________________________________
Amesbury BSP 2027/2028 Winter Peak
Demand (MVA)
6.5% Baseline demand 68.95
0.1% MVA
9.8%
0.8% Domestic 1.69 MVA
Non-domestic 1.9 MVA
Heat Pump 11.2 MVA
Evs 9.27 MVA
82.4%
Figure 7: Amesbury BSP Demand Type
4.5 Existing Asset Condition
The Salisbury/Amesbury circuits 1 and 2 are part of Salisbury/Amesbury tee/Andover 132 kV circuits 1 and 2
(DD line) which was assessed under refurbishment scheme PS003626 and found to be in a good condition
requiring only tower painting. Although the tower painting is planned for the first part of RIIO-ED2, both circuits
are in good condition and can be energised before then – their current and future health index is HI1. The
capital works proposed here compliment these refurbishment works by making use of the Salisbury/Amesbury
circuit 2.
The 132 kV circuits from Mannington to Salisbury are also noted to be in good condition, with present and
future health index of H1.
The official health index of the Poole – Shaftesbury 132 kV circuit is noted to be HI5, however, it is understood
that this circuit has recently been rebuilt, and it would therefore be expected that the health rating has
improved to HI1.
In terms of transformers in the area, Salisbury 132/33 kV Transformer 3 is due to be replaced for health
reasons. It has a current health index of HI4, and a future health index of HI5. Transformer 1 and Transformer
2 are also noted to be degrading, currently assessed to be HI3, with a future health index of HI4. However,
these two are not scheduled for replacement.
5 Detailed Analysis
By way of load flow studies, a detailed analysis of FCO and SCO against the requirements of Engineering
Recommendation P2/7 has been performed for the area. The reported results correspond with the Consumer
Transformation scenario, being the selected SSEN baseline. Results for 2027/28 (last year of ED2 window) are
presented below.
In order to understand the progression of the network’s adequacy, different cases of the studies were
considered:
i. 2027/28 without temporary supply load;
_________________________________________________________________________________________
Page 13 of 31_______________________________________________________________________________________
ii. 2027/28 with 42.5 MW battery charging and 30 MW temporary supply added at Salisbury BSP, but
with none of the connection scheme’s network upgrades implemented;
iii. 2027/28 with 42.5 MW battery charging and 30 MW temporary supply added at Salisbury BSP, and
the full scope of the connection scheme’s network upgrades implemented;
iv. 2027/28 with 30 MW temporary supply added at Salisbury BSP, and the full scope of the
connection scheme’s network upgrades implemented, but no battery charging load (this is
specifically an SCO consideration, assuming that battery charging would be prohibited under
maintenance conditions to mitigate the effects of an SCO).
5.1 Thermal Load Flow Analysis
The results for FCO studies considering case (ii) are shown in table 2 below.
Because the greater 132 kV load group is classified as a type D, the group demand minus 20 MW would need
to be immediately restored following a FCO of one of the 132 kV circuits into the area, and the full group
demand would need to be restored within 3 hours (i.e. via basic switching). This requirement does not
challenge the firm (N-1) capacity of the infrastructure.
First Circuit Outage (FCO) Analysis – 2027/28 Case (ii)
Demand Group Season Group Contingency Loaded Circuit / FCO FCO
Class Transformer Demand* Capacity
Mannington GSP Remaining Mannington
Mannington GSP Winter E 972 MVA 1176 MVA
Transformer GSP Transformers
Remaining Mannington /
Mannington /
Salisbury 132 kV circuit
Salisbury 132 kV 257 MVA 314 MVA
and Poole / Shaftesbury
Winter D circuit
132 kV circuit
Poole / Shaftesbury Mannington / Salisbury
Mannington GSP 262 MVA 314 MVA
132 kV circuit 132 kV circuits
132 kV Network
Remaining Mannington /
Mannington /
Salisbury 132 kV circuit
Salisbury 132 kV 219 MVA 252 MVA
and Poole / Shaftesbury
Summer D circuit
132 kV circuit
Poole / Shaftesbury Mannington / Salisbury
221 MVA 252 MVA
132 kV circuit 132 kV circuits
Salisbury Fault on Salisbury Remaining Salisbury
Winter D 80.8 MVA 136.5 MVA
T1, T2 & T3 BSP Transformer BSP Transformers
Amesbury Fault on Amesbury Remaining Amesbury
Winter C 51.5 MVA 58.5 MVA
T1, T2 & T3 BSP Transformer BSP Transformers
Table 2: Load flow results for FCO analysis – 2027/28 Case (ii)
*FCO demand listed includes full group demand, prior to subtraction of 20 MW.
Reinforcement is not required on the basis of this study, as analysis shows that the network is P2/7 compliant
under FCO conditions. With case (ii) meeting the FCO requirements, it was considered unnecessary to study
cases (iii) and (iv).
Since the greater Mannington GSP supply area is classified as type E, the network also needs to have the
capability of maintaining supply under SCO. The results for SCO studies for case (i) are shown below. Load flow
studies were performed on the Spring-Autumn case file (i.e. loads set to their Maintenance Period values).
Second Circuit Outage (SCO) Analysis – 2027/28 Case (i)
_________________________________________________________________________________________
Page 14 of 31_______________________________________________________________________________________
Demand Group Season Group Contingency Loaded Circuit / SCO SCO
Class Transformer Demand Capacity
2 x Mannington Remaining 2 x
Maintenance
Mannington GSP E GSP Mannington GSP 905 MVA 1022 MVA1
period
Transformers Transformers
2 x Mannington /
Poole / Shaftesbury
Salisbury 132 kV 218 MVA 175 MVA2
132 kV circuit
circuits
Mannington GSP
Maintenance 1 x Mannington /
132 kV Network E
period Salisbury 132 kV
Mannington / Salisbury
circuit and Poole / 194 MVA 175 MVA
132 kV circuit
Shaftesbury 132
kV circuit
Table 3:Load flow results for SCO analysis – 2027/28 – case (i)
This result indicates that the network will be P2/7 non-compliant if the connection scheme does not go ahead.
The date at which these SCO limits are forecast to be exceeded, under case (i) would be 2024/25 for Leading
the Way, and 2026/27 for Consumer Transformation. Given that case (i) demand exceeds SCO capacity when
the connection scheme is not included in the system analysis, it is clear that for case (ii) where the connection
scheme does go ahead but with none of the associated network upgrades, this case would also encounter this
non-compliance.
With the inclusion of the connection scheme scope of works, that non-compliance with P2/7 under SCO
conditions is not expected. The results for the network analysis under case (iv) conditions is shown below.
Second Circuit Outage (SCO) Analysis – 2027/28 Case (iv)
Demand Group Season Group Contingency Loaded Circuit / SCO SCO
Class Transformer Demand Capacity
2 x Mannington Remaining 2 x
Maintenance
Mannington GSP E GSP Mannington GSP 948 MVA 1022 MVA
period
Transformers Transformers
2 x Mannington /
Poole / Shaftesbury
Salisbury 132 kV 248 MVA 320 MVA
132 kV circuit
circuits
Mannington GSP
Maintenance 1 x Mannington /
132 kV Network E
period Salisbury 132 kV
Mannington / Salisbury
circuit and Poole / 247 MVA 320 MVA
132 kV circuit
Shaftesbury 132
kV circuit
Table 4: Load flow results for SCO analysis – 2027/28 – case (iv)
While the greatest risk is presented in those cases where the connection scheme does not go ahead or the
associated works are delayed, there are other factors to consider in the event the scheme does progress in its
full capacity.
The results between the cases (ii) to (iv) highlight careful consideration must be taken against the scenarios to
adopt an approach that will mitigate the risk to overloading and enable the network to be operated in a safe
1Assuming up to 140 MVA pre-emptively transferred to Melksham and Axminster GSPs.
2
This figure is made up of the 145 MVA Rate B capacity of the recently upgraded Poole-Shaftesbury 132 kV circuit, plus
approximately 30 MVA load which can be transferred away by effecting five load transfers at 11 and 33 kV level.
_________________________________________________________________________________________
Page 15 of 31_______________________________________________________________________________________
and reliable manner. The summary below highlights key factors which should be considered when assessing
the need for network reinforcement within the Salisbury-Amesbury area. These are:
• A greater demand growth, compared to the CT base case, will exacerbate the issue and potentially
create risk of overloading in case (ii)
• Extensive switching is required in case (iii) to create more capacity and maintain P2/7 compliance
which operationally is a sub-optimal strategy
• Demand at Shaftesbury BSP has decreased over the past 1-2 years. There is a risk that if the load
increases to its previous levels then the results of case (iii) and (iv) could be impacted
• Once the network upgrades have been implemented for the connection scheme, the network will be
operating in an asymmetrical configuration, with uneven load sharing on the Andover – Amesbury 132
kV circuits, and very high bus-section load transfer across the 132 kV busbar at Salisbury (assuming the
busbar does, in fact, remain coupled during such an SCO event).
Since, for a Class E network of this size, under SCO, the full group demand requires to be supplied immediately,
the network is not P2/7 compliant for case (i). Additionally, given the points noted above it is proposed to
adopt a solution in addition of the scope of works proposed for the customer connection to:
• Mitigate the risk of SCO overloading in the cases described in section 6
• Mitigate the risk of overloading should the demand growth follow a trend that is not the baseline (CT
scenario)
• Enable the operation of a robust and reliable network
The voltages at the 132kV bus bars were also studied. The results of this can be viewed in Appendix 3. The
result of the study show that reinforcement is not required based on voltage as the voltages remain within
statutory limits.
6 Optioneering
This section of the report sets out the investment options that are considered when resolving overload issues.
As described below a holistic approach is taken to ensure investment options which are both least regrets and
represents best value for money for network customers are identified.
We have additionally considered the potential for using Whole System solutions (involving collaboration with
third parties) to deliver this investment programme. We set out our assessment in Appendix 5. This follows
our standardised approach for embedding Whole System considerations into our load and non-load
investment decisions (in line with Ofgem’s ED2 business plan guidance), as described in our Enabling Whole
System Solutions business plan annex.
Our assessment enables us to take a proportionate consideration of Whole System options, based on the
feasibility of such options existing and materiality of the costs involved.
In this case, our Whole Systems assessment finds that this programme is not expected to have any wider Whole
System interactions and there are no feasible Whole Systems solutions.
6.1 Summary of Options
The table below provides a high-level summary of the four investment options under consideration along with
the advantages and disadvantages associated with each. A more detailed description of each option is then
provided within the subsequent sub-sections.
Option Description Advantages Disadvantages Result
_________________________________________________________________________________________
Page 16 of 31_______________________________________________________________________________________
1. Do Carried out via demand Minimum cost and workload; Does not increase network Rejected
Minimum transfer from the overloaded capacity;
Small impact to existing
demand group to the
network; Does not capitalise on the
Bramley-Thatcham side of the
opportunity created by
network. Short delivery time.
the connection project for
temporary supply, to
enhance network
operational flexibility;
Leaves network in non-
standard arrangement of
only one circuit being
energised on the
Salisbury-Amesbury tee.
2. Asset The replacement of the full Increases normal and New servitudes or long Progressed
Replacement overloaded equipment contingency capacity of these outages required (the to OFGEM
including the following line circuits latter leaving the network CBA
sections between Poole and very vulnerable to faults);
Avoids the need for complex
Shaftesbury BSPs:
medium voltage load shifting In the case of Mannington
• 120 m 132 kV cable under contingency to Salisbury, the two
• 38.67 km 132 kV circuits are built on the
overhead line same set of structures,
and so replacing just one
AND
circuit with a larger
The following line sections conductor would not be
between Mannington GSP possible;
and Salisbury BSP:
Two separate, significant
• 1.24 km 132 kV cable asset replacements are
• 26.94 km 132 kV required to address two
overhead line SCO limitations, as a single
asset replacement cannot
cover both.
3. Add New Adding the following new Increases transfer capacity Preferred
Assets assets: between Mannington and solution
Bramley GSPs under
• 132 kV isolator at
contingency;
Amesbury Substation
for second Salisbury Relatively small scope and
– Amesbury circuit quick works for the quantity of
• Cable terminations additional network operational
on the Salisbury- flexibility this creates;
Amesbury tee 132 kV Normalises an unusual network
circuit at the tee-off arrangement due to the scope
point. of the connection project only
• Extension of addressing one circuit of the
Salisbury 132 kV tee, and resulting uneven
busbar and new 132 loading of Andover-Amesbury
kV bay circuits;
• 132 kV cable
between cable Allows for planned
terminations and maintenance on both of the
Salisbury 132 kV Mannington-Salisbury circuits
busbar. (one at a time) without risking
_________________________________________________________________________________________
Page 17 of 31_______________________________________________________________________________________
unserved load should a fault
occur;
Avoids the need for complex
medium voltage load shifting
under contingency;
Creates the option to move
Amesbury onto Mannington
GSP should Bramley GSP
experience thermal constraints
in the future.
4. Flexibility Flexible service contracts to Relatively low cost Amount of flexibility Rejected
Solution reduce peak demand and depends on location-
Defers need for network
defer capital investment specific resources and
reinforcement
interests. CAPEX may still
be required.
Flexibility would only be
required under planned
outage conditions,
potentially resulting in an
unattractive business case
for flexibility providers.
Table 5: Summary of 132 kV circuit reinforcement investment options
6.2 Option 1: Do-Minimum
Estimated Cost: N/A
In this case, the minimum option would be to transfer load out of the Salisbury/Amesbury demand group.
Since no P2/7 violations would be noted if the connection scheme goes ahead, this is a technically viable option
for the cases where the connection scheme progresses. It is not, however advisable, as it leaves the network
in a less than optimal, non-standard state and requires several switching actions to occur consecutively to
enable this option. There is also a risk that if the connection scheme were to be delayed or cancelled, this
option would not enable suitable volumes of load transfer to maintain P2/7 compliance at Salisbury/Amesbury.
As this option is operationally sub-optimal and does not technically mitigate the risks of overloading under SCO
conditions, this option has been rejected and not assessed in the OFGEM CBA.
6.3 Option 2: Asset Replacement
Estimated Cost: £ 9,390k
This option proposed the replacement of the existing circuits with higher rated conductors. This option would
see the replacement of:
• 132kV circuit between Poole and Shaftsbury
o 120 m 132 kV cable
o 38.67 km 132 kV overhead line
• 132kV circuit between Mannington GSP and Salisbury BSP:
o 1.24 km 132 kV cable
o 26.94 km 132 kV overhead line
• 132kV circuit between Mannington GSP and Poole BSP
o 20.62km 132 kV overhead line
_________________________________________________________________________________________
Page 18 of 31_______________________________________________________________________________________
6.3.1 Thermal Load Flow Analysis
The SCO condition which proved to be problematic in the base study (i.e. case (i), Maintenance period loading)
has been tested with the scope of Option 2 implemented. For the purposes of the simulation a twin Lynx
overhead conductor and a 1000 mm2 Cu cable were used for the overhead and underground section of the
upgrade, respectively.
Second Circuit Outage (SCO) Analysis – 2027/28
Demand Group Season Group Contingency Loaded Circuit / SCO SCO
Class Transformer Demand Capacity
Poole / Shaftesbury
2 x Mannington / 196 MVA 252 MVA
132 kV circuit
Salisbury 132 kV
circuits Mannington/Poole 132kV
116.9 252
Mannington GSP circuit
Maintenance
132 kV Network E 1 x Mannington /
period
Salisbury 132 kV
Mannington / Salisbury
circuit and Poole / 190 MVA 252 MVA
132 kV circuit
Shaftesbury 132
kV circuit
Table 6: Load flow results for SCO analysis – 2027/28 – case (i)
In this proposed option, the replacement of the 132kV circuits will resolve the SCO overloading issue. For the
worse case, the remaining in service circuit (Poole/Shaftesbury) will be loaded to 78% of the new circuit rating.
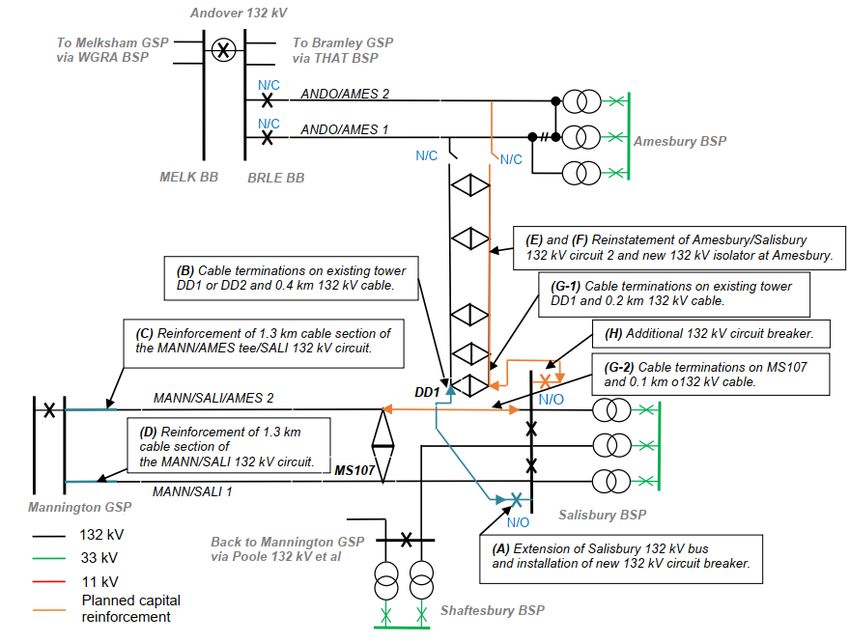
6.4 Option 3: Add New Assets
Estimated Cost: £1,600k
The scope for this solution has been investigated in detail and marked up in the diagram in Figure 8 below,
with items A-D indicating the scope to be completed within the connection project for temporary supply, and
items E-H required within this Option.
_________________________________________________________________________________________
Page 19 of 31_______________________________________________________________________________________
Figure 8: Salisbury-Amesbury tee: addition of new assets
Item E: Reinstatement of the de-energised Salisbury/Amesbury tee 132 kV circuit 2.
The Salisbury/Amesbury circuits 1 and 2 are part of Salisbury/Amesbury tee/Andover 132 kV circuits 1 and 2
(DD line) which was assessed under refurbishment scheme PS003626 and found to be in a good condition
requiring only tower painting. Tower painting is planned for the first part of RIIO-ED2, and as such, capital
works proposed here complement these refurbishment works by making use of the Salisbury/Amesbury
circuit 2.
Subtotal: NIL.
Item F: Installation of a 132 kV isolator at Amesbury 132 kV substation and connection on to
Salisbury/Amesbury tee 132 kV circuit 2.
These works at Amesbury 132 kV substation involve:
• Installation of down-droppers to incoming termination structures and 132 kV isolator just below tower
DD51 on the western end of Amesbury 132 kV substation.
• Disconnection of risers from low-level 132 kV busbar to high-level 132 kV strain busbar just before
Amesbury A1MTB.
• Extension of high-level 132 kV strain busbar from A2MT on the eastern end of Amesbury 132 kV
substation to the new 132 kV isolator on the western end of the substation.
Subtotal: £ 375k
_________________________________________________________________________________________
Page 20 of 31_______________________________________________________________________________________
Item G: Installation of 132 kV cable terminations on tower DD1 or DD2 on the Salisbury/Amesbury tee
132 kV circuit 2 and laying of 132 kV cable to cable termination structure of Amesbury circuit 2 132 kV
incomer circuit breaker bay.
Initially it was proposed to terminate cables on the Salisbury/Amesbury tee 132 kV circuit 2 at tower DD2 with
0.4 km of 132 kV cable to Salisbury 132 kV substation. This option avoids moving the Mannington/Salisbury
132 kV circuit 2, which is connected onto tower DD1, but requires securing a cable route through a field from
tower DD2 to Salisbury 132 kV substation. If the Salisbury/Amesbury tee 132 kV circuit 2 is terminated at DD1
then the Mannington/Salisbury 132 kV circuit 2 will need to be terminated at MS107. The decision for
terminating the cables at DD1 or DD2 is subject to more detailed design but initial discussions highlight the
need to cater for the cable termination to be made at tower DD1 due to concerns with securing a 132 kV cable
route. The following works consider this variation:
• Retrofitting sealing end platform to terminate the Mannington/Salisbury 132 kV circuit 2 onto tower
MS107. For these works, there will be a 50:50 split with connection (temporary supply) project.
(£ 150k)
• Sealing end structure for Mannington circuit 2 and 100 m cable route connection to MS107. (£ 250k)
• Retrofitting sealing end platform to terminate the Salisbury/Amesbury 132 kV circuit 2 onto tower
DD1. For these works, there will be a 50:50 split with the connection project for temporary supply. (£
150k)
• Sealing end structure for Amesbury circuit 2 and 200 m cable route connection to tower DD1. (£ 300k)
Subtotal: £ 850k
Item H: Extension of the Salisbury 132 kV busbar to establish a second new 132 kV incomer circuit breaker
with associated equipment.
These works at Salisbury 132 kV substation involve:
• Elevate and extend the existing 132 kV busbar section 3 from the Mannington circuit 2 132 kV isolator.
• Establish a new 132kV circuit breaker bay onto the extended section of the Salisbury 132 kV busbar
section 3.
Subtotal: £ 375k
The total estimated cost is £1.6m.
The SCO condition which proved to be problematic in the base study (i.e. case (i), Maintenance period loading)
has been tested with the scope of Option 3 implemented. The thermal analysis results, shown in appendix 4,
show that this solution is well with P2/7 compliance limits for thermal loading. The voltages at the 132kV bus
were also assessed. The results, shown in appendix 4, highlighted that the voltages remain within statutory
limits.
6.5 Option 4: Flexible Solution
An alternative to conventional reinforcement is through the use of flexible service. The CEM framework would
evaluate options around timing of network investments, in particular taking into account:
o the range of different options available (e.g., reinforcing the network, using flexibility, or doing
nothing);
o the time periods in which actions can be taken; and
o the existence of uncertainty, and the impact of incremental information which becomes available
over time.
_________________________________________________________________________________________
Page 21 of 31_______________________________________________________________________________________
The baseline reinforcement cost used as an input into the CEM framework is the costs associated with Option
3, equating to £1.6m. Figure 9 below shows that the half-hourly forecast 2028 Spring/Autumn demand profile
for the combined load on the Mannington 132 kV circuits to Salisbury exceeds the effective SCO capacity (made
up of the 145 MVA Rate B capacity of the Poole-Shaftesbury 132 kV circuit, plus approximately 30 MVA load
which can be transferred away by effecting five load transfers at 11 and 33 kV level, and accounting for the
high losses experienced on the long 132 kV line from Poole to Shaftesbury) during the afternoon/evening peak.
The total duration of exceedance for the Consumer Transformation scenario is 7 hours.
Figure 9: Salisbury and Shaftesbury forecast Spring/Autumn profile for 2028 without flexibility services.
The MW exceedance, the daily and annual overload hours (Table 7) and the flexibility unit costs of £150 per
MW per hour and £150 per MWh were used as input parameters in the CEM CBA model.
2020 2021 2022 2023 2024 2025 2026 2027 2028
Hrs/day required 0 0 0 0 0.5 2.5 4.0 5.5 7.0
Days/yr required 0 0 0 0 64 64 64 64 64
No. Dispatch/yr 0 0 0 0 64 64 64 64 128
Dispatch duration 0 0 0 0 0.5 2.5 4.0 5.5 6.0
Table 7: Estimated Dispatch Requirements for Flexibility Solution.
The CEM CBA model suggests that under all DFES 2020 scenario, there is no economic benefit to deferring
conventional reinforcement. As a result of this, the use of flexible services has not been carried through to
the OFGEM CBA.
_________________________________________________________________________________________
Page 22 of 31_______________________________________________________________________________________
Figure 10: CEM Flexibility CBA Optimal Deferral Results
Despite our commitment to the Flexibility First approach, in this scenario the current assessment has
concluded the required Flexibility could not be secured effectively within the allocated investment for the
scheme. However, prior to committing to this investment we will re-assess the options using the CEM
Framework to confirm the optimal solution for this location. Should new services be available, or market
prices become favourable SSEN will market test the Flexibility Services in the affected area to establish the
cost, location and technical capabilities of the available flexibility before confirming the optimal route.
Flexibility will only be pursued where the economic benefit of deferring the capital investment exceeds the
additional cost of the flexibility service, providing an optimised net present value to consumers or potentially
delivering additional whole system benefits. Further to this, flexibility may provide OPEX benefits to SSEN
and our customers during scheme delivery by
a) Avoiding/reducing the risk of outages during planned works through load/generation management
b) Avoiding/reducing the need for Mobile Diesel Generation in planned or unplanned outage scenarios
c) Reducing the scale of the works through the implementation of a ‘Hybrid’ scheme, part
reinforcement and part Flexibility.
All scenarios will be reviewed, and Flexibility secured should the CEM Framework CBA prove a positive
benefit, with justification of the decisions/reviews presented as required.
Further detail of our Flexibility First approach and assessment methodology can be found in Appendix 6 of
the DSO plan – Delivering value through Flexibility.
_________________________________________________________________________________________
Page 23 of 31_______________________________________________________________________________________
7 Summary of Cost Benefit Analysis (CBA)
Table 8 below summarises the CBA outcome for all the valid options considered to resolve the thermal
constraints at within the Salisbury/Amesbury 132kV network under SCO conditions. The results of the cost
benefit analysis show that option 3 is the preferred option. This option has the lowest CAPEX cost and
subsequently the lowest NPV value of all the options assessed.
7.1 Cost Benefit Analysis comparisons
Options NPV After 45 Total
Years (£k) Investment Cost
(£k)
Option 2 – Asset Replacement -8,960 9,390
Option 3 – Add New Asset -1,530 1,600
Table 8:CBA Results Summary
7.2 Summary of Cost
Our draft RIIO ED1 Business Plan costs are derived from our outturn RIIO ED1 expenditure. We have modified
costs per activity, capturing and reporting those adjustments in our cost-book. By tying our costs back to
reported, outturn, real life data this approach provides multiple data points on which both the Regulator and
we can benchmark cost efficiency. It provides a high level of cost confidence in our Business Plan cost
forecast for RIIO ED2.
Unlike asset replacement, load projects will include more unique and site-specific costs. For example; civils,
waterway, road or rail crossings; and local planning considerations. Many years ahead of delivery, projects
are not fully designed. We have therefore reflected the cost impact of this future scope refinement within
the adjusted unit costs we have applied. Further detail on our unit cost approach, cost efficiency and cost
confidence for RIIO-ED2 can be found within our Cost & Efficiency Annex.
We expect that as our Business Plan continues to develop, project scopes and costs will be refined, especially
with valuable stakeholder feedback on our draft proposals. In our final Business Plan submission in
December our cost forecasts will contain that refinement and the changes captured within our supporting
Plan documentation. Development of our Commercial Strategy and updated project scope for the initial year
of RIIO ED2 is expected to drive much of this refinement.
Options Unit 2024/25 2025/26 2026/27 2027/28 2028/29 Total
Option 2 £m 9.390 0 0 0 0 9.390
– Asset
Replacem
ent
Option 3 £m 1.6 0 0 0 0 1.60
– Add
New
Asset
Table 9: Summary of Investment Cost
_________________________________________________________________________________________
Page 24 of 31_______________________________________________________________________________________
8 Deliverability and Risk
Our deliverability strategy detailed in Chapter 16 of the Business Plan describes our approach to evidencing
the deliverability of our overall plan as a package, and its individual components. Testing of our EJPs has
prioritised assessment of efficiency and capacity, and this has ensured that we can demonstrate a credible
plan to move from SSEN’s ED1 performance to our target ED2 efficiency. We have also demonstrated that
SSEN’s in house and contractor options can, or will through investment or managed change, provide the
capacity and skills at the right time, in the right locations. This assessment has been part of the regular
assessment of our EJPs, CBAs and BPDTs, and we will further refine our bottom up efficiencies and work plan
phasing for our final submission in December through the ongoing development of our ED2 Commercial
& Deliverability Strategy and engagement with our supply chain.
Our deliverability testing has identified a major strategic opportunity which is relevant to all EJPs.
• In ED2, SSEN will change the way Capital Expenditure is delivered, maximising synergies within the network
to minimise disruptions for our customers. This is particularly relevant for a Price Control period where
volumes of work are increasing across all work types.
• The principle is to develop and deliver Programmes of work, manage risk and complexity at Programme
level and to develop strategic relationships with our Suppliers and Partners to enable efficiency
realisation.
• The Commercial strategy will explore the creation of Work Banks (WB) and identify key constraints. The
Load work will be the primary diver for a WB, supplemented by Non-Load work at a given Primary
Substation. This approach will capitalise on synergies between the Load and Non-Load work, whereby the
associated downstream work from a Primary Substation will maximise outage utilisation, enabling the
programme to touch the network in a controlled manner with the objective of touching the network once.
Where there is no Primary Load scheme to support the Non-Load work, these will be considered and
packaged separately, either insourced or outsourced dependant on volume, size and complexity.
• Transparency with the Supplier in terms of constraints, challenges, outage planning and engineering
standards will capitalise on efficiencies, supported by a robust contracting strategy.
The specific considerations for deliverability based on the scope of this EJP are detailed below:
• It is not expected the skillset at SSEN will present any risk to the deliverability of this project. SEPD
have a suitable volume of competent personnel who are able to design, build, install and commission
the preferred solution.
• SSEN have in place existing standard frameworks with equipment manufacturers. The preferred
solution proposed in this paper will utilise the equipment from these frameworks to mitigate risks
against delays to equipment delivery.
• The proposed project scope will not only mitigate the SCO overloading issue but will also establish
network standardisation and symmetry. If the temporary load connection does not materialise, there
is a risk that the proposed project scope discussed in this paper would result in network asymmetry.
_________________________________________________________________________________________
Page 25 of 31_______________________________________________________________________________________
9 Conclusion
The purpose of this Engineering Justification Paper (EJP) has been to describe the overarching investment
strategy that SSEN intends to take during RIIO ED2 for the load related investment on the Salisbury-Amesbury
network.
The options considered to resolve the thermal overloading under SCO conditions were:
• Option 1: Do Minimum
• Option 2: Asset Replacement
• Option 3: Add New Asset
• Option 4: Flexible Solution
The preferred investment for the Salisbury-Amesbury 132kV network in RIIO ED2 is Option 3: Add New Asset
and the associated costs and volumes are proposed for delivery during RIIO ED2 presented in the table below.
Asset Category Unit 2024/25 2025/26 2026/27 2027/28 Total
132 kV
# 2 0 0 0 2
switchgear
132 kV busbar
# 2 0 0 0 2
extension
132 kV cable
# 1 0 0 0 1
termination
CV1
Reinforcement £m 1.60 0 0 0 1.60
RIIO ED2 Spend
Table 10: Summary of investment cost and volume of the preferred option
_________________________________________________________________________________________
Page 26 of 31_______________________________________________________________________________________
10 Appendix 1. Assumptions
CI/CML Table
Year 2020 2021 2022 2023 2024 2025 2026 2027 2028 2029
CT 115.0 120.0 124.9 129.7 134.7 141.2 149.1 157.2 165.6 174.4
Firm Capacity 135 135 135 135 135 135 135 135 135 135
Difference 20.0 15.0 10.1 5.3 0.3 -6.2 -14.1 -22.2 -30.6 -39.4
Customer No. 74808 75556 76312 77075 77846 78624 79410 80204 81006 81816
1% Growth
MW per 0.0015 0.0016 0.0016 0.0017 0.0017 0.0018 0.0019 0.0020 0.0020 0.0021
customer
No. Faults per 0.2265 0.2265 0.2265 0.2265 0.2265 0.2265 0.2265 0.2265 0.2265 0.2265
Year
Final Input
CI 0.000 0.000 0.000 0.000 0.000 -0.998 -2.139 -3.193 -4.181 -5.121
CML 0.0 0.0 0.0 0.0 0.0 -179.7 -384.9 -574.8 -752.6 -921.9
Table 11: CI/CML for Do Nothing Option.
_________________________________________________________________________________________
Page 27 of 31_______________________________________________________________________________________
Appendix 2: Demand Forecasts
Table 12, shown below, shows the demand projections in MVA for substations most relevant to this study, for
all forecast scenarios, as guided by the DFES 2020. This summarised forecast includes loads that are most
relevant to this study, i.e. Salisbury and Amesbury, as well as Shaftesbury (the BSP en route to Salisbury, on
the Mannington – Pool – Shaftesbury – Salisbury circuit), Andover and Thatcham (the BSPs en route to
Amesbury, on the Bramley – Thatcham – Andover – Amesbury alternative supply circuit).
GSP BSP ED1 (last 3 years) ED2 Future
2020/ 2021/ 2022/ 2023/ 2024/ 2025/ 2026/ 2027/ 2028/ 2029/ 2030/
21 22 23 24 25 26 27 28 29 30 31
Salisbury 70.2 71.2 102.0 102.7 103.6 104.5 105.4 86.4 87.3 88.7 90.1
Mannington
Progression
Shaftesbury 57.1 58.0 58.8 59.9 60.8 61.7 62.6 63.5 64.3 65.4 66.6
Steady
Melksham Amesbury 50.6 50.8 51.0 51.3 51.5 51.8 52.2 52.5 52.9 53.3 53.8
Andover 66.3 67.1 67.8 68.3 68.7 69.4 70.2 71.2 72.3 73.3 74.5
Bramley
Thatcham 140.8 141.9 143.3 144.4 145.5 146.6 148.0 149.7 151.6 153.5 155.5
Salisbury 70.5 73.2 105.8 108.2 110.8 114.3 118.4 102.8 107.3 112.2 117.5
Transformation
Mannington
57.5 60.3 63.1 66.0 68.8 72.7 77.1 81.5 86.1 91.0 96.2
Consumer
Shaftesbury
Melksham Amesbury 50.7 51.8 52.9 54.0 55.2 56.8 58.7 60.7 62.8 65.0 67.4
Andover 66.5 67.9 69.4 71.5 73.8 76.8 80.7 84.8 88.9 93.2 97.8
Bramley
Thatcham 141.6 146.3 151.6 156.5 161.7 167.4 174.7 182.5 190.4 198.4 206.2
Salisbury 70.3 71.7 102.9 103.8 105.0 106.1 108.0 90.0 92.0 94.2 96.6
Transformation
Mannington
Shaftesbury 57.3 58.7 60.0 61.3 62.5 63.8 65.9 68.0 70.1 72.3 74.6
System
Melksham Amesbury 50.6 51.1 51.4 51.8 52.2 52.6 53.5 54.4 55.2 56.2 57.1
Andover 66.3 67.3 68.1 68.7 69.2 70.0 71.4 73.4 75.4 77.4 79.5
Bramley
Thatcham 141.2 143.3 145.4 147.1 148.9 150.8 154.1 157.8 161.8 165.5 169.3
Salisbury 70.5 73.3 106.0 108.5 111.8 115.3 119.7 104.4 109.1 114.1 121.1
Mannington
Leading the
Shaftesbury 57.5 60.5 63.3 66.4 69.9 73.7 78.3 82.9 87.7 92.5 99.0
Way
Melksham Amesbury 50.7 51.9 52.9 54.1 55.6 57.2 59.2 61.3 63.4 65.6 68.6
Andover 66.5 67.9 69.4 71.8 74.6 77.6 81.8 86.1 90.6 95.2 101.3
Bramley
Thatcham 141.6 146.6 151.8 156.8 162.5 168.3 176.0 184.2 192.8 201.3 211.5
Table 12: BSP Demand Forecast Relevant to Network Analysis
_________________________________________________________________________________________
Page 28 of 31You can also read