Rising Markups, Common Ownership, and Technological Capacities - Alexandra J. Gibbon Jan Philip Schain April 2021
←
→
Page content transcription
If your browser does not render page correctly, please read the page content below
NO 340

Rising Markups, Common Ownership,
and Technological Capacities
Alexandra J. Gibbon
Jan Philip Schain

April 2021
IMPRINT

D IC E D I SCU SSI ON PAP E R

Published by:
Heinrich-Heine-University Düsseldorf,
Düsseldorf Institute for Competition Economics (DICE),
Universitätsstraße 1, 40225 Düsseldorf, Germany
www.dice.hhu.de

Editor:
Prof. Dr. Hans-Theo Normann
Düsseldorf Institute for Competition Economics (DICE)
Tel +49 (0) 211-81-15125, E-Mail normann@dice.hhu.de

All rights reserved. Düsseldorf, Germany 2021.

ISSN 2190-9938 (online) / ISBN 978-3-86304-598-2

The working papers published in the series constitute work in
progress circulated to stimulate discussion and critical comments.
Views expressed represent exclusively the authors’ own opinions
and do not necessarily reflect those of the editor.
Rising Markups, Common Ownership, and
                    Technological Capacities∗
                     Alexandra J. Gibbon†                   Jan Philip Schain†

                                              April 2021

                                                Abstract

       This paper analyses the impact of common ownership on markups and innovation and
       adds to the discussion of the recently observed patterns of a long term rise in market
       power. Using a rich panel of European manufacturing firms from 2005 to 2016, we
       structurally infer markups and construct a measure of common ownership. We use a
       propensity score reweighting estimator to eliminate biases due to observational charac-
       teristics and find an increase of firm markups ranging up to 3.4% in industries with
       high technological spillovers after the first exposure to common ownership. For compa-
       nies directly held by common institutional investors, we also measure a positive effect
       on citation-weighted patents of up to 9.5% in high-spillover industries. Both findings
       are consistent with recent theoretical findings in Lopéz and Vives (2019). We further
       exploit industry technology classifications by the European Commission to shed some
       light on the heterogeneity of the effect of common ownership across the sample.

       JEL codes: L10, L41, L60, G23, G32, O34
       Keywords: Competition, Common Ownership, Market Power, Industry Structure,
       Antitrust, Innovation

   ∗
     We would like to thank Willem Boshoff, Jan De Loecker, Tobias Salz, Martin Schmalz, Philipp Schmidt-
Dengler, Jo Seldeslachts, Philip Sutherland, Joel Stiebale, Frank Verboven, and Zhihong Yu for helpful com-
ments and suggestions. This paper also benefited from discussions with participants of the Market Power
Trends workshop (Bertelsmann Stiftung & German Monopolies Commission 2020), the RISE3 workshop
(Max-Planck Institute Munich, 2020), the DICE PhD seminar (Heinrich-Heine University Düsseldorf, 2019
and 2020, DFG GRK 1974) and the CCLE webinar at Stellenbosch University (2021).
   †
     Düsseldorf Institute for Competition Economics (DICE), Heinrich-Heine University Düsseldorf.

                                                    1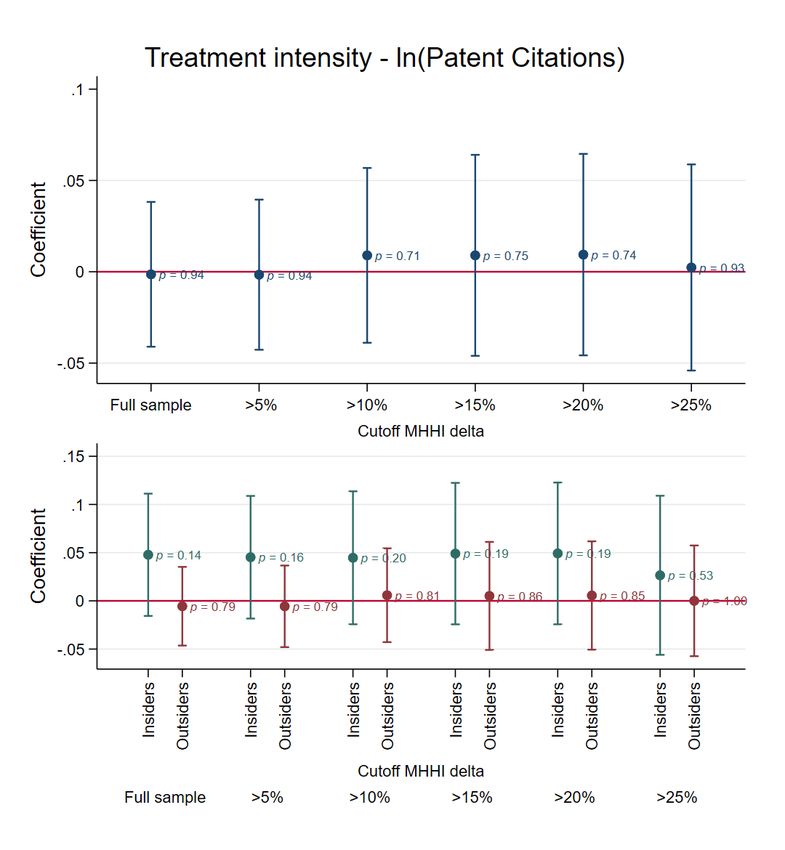
1     Introduction

The recently observed pattern of a long term rise in market power accompanied by increasing
industry concentration (De Loecker et al., 2020; Autor et al., 2020; Syverson, 2019) has
sparked interest and worries in the economic consequences and causes of this phenomenon.
Simultaneously, the rapidly increasing prevalence of diversified institutional investors has
changed industry concentration by creating ownership links between competing companies
(Azar et al., 2018). Common ownership, defined as at least two competing firms being
held by overlapping sets of institutional investors creating indirect corporate networks, is
potentially one reason that we observe rising markups across many industries and countries.
    Investors owning larger shares of an industry are in a position to exert a certain degree
of influence on directly competing companies. Economists (for example Azar et al., 2018)
argue that in settings of common ownership by institutional investors, firms might no longer
take strategic decisions independently. Aligned shareholder value maximisation incentives of
firms provide room for possible anti-competitive behaviour regarding prices or innovation.
    In total, institutional investors held over USD 85 trillion of public equity on the world-
wide level in 2014, as opposed to a total volume of only USD 3 trillion in 1980 (Monopolies
Commission, 2016). Institutional investors held on average around 40% of Western European
countries’ GDP in assets under management in 2018 (OECD, 2019), with common ownership
emerging from a concentration of few but large investors within the same industry. Consid-
erable volumes of common ownership can be found in publicly listed companies, for instance
in the airline, banking, or pharmacy sector in the USA (Azar et al., 2018), as well as in the
chemical sector and car industry in Germany (Seldeslachts et al., 2017). The importance
of common ownership has also been recognized by the European Commission (EC) in two
recent high-profile merger cases. In both decisions, the EC identifies a high concentration
of common ownership in the biotech and agrochemical industry and acknowledges the crit-
ical role of common ownership with respect to strategic decisions of firms, such as prices
and innovation (European Commission, 2017, 2018). Particular cases of interventions by

                                              2
common owners have gained attention from the media1 . Apart from direct interventions, a
reduction in performance-based managerial incentives by common owners has been analysed
as a possible mechanism leading to anti-competitive outcomes (Antón et al., 2021).
    Early theoretical articles, such as Reynolds and Snapp (1986); Bresnahan and Salop
(1986); Salop and O’Brien (2000) extend the classical concentration measure Herfindahl-
Hirschman Index (HHI) to include ownership links. These articles conclude that common
ownership exerts an upward pressure on prices through rivals’ profit internalisation. Firms
compete less aggressively, as the negative effect on competing firms’ profit is partly taken
into account through the common owners. A relatively new theoretical paper (Lopéz and
Vives, 2019) calls this the cartelisation effect of common ownership. In addition to these anti-
competitive results, the authors find that common ownership can also have a pro-competitive
effect. Depending on technological spillovers in a given industry, common ownership can spur
innovation by increasing the marginal benefit of innovation. They conclude that in markets
with high technological spillovers, firms internalize the spilled over decrease in competitors’
marginal costs caused by their own innovation through common ownership. Thus, this
increases the marginal benefit of innovation which leads to higher innovation levels and
possibly lower prices. An additional empirical finding by Gutiérrez and Philippon (2017)
shows that higher concentration and higher levels of common ownership tend to characterise
industries with less investment in capital and R&D (i.e. industries with lower technological
capacities). Also adding to the ambiguity, others find no significant effects or challenge the
methodologies used for identification of anti-competitive effects (Kennedy et al., 2017; Dennis
et al., 2017; O’Brien and Waehrer, 2017; Rock and Rubinfeld, 2017; Patel, 2017; Lambert
and Sykuta, 2018; Koch et al., 2021). More empirical research on the effects of common
ownership is required, as the theoretical predictions on competition are ambiguous.
    This article investigates the relationship of common ownership, markups, and innovation
   1
     E.g. the discussions of shareholders with U.S. shale-oil-and-gas producers with the intention of generat-
ing larger profits and reducing quantities (https://www.wsj.com/articles/wall-streets-fracking-frenzy-runs-
dry-as-profits-fail-to-materialize-1512577420, last accessed: 03.03.2021.). For a comprehensive overview, see
Shekita (2020).

                                                      3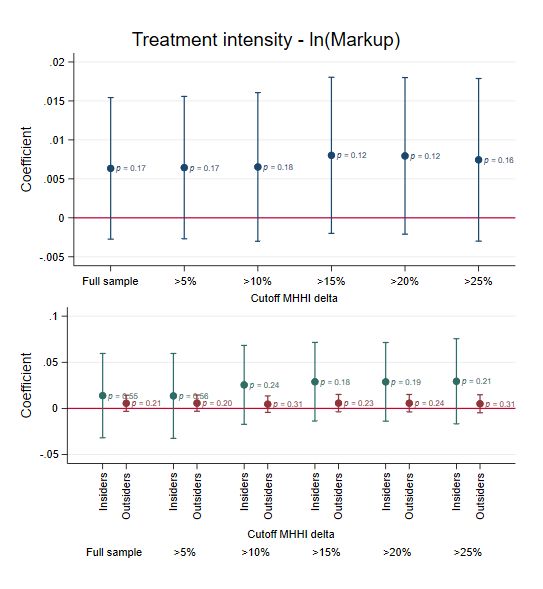
on a broad European manufacturing sample of large firms as categorised by the European
Commission between 2005 and 2016. Using data from Bureau van Dijk’s Amadeus database
and accounting for input endogeneity following Ackerberg et al. (2015), we estimate industry-
specific production functions and calculate markups as in De Loecker and Warzynski (2012).
Innovation activity by firms is measured by patents weighted with forward citations. Further-
more, we make use of the detailed ownership information available in Amadeus to construct
the modified Herfindahl-Hirschman Index (MHHI). The MHHI, an extension of the classical
HHI taking into account ownership links at the industry level, was proposed by Bresnahan
and Salop (1986) and is used in other empirical studies, for example Azar et al. (2018). We
exploit the MHHI as a measure of treatment intensity. We use the measure of technology
spillovers by Bloom et al. (2013) at the three-digit NACE industry level as well as an industry
classification of technological capacities by the European Commission (2019) to investigate
in more detail how the effect of common ownership on markups and innovation varies along
these dimensions, and to contribute to the further disambiguation of the effects of common
ownership.
   Commonly used approaches of exploiting institutional mergers (e.g. He and Huang, 2017;
Azar et al., 2018) and stock index inclusion of firms and rivals (e.g. Kennedy et al., 2017;
Boller and Scott Morton, 2020) are less appropriate here, as we observe only a small number
of firms listed in a stock index relative to the whole sample. Instead, we use a propensity
score reweighting estimator to control for biases due to observational characteristics. We
define a binary treatment indicator taking the value one in markets in which at least one
additional investment by an institutional investor creates common ownership links between
competitors for the first time. This constitutes the first occurrence of common ownership in
a given market. Control firms operate in markets that never experience common ownership.
We find a positive effect of common ownership on firm markups that is significantly increasing
with technological spillovers and ranges up to 6% in high spillover industries. The positive
effect of common ownership on markups becomes stronger with increasing treatment inten-

                                              4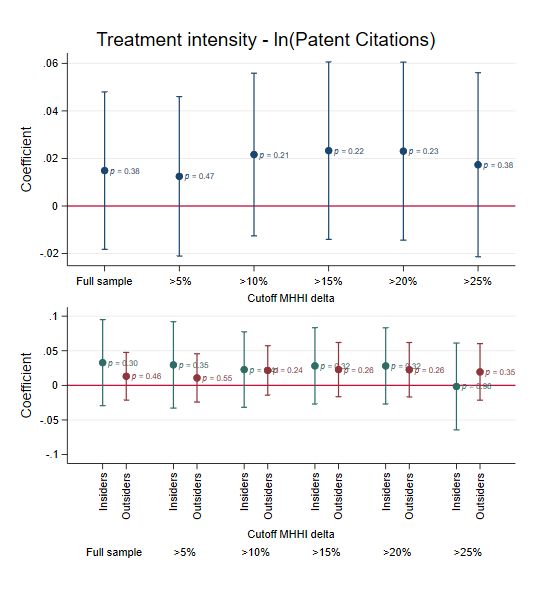
sity, measured as different percentiles of the distribution of MHHI delta. Splitting the sample
into four groups of increasing technological capacities (low, medium-low, medium-high, and
high technology) according to the European Commission (2019), we find pronounced effects
on markups in low-tech and high-tech industries. Regarding the previously discussed effect
of common ownership on innovation activity, the treatment has in fact a positive and statisti-
cally significant effect on citation-weighted patents in high spillover markets for inside firms,
which are firms directly held by common investors. For these firms the effect is increasing
in spillovers and ranges up to 13% in high spillover industries. By splitting up the sample
with respect to technological capacities as defined by the European Commission (2019), we
confirm the finding of a positive effect on inside firms that is increasing with technologi-
cal capacities. For outside firms, which are competing in the same market with commonly
owned firms, we find only insignificant results for innovation activity. Our results are robust
with respect to regression and production function specifications as well as to a one-to-one
propensity score matching approach combined with a difference-in-differences setup.
   Both findings for markups and innovation activity are consistent with theoretical find-
ings in Lopéz and Vives (2019). The authors define three regions according to the level of
technological spillovers, in which the influence of common ownership on prices and innova-
tion activity varies. The prediction of the effect on innovation for commonly owned firms is
clear, as it is globally increasing with technological spillovers. In the first region, consisting
of industries that exhibit a lower degree of spillovers, common ownership has a negative
or no effect on innovation activity and a positive effect on prices. In this area, we would
expect to find a positive effect on markups if the effect of common ownership on innovation
activity is rather small or zero, as the cartelisation effect leads to higher prices. This is
exactly what we observe in our empirical analysis. In the second area with intermediate and
large spillovers, Lopéz and Vives (2019) find a positive effect on prices and a positive effect
on innovation. Both effects raise firm markups, such that we would expect markups to be
increasing in technological spillovers. In the third area of very high spillovers, the effect on

                                                5
innovation is the largest for firms directly commonly owned, but the effect on markups may
be ambiguous as prices are falling with common ownership. However, as suggested by Lopéz
and Vives (2019), this area may be small or may not exist at all. Lopéz and Vives (2019)
do not consider a setup where commonly owned firms compete in a market with firms that
are not commonly owned.
    Our empirical analysis is related to a large and growing body of literature that recog-
nises the importance of ownership structures involving competing firms and institutional
investors2 . Although there are some empirical industry-specific studies that analyse anti-
competitive effects of common ownership on prices in the airline and banking industry (Azar
et al., 2018, 2016) and markups in the ready-to-eat cereal industry (Backus et al., 2021),
there is less work on a wider firm panel containing multiple industries. Backus et al. (2019)
perform a calibration exercise with initial markup estimates taken from De Loecker et al.
(2020), which are estimated on firms in the S&P500 index. In our analysis we abstract from
general equilibrium effects as in Azar and Vives (2020, 2021). In an unpublished manuscript,
Kini et al. (2019) investigate the effect of common ownership on product differentiation of
US listed companies. They also analyse firm markups and investment as outcome variables
and find no average effect on markups, but a positive effect in industries characterised by
high technological spillovers. For investments, they find an average positive effect that is
more pronounced in high-spillover industries. The results on investments are consistent with
our findings on innovation, but our results differ in terms of markups. Antón et al. (2018)
find positive correlations of common ownership in US firms with innovation activities and
R&D expenditures, which are amplified differently in settings of either technological or prod-
uct market spillovers. Kostovetsky and Manconi (2018) show increased intensity of patent
citations among firms owned by overlapping institutional investors.
    This article is substantially different from the existing literature and contributes in five
   2
     Apart from prices, markups, and innovation, researchers have also dealt with managerial incentives (An-
tón et al., 2021), market entry and exit (Newham et al., 2018; Xie and Gerakos, 2018) and horizontal mergers
(Antón et al., 2019) as reactions to common ownership structures in industries. Schmalz (2021); Elhauge
(2021) provide comprehensive overviews of the literature on competitive effects of common ownership.

                                                     6
main ways. First, we analyse a broad manufacturing sample in Europe that mostly consists
of non-listed firms, whereas almost the entire empirical literature on common ownership is
based on data sets of US listed firms and often focuses on specific industries. Non-listed firms
constitute around 95.5% of observation in our sample, and account for 85.7% of total deflated
sales over our sample period. Effects found in stock listed firms may not be representative
for the whole industry. Second, we shed some light on the effect of common ownership on
firms which are not directly commonly owned but which, in fact, compete in a market where
there are common ownership links between rivals. This aspect has been largely neglected
in the literature. Third, we offer a detailed analysis of industry characteristics regarding
technological capacities and spillovers that drive the results of common ownership. Fourth,
in direct comparison to Kini et al. (2019), this article focuses solely on citation weighted
patents as a more precise measure of innovation activity, as opposed to a wider range of
investments as an outcome variable, consisting of capital expenditures, R&D expenditures,
and acquisitions. This is advantageous, because innovation output is more important for
welfare than innovation input, and the theoretical foundation given in Lopéz and Vives
(2019) focuses on innovation spillovers only and may not be trivially extended to general
investments in capital. Fifth, on a broader scale, our article also contributes to the rising
market power discussion, as we find a pattern of rising markups in our sample. It is striking
that this trend cannot only be found in European public firms, but is also reflected in
European non-listed firms.
   Our findings are of considerable importance to competition authorities, as we show in
what kind of industries positive price effects and innovation spillovers of common ownership
are most likely to occur. Our findings can help competition authorities to fine tune possible
regulation approaches to overlapping ownership structures. The relevance of our results also
extends to mergers between banks, insurances and other institutional investors, where com-
mon ownership is created as a by-product of the merger. Our empirical results suggest that
in mergers between institutional investors, divestitures of portfolio firms may be necessary

                                               7
as a remedy to counteract anti-competitive price effects. On the other hand, the established
ownership links may be beneficial for innovation incentives.
The rest of this article proceeds as follows. Section 2 gives an overview of the data set and
markup estimation. The theoretical background of the common ownership measure as well
as the identification strategy is presented in Section 3. Results of the propensity reweighting
estimator follow in Section 4 and robustness checks are reported in Section 5. Section 6
discusses the results and draws conclusions for future investigations and applications.
2 Data and Markups
This section presents summary statistics of the data at hand in Subsection 2.1. The pro-
cedures for the estimation of the production function (according to Ackerberg et al., 2015)
and markups (adapted from De Loecker and Warzynski, 2012) are discussed in Subsection
2.2. In this context, we show how the average sales-weighted markup and the percentage of
markets with common ownership have developed over time.
2.1 Data Description
The Amadeus data base by Bureau van Dijk provides a rich firm-level panel of European
companies for our analyses. We rely on the standard definition of large firms by the European
Commission, restricting our sample to firms with more than 250 employees and over EUR 50
million in turnover on average. Large firms follow better reporting standards, which leads to
better data availability and quality, and institutional investors have a strong preference for
large firms, as shown in the literature (Ferreira and Matos, 2008; Dahlquist and Robertsson,
2001). Compared to small and medium enterprises (SMEs), more than twice as many large
firms have an institutional owner at some point in our sample, and the average firm revenue
weighted by institutionally owned shares of large firms is 32 times larger than of SMEs in the
data set. Small firms are likely to be non-strategic price-takers (Deneckere and Kovenock,
81992), which are targeted less by institutional investors. Assuming monitoring costs by
institutional investors, we would expect common ownership to be a more important factor
in large firms, as in larger firms the benefit of being active outweighs monitoring costs.
Amadeus is a comprehensive collection of financial data and information on corporate
structure of European companies which also covers non-listed firms, and is regularly updated.
This data set includes the observation period from 2005 to 2016, with a total of 7229 unique
firms, operating in the manufacturing sector. Markets are defined at the three-digit NACE
code and country level. Common ownership arises when any institutional investor holds any
equity share in two or more companies within the same market.
The ideal data set to analyse common ownership networks of firms would distinguish
between ownership and control shares, and report subsidiaries of institutional investors which
act in the common interest of a single ultimate owner. We assume proportionate control,
where the percentages held in equity are proportional to control rights. Global ultimate
ownership in this case is defined as the last legal entity owning over 50% of shares. The
ownership entries for manufacturing firms in Amadeus do not take into account ultimate
ownership of institutional shareholders. In order to acknowledge holding structures, different
subsidiaries of some of the largest investors are manually aggregated under the parent investor
name. Ownership stakes are consolidated at the corporation level as far as possible, relying
on names, the Amadeus data base and other external information. This is justified by the
finding that votes are cast on a mutual fund family level and not singularly for individual
affiliated funds (He et al., 2019).
Compared to other empirical studies, the lack of price information can be compensated
with recent markup estimation strategies using balance sheet data, although these cannot
yield perfectly accurate information on firms’ marginal cost or price setting behaviour. For
structural estimation of production functions, one would ideally like to have information on
firm-level quantities of output and input factors capital, labour, and materials. As quantities
are not widely available, it is common practice to use accounting data proxies. The data
9contain sales as a variable approximating output, tangible fixed assets for capital, material
expenses for physical materials, and the costs of employment for labour. All of these variables
are converted to constant 2010 Euros using a Eurostat dataset on annual producer price
indices per two-digit industry and country for the years 2005 to 20163 . It is advantageous
to have such a comprehensive, representative data set to conduct a large-scale study of
the manufacturing industry in Europe and it should be pointed out that no data set with
representative firm-level data across industries provides price data. As common ownership
has not been studied thoroughly within this geographical context, the data provide detailed
insights on ownership structures of a large number of firms with important players.
Table 1 reports summary statistics of the main variables used in the estimation procedure,
exhibiting a large dispersion of values for sales and input factors, all reported in million Euros.
Around 5% of large firms in our sample are publicly quoted, and 27% of observations have a
positive count of patents in a given year. The average number of patent citations is around
4.
Figure 1 shows the percentage of firms with common ownership per NACE two-digit
industry. In the graph, we distinguish between the industries in high, medium-high, medium-
low, and low-technology classes. The highest percentage of common ownership is found in
medium-high-technology industries.
3
Short term statistics, code sts_inpp_a, https://ec.europa.eu/eurostat/web/short-term-business-
statistics/data/database, last accessed: 20.06.2019.
10Table 1: Summary statistics, firm-level
Characteristics
Mean SD Min Max
Sales 373.84 1623.19 23.76 65657.08
Labour 52.54 195.34 0.90 13561.66
Materials 226.45 1179.97 2.60 53756.88
Capital 80.94 330.14 0.31 12063.22
Investment 13.06 66.31 0.00 4325.21
Wages 45.70 20.07 5.24 110.58
Age 35.47 33.39 0.00 731.00
Public 0.05 0.21 0.00 1.00
Innovating 0.27 0.44 0.00 1.00
Patent Citations 4.43 71.49 0.00 9938.00
Unique firms 7229
N 38566
Note: This table shows summary statistics of the sample at the firm-level. Financial information taken
from the Amadeus data base by Bureau van Dijk. Labour denotes costs of employees, materials the material
expenditures, and capital tangible fixed assets. Investment is calculated as the change of tangible fixed assets
between periods plus depreciation. Wages are calculated as the ratio of costs of employment over number
of employees. For some companies, information on employment is incomplete, for which then the two-digit
industry-country median wage is assumed. Sales, costs of employees, material expenditures, tangible fixed
assets, investment, and wages in million Euro, deflated by two-digit industry-country-year-specific producer
prices. Innovating is a dummy variable that takes the value of one if the firm has more than zero patents in
a specific year. Patent citations is the number of forward-citation weighted patents in a given year. Public
is a dummy variable that takes the value of one if the firm is publicly listed.
11Figure 1: Percentage of firms with common ownership, by two-digit industry
Note: The figure shows the percentage of manufacturing firms with common ownership by NACE two-digit
industry code. We use European ownership data from the Amadeus data base by Bureau van Dijk. Common
ownership in a market is defined as two competing firms being held by overlapping sets of institutional
investors.
2.2 Productivity and Markup Estimation
Productivity
Estimation of markups relies on preceding estimation of total factor productivity (TFP) using
the procedure proposed by Ackerberg et al. (2015). A Cobb-Douglas technology accounts
for substitutability of inputs and a logarithmic specification of this production function is
chosen for the estimation of output elasticities. The production function of firm j in year t
for output qjt is designed with the inputs capital kjt , labour ljt , materials mjt , unobserved
12productivity ωjt , and a measurement error jt , such that
qjt = β0 + βk kjt + βl ljt + βm mjt + ωjt + jt . (1)
In the first stage, predicted output corrects for measurement error without identifying any of
the input coefficients. Inverted material input demand is included in the production function.
The output prediction incorporates a third order polynomial in input factors labour, capital,
and materials, and country fixed effects.
Following the assumption of Hopenhayn and Rogerson (1993), and later Olley and Pakes
(1996); Levinsohn and Petrin (2003); Ackerberg et al. (2015), the serial correlation of pro-
ductivity is modelled as a controlled first order Markov process. The estimation also allows
for common ownership to impact future productivity in an endogenous process, such that it
is included in the law of motion of productivity
ωjt = g(ωjt−1 , MHHIdeltajt−1 , HHIjt−1 ) + ξjt (2)
where g(ωjt−1 , MHHIdeltajt−1 , HHIjt−1 ) is a flexible function of cubic lagged productivity,
the common ownership measure, and the HHI. ξjt is an exogenous productivity shock.
We estimate output elasticities for nine subsets of the manufacturing industry. We follow
Collard-Wexler and De Loecker (2020) and correct for measurement error in capital, using
lagged investment as an instrument for capital4 . Constructed with the innovation to produc-
tivity ξjt = ωjt − E[ωjt |ωjt−1 , MHHIdeltajt−1 , HHIjt−1 ] from the law of motion, the objective
function minimises the moment conditions
E [ξjt (ljt , mjt−1 , ijt−1 )] = 0.
4
For one subset of industries, we additionally include ijt−2 as an instrument for capital.
13The empirical analogue for these moment conditions is
Q(β) = (ξZ)0 (Z 0 Z)−1 (ξZ),
with ξ as a vector of productivity shocks ξjt and Z as a stacked matrix containing instruments
for the input factors (Collard-Wexler and De Loecker, 2016, 2020).
Markups
Markups are computed using the elasticity of output with respect to materials, following
De Loecker and Warzynski (2012). The respective input coefficient is related to the revenue
share of material expenditures, such that
βm
!
Pjt Qjt ∂Qjt (·) mjt
µjt = jt
m
= m
, (3)
αjt wjt mjt ∂mjt Qjt
where µjt is the markup of firm j at time t. In the data, the product of output prices and
quantities Pjt Qjt is given as sales, and the product of the price and quantities of materials
m
wjt mjt is given as material expenditures. The term in parentheses then becomes sales over
∂Qjt (·) mjt
material expenditures. The second term, ∂mjt Qjt
, denotes the elasticity of output with
respect to material inputs, obtained by the previous estimation of the production function
and the respective input coefficients.
An error correction is applied to deflated sales in the calculation of the revenue share of
the costs of materials, such that
m mjt
α̂jt = Pjt Qjt .
exp(ˆjt )
Markups are calculated for each firm from the estimated material elasticities, starting in
20065 . Following De Loecker and Eeckhout (2017), we weight the average markup by sales
share in the entire sample, and compare it on the right scale to the percentage of markets
affected by common ownership on the left scale in Figure 2. The graph is quite revealing
5
The year 2005 drops out, due to the lag specification in the estimation routine.
14Figure 2: Average markups and common ownership, full sample
Note: The figure illustrates the evolution of the average sales-weighted markup and the percentage of markets
with common ownership from 2005 to 2016. Markups are estimated using European accounting data from
the Amadeus data base by Bureau van Dijk and the method proposed by De Loecker and Warzynski (2012),
relying on production function elasticities from the Ackerberg et al. (2015) procedure. The percentage of
markets, in which common ownership links exist, is calculated per year and for the overall sample.
of a steady positive trend in markups. Common ownership concentration shows a similar,
increasing pattern in the full sample.
3 Empirical Strategy
This section presents a measure of common ownership, and the identification strategy em-
ployed to determine its effect on markups and patent citations. In Subsection 3.1, we in-
troduce the MHHI as a measure of common ownership. The propensity score reweighting
procedure following Guadalupe et al. (2012) is detailed in Subsection 3.2, including the
construction of propensity score weights and a discussion of reweighted regressions.
153.1 A Measure for Common Ownership
We introduce a frequently used measure for common ownership, the MHHI. The MHHI delta
reflects common ownership concentration in a market and is constructed as the difference
between the MHHI and the classical HHI (Salop and O’Brien, 2000), such that
P P
XX iβij βik X 2 X X i βij βik
MHHI = sj sk P 2 = sj + sj sk P 2
.
j k i βij j j k6=j i βij
| {z } | {z }
HHI MHHI delta
The first part of the equation is the classical HHI as sum of squared market shares
sj of all market participants j, and the second part, MHHI delta, captures the degree of
common ownership networks. Subscripts j and k denote firms and competitors, i indexes
the investors, and βij are ownership shares.6 Summing over all combinations of firms and
competitors in the industry, the individual profit weights in the fraction are weighted with
the product of market shares sj and sk of the firm and respective rival.
Corresponding to the market definition partitioning NACE three-digit industry codes
per country, the MHHI delta is calculated on a three-digit industry-country level to capture
possible competition of firms operating in more than one four-digit industry. Whereas other
articles exploit exogenous variation in the MHHI due to mergers at the investor level, we use
the MHHI as a measure for treatment intensity.
3.2 Identification Strategy
The investment strategies of asset managers are clearly not independent of the performance
or profitability of their potential portfolio firms. Institutional investors do not randomly
select competing firms in the same market to invest in. It seems plausible that they may
choose firms that have initially high markups, or that are more productive or innovative.
Determinants of the investment decision at the market level are also possible: firms may
invest in markets where they already hold shares in competing firms, or choose a market in
6
We assume proportionate control, such that ownership shares equal control shares.
16which larger investments by other institutional investors signal profitability.
Identification strategies need to account for these potential biases. We apply a propen-
sity score reweighting approach following Guadalupe et al. (2012) using weighted panel fixed
effects regressions. Fixed-effects models control for time-constant characteristics and iden-
tify the effects using only within-firm variation. The propensity score controls for selec-
tion on time-varying observed covariates, as the observables and treatment assignment are
independent conditional on the propensity score under the unconfoundedness assumption
(Rosenbaum and Rubin, 1983; Heckman et al., 1997).
Propensity score reweighting assigns weights corresponding to the inverse probability of
treatment to observations in order to construct a sample with a control group that can ap-
proximate the counterfactual outcome of the treatment group absent treatment (Hirano and
Imbens, 2001; Hirano et al., 2003; Imbens, 2004). In our application, firms in markets where
we observe new occurrences of common ownership links are considered to be in the treatment
group. For a clearly defined treatment group, we discard markets that always show com-
mon ownership and that only contain discontinuation of previous common ownership links,
and remove observations with periods of discontinuation and second emergence of common
ownership in a market. We also remove NACE two-digit industries and countries that never
experience common ownership. The average change in MHHI delta around treatment is 0.01
1
which constitutes 4
standard deviation of the total variation of the MHHI delta.
Propensity score reweighting encompasses a two-stage procedure: In a first stage, a pro-
bit model is estimated to determine the propensity towards exposure to treatment given the
observed covariates. Treatment probabilities are used to assign corresponding inverse prob-
ability weights to the observations. In the second stage, weighted least squares regressions
using the inverse probability weights are estimated to determine the average treatment effect
(ATE) (Hirano and Imbens, 2001; Imbens, 2004; Guadalupe et al., 2012).
We closely follow the identification strategy employed by Guadalupe et al. (2012). In
the first stage probit model, the outcome variable is one if the market experiences the
17first occurrence of common ownership in the following year, and zero otherwise. Only pre-
treatment covariates are used for the treated firms. The following firm-level variables are
used in the matching procedure to estimate the propensity score: the logarithm of markups,
the logarithm of TFP, firm age, number of patent citations, labour, capital, and output in
logarithms, and the share of institutional holdings. As treatment varies at the market-level
(defined by three-digit-industry code and country combinations), we also include market and
industry-level covariates HHI, technological spillovers and technological gap between firms.
A year trend is also included, following Guadalupe et al. (2012). Observations belonging
to treatment group and control group are pooled together, but two separate probit models
are estimated for firms in low-tech and high-tech industries to allow for the relationship to
vary across these categories. Table B.1 shows that the majority of covariates significantly
determine treatment when clustering standard errors at the firm level.
Following Hirano and Imbens (2001); Guadalupe et al. (2012), we calculate the propensity
score p̂ as the estimated treatment probability of new common ownership links in the market,
conditional on having no common ownership in the period before, from the probit regressions.
The propensity scores can be transformed into inverse probability weights. To obtain an
estimate of the ATE in the second stage weighted regressions, treated firms are assigned
weights of 1/p̂, and weights for the control observations are 1/(1 − p̂).
Following (Guadalupe et al., 2012), we only use observations that fulfil the common
support condition and sum over the firms to generate weights for control observations that
are used multiple times. Finally, weights are winsorised at the 99th percentile to account for
large outliers in the weights.
After reweighting the sample with propensity scores, treatment and control group should
not differ systematically in observables. We test the balancing condition for pre-treatment
variables on the full sample. Table 2 below reports the difference in pre-treatment means
for the treatment group and control group for the unweighted and the weighted sample after
demeaning at the year level. In the unweighted sample, there are substantial differences
18in firm and market characteristics. Reweighting observations with their inverse treatment
probability weights leads to an active correction, as this sample shows no significant difference
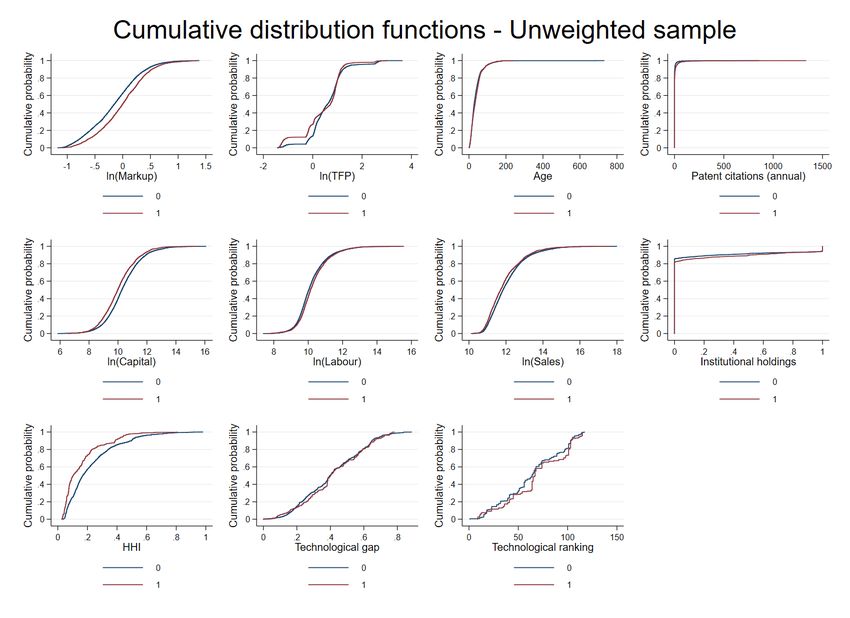
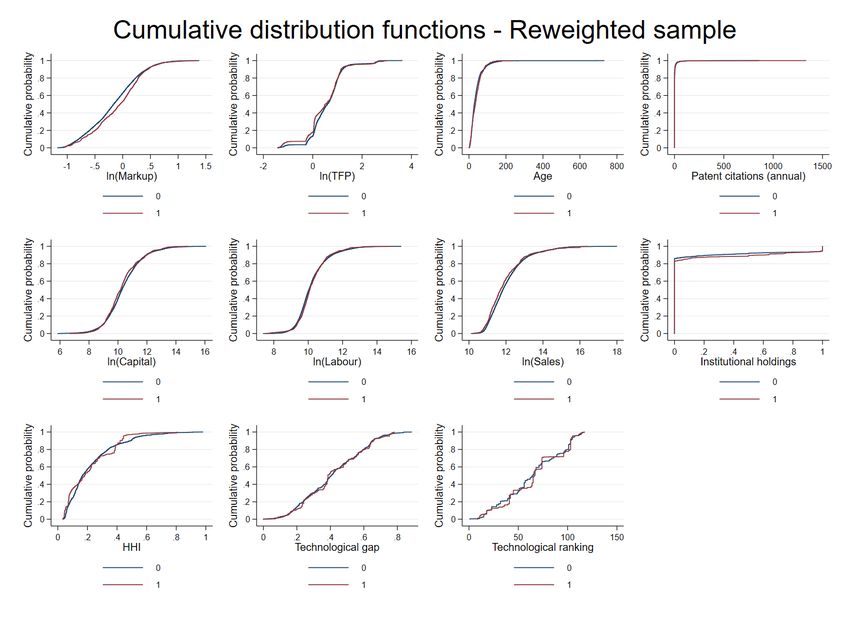
in means. Figures B.1, B.2 in the Appendix plot the empirical cumulative distribution
functions of the pre-treatment covariates in the unweighted and weighted sample for the
treatment group and control group. In the weighted sample, the distributions of the treated
firms lie very close to those of the control firms. Compared to the unweighted sample,
balancing is clearly improved.
Figure 3 shows yearly averages7 of markups and patents citations in logarithms. For the
treatment group, only pre-treatment observations are taken into account. The yearly means
for the treatment group follow a similar pattern as the control markets, not giving rise to
concerns of diverging pre-treatment trends.
Having obtained the propensity score weights, we estimate weighted fixed effects regres-
sions in the second stage to determine the effects of common ownership on the outcome
variables. The main specification with firm j’s logarithm of markups in market m8 and
period t as the outcome variable includes year and firm-fixed effects τt and νj , such that
ln(µ)jmt = β1 1[MHHI delta > 0]mt + β2 HHImt + β3 Instjt + τt + νj + jmt . (4)
1[MHHI delta > 0]mt is the common ownership treatment indicator variable, taking the
value of one for MHHI deltamt > 0, i.e. a market with common ownership, and zero for
a market without common ownership, where MHHI deltamt = 0. Firm-fixed effects rather
than market-specific or industry-specific fixed effects are included to control for unobserved
heterogeneity at the firm level, which might be correlated with the variable measuring com-
mon ownership. We therefore analyse only within-firm variation. In addition to the year
and firm-fixed effects, we control for the standard concentration measure HHI at the NACE
three-digit-country level and the shares held by institutional investors per firm. By including
7
Both variables are demeaned at the company level before averaging at a yearly level. For the logarithm
of patent citations, we additionally control for zero patent citations.
8
In the data, firms are only assigned to a single market, therefore ln(µ)jmt = ln(µ)jt .
19Table 2: Balancing property - unweighted and weighted sample
Balancing
Sample Unweighted Weighted
ln(Markup) 0.149** 0.076
(0.058) (0.096)
ln(TFP) -0.152 -0.076
(0.136) (0.147)
Age 1.635 1.469
(2.174) (2.681)
Patent citations 3.424** 0.181
(1.483) (0.993)
ln(Capital) -0.284*** -0.038
(0.104) (0.193)
ln(Labour) 0.107* 0.043
(0.059) (0.076)
ln(Sales) -0.123* -0.056
(0.065) (0.142)
Inst. Holdings 0.021** 0.023
(0.010) (0.020)
HHI -0.070*** -0.013
(0.025) (0.043)
Techn. gap 0.024 0.019
(0.027) (0.036)
Techn. ranking 4.746 1.513
(4.906) (6.022)
Note: Standard errors in parentheses and clustered at the market level. * pFigure 3: Pre-treatment averages of outcome variables
Note: The figures show yearly averages of markups and patent citations in logarithms. Markups are estimated
using European accounting data from the Amadeus data base by Bureau van Dijk and the method proposed
by De Loecker and Warzynski (2012), relying on production function elasticities from the Ackerberg et al.
(2015) procedure. Data on patent citations is obtained from the Amadeus patent data base by Bureau van
Dijk. Both variables are demeaned at the company level before averaging at the yearly level. For patent
citations, we also control for also zero citations. For the treatment group, only observations before treatment
are used. For the control group, the yearly averages contain all observations.
We incorporate an analysis of treatment intensity effects by estimating the model in
several subsets of the data. We always keep all control observations, but discard treated firms
with an MHHI delta below different percentiles of the distribution of non-zero MHHI delta.
21We first regard the full sample, and then only keep treated firms above the 5th , 10th , 15th , 20th
and above the 25th percentile of MHHI delta larger than zero. As an additional robustness
check on treatment intensity, we estimate a model on the full sample and include dummy
variables for different values of MHHI delta in the regression, indicating observations below
15% of the distribution of positive MHHI delta, between 15 and 25%, and above 25%.
Our second outcome variable is innovation output measured by citation-weighted patents.
We follow Hausman et al. (1984) by replacing zero patent citations with unity before taking
the logarithm and consequently adding a dummy variable indicating zero citations in the
regression. The regression specification for patent citations as the outcome variable is richer
than for markups, as additional control variables Xjmt are introduced. The firm-level covari-
ates included are the logarithm of TFP, capital intensity measured as the ratio of capital to
labour, firm age, and the indicator of zero citations. As market-level control variables, we
also include market size measured by average market sales, and as an additional measure for
competition, 1 − Lerner at the market level. For innovation output, we estimate the model
ln(cites)jmt = β1 1[MHHI delta > 0]mt + β2 HHImt + β3 Instjt + Xjmt + τt + νj + jmt . (5)
We repeat the exercise using the same subsets and indicator variables as before to account
for treatment intensity along different values of the distribution of non-zero MHHI delta.
4 Empirical Results
The empirical results relying on the propensity score reweighting method by Guadalupe et
al. (2012) are reported in this section. Subsection 4.1 presents the results of the reweighting
estimator, where we test whether upon emergence of new common ownership links in the
market, firms set higher markups, and engage in more innovation activity. We account for
treatment intensity and show average direct and indirect effects of common ownership. In
Subsection 4.2, we explore the interaction of the effect of common ownership with the level
22of technological spillovers in an industry, and analyse further heterogeneity with respect to
technological capacities of specific industries.
4.1 Treatment Intensity
Markups
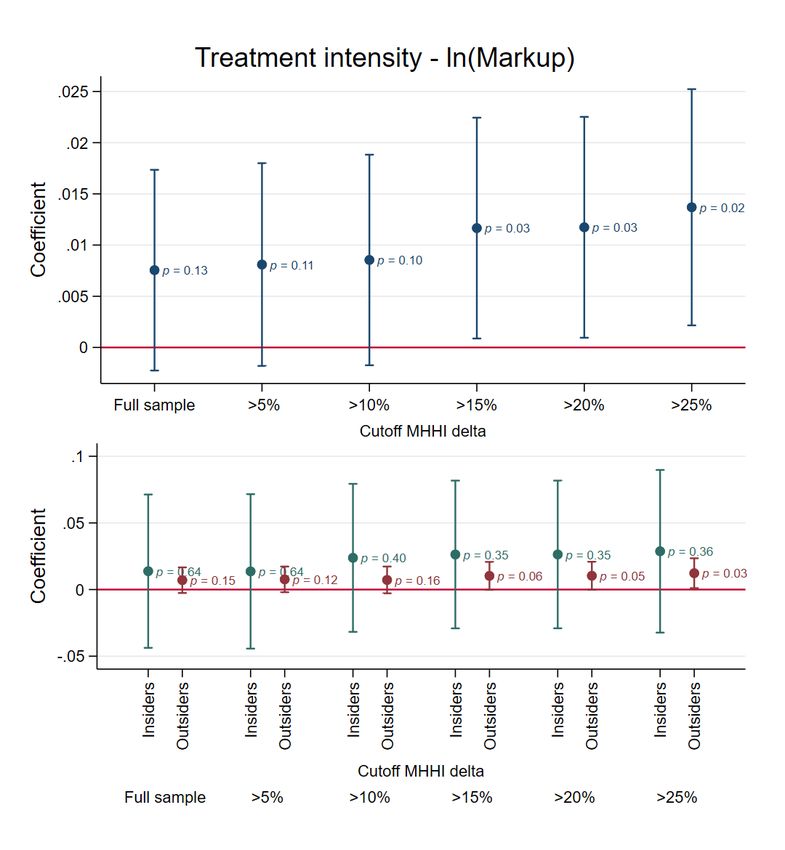
Turning to markups first, Figure 4 shows the effect of the treatment indicator for new com-
mon ownership links in the market, as estimated from firm-level propensity score reweighted
regressions of the logarithm of markups on the common ownership treatment dummy. Ob-
servations are assigned weights according to their treatment group status as described in
Subsection 3.2. To examine how the effect changes with increasing treatment intensity, the
different coefficients are estimated in subsamples where we keep control observations with
MHHI delta equal to 0 and treated observations with positive MHHI delta above the indi-
cated percentile of the distribution of MHHI delta. In all subsets, we control for HHI at
the three-digit industry country level, share of institutional holdings, firm and year-fixed
effects. By including firm fixed effects, we account for selection based on time-invariant firm
idiosyncrasies. Standard errors are clustered at the three-digit industry-country level. The
positive average treatment effect is increasing in treatment intensity and becomes statisti-
cally significant when discarding the lower 15% of the distribution of positive MHHI delta.
The effect size implies a 0.8 to 1.4% increase in markups after a market’s first exposure to
common ownership.
As we define treated firms as all firms operating in a market that is first exposed to
common ownership, we would expect different responses of firms directly and only indirectly
affected by common ownership. We define directly affected firms, or insiders, as competitors
in the same market which are held by overlapping sets of institutional investors in the same
period, resulting in a common ownership link between these firms. Indirectly affected firms,
or outsiders, operate in the same market as these jointly held firms, but do not have any
common owners and are therefore not directly linked to another rival firm. One would
23expect that the direct effect of common ownership on markups is more pronounced than the
indirect effect. We interact the treatment effect with two dummies indicating the insider
and outsider status in the different subsamples as before, and find that the positive effect
of treatment on log markups differs in strength between inside and outside firms, and also
increases with treatment intensity. In all subsamples, the direct effect for inside firms is
always larger than the indirect effect for the competing firms, and ranges from 1.4 to 2.9%.
The effect for outside firms lies between 0.7 and 1.2%. Table B.2 and B.3 in the Appendix
show the corresponding weighted least squares regression results.
In addition to estimating the treatment effect for different percentiles of the MHHI distri-
bution, we estimate a model on the full sample including dummy variables for MHHI delta
below 15%, between 15% and 25%, and above 25% of the distribution of positive MHHI
delta. Table B.6 shows the result of this regression of the logarithm of markups including
additional time-heterogeneous country and three-digit NACE industry fixed effects. The
average treatment effect is increasing in in treatment intensity as measured by the percentile
indicator variables. For a small MHHI delta below the 15th percentile the effect is negative,
but becomes statistically significant and amounts to around 1.4% increase in markups for
MHHI delta above the 25th percentile.
Innovation
We are interested in whether also the innovation output of the firms changes with com-
mon ownership. The same propensity score reweighting procedure is performed using a
linear count data model with the logarithm of patent citations as the outcome variable.
Propensity score weights are assigned as in Subsection 3.2. Pooling directly held firms and
indirectly affected competitors together, the treatment effect is not statistically significant.
Distinguishing between inside and outside firms in Figure 5 reveals that the first occurrence
of common ownership only affects the innovation output of directly commonly held firms.
The average treatment effect on inside firms is positive in all subsamples, and remains stable
24Figure 4: Reweighting estimator: Coefficients of treatment indicator by cutoffs, ln(Markup)
Note: The graph plots the estimated coefficients of the treatment indicator and respective confidence intervals
and p-values. The different coefficients are estimated in subsamples where we keep control observations with
MHHI delta equal to 0 and treated observations with positive MHHI delta above the indicated percentile of
the distribution of MHHI delta. Treatment is defined as the first occurrence of common ownership, i.e. a
non-zero MHHI delta. Insiders are defined as directly commonly owned firms. Outsiders are non-commonly
owned competitors in the same market. We control for HHI at the three-digit industry country level, share
of institutional holdings, firm and year-fixed effects and cluster standard errors at the three-digit industry-
country level. The red line indicates zero.
25with increasing treatment intensity. The magnitude of the effect for insiders ranges between
2.7 to 5.0%. Coefficients of the outside firms are first slightly negative, then slightly positive
and insignificant. The corresponding regression results are reported in Tables B.4 and B.5.
For innovation we perform the same exercise as for markups and estimate a model on
the full sample containing dummy variables for MHHI delta below 15%, between 15% and
25%, and above 25% of the distribution of positive MHHI delta. In Table B.7, we show
the effects on innovation output accounting for different time-heterogeneous fixed effects.
Here, the largest positive and highly statistically significant average effect is found in firms
with MHHI delta between the 15th and 25th percentile, implying an average increase of 8.8%
percent in patent citations.
4.2 Heterogeneous Effects
This section further explores the driving factors of the effects of common ownership on
markups and innovation activity. Following Lopéz and Vives (2019), technological market
characteristics play a major role in determining the effects of common ownership on strategic
variables. First, we briefly discuss the main model by Lopéz and Vives (2019). Second, the
results regarding the effects of common ownership for varying levels of technological spillovers
are presented. Third, the results of splitting the sample according to different technological
capacities are shown.
Theoretical Background
A very recent article by Lopéz and Vives (2019) presents an integrated theoretical frame-
work to analyse competitive effects of common ownership. Their main model is a symmetric
Cournot oligopoly with a symmetric overlapping ownership structure. Firms have two strate-
gic variables: output and marginal cost-reducing research and development (R&D) spend-
ing. Innovation of a given firm spills over to a certain degree to other firms operating in
the same market. The authors characterise an equilibrium under some regularity conditions
26Figure 5: Reweighting estimator: Coefficients of treatment indicator by cutoffs, ln(Patent
Citations)
Note: The graph plots the estimated coefficients of the treatment indicator and respective confidence intervals
and p-values. The different coefficients are estimated in subsamples where we keep control observations with
MHHI delta equal to 0 and treated observations with positive MHHI delta above the indicated percentile of
the distribution of MHHI delta. Treatment is defined as the first occurrence of common ownership, i.e. a
non-zero MHHI delta. Insiders are defined as directly commonly owned firms. Outsiders are non-commonly
owned competitors in the same market. We control for HHI at the three-digit industry country level, share
of institutional holdings, a dummy for zero citations, firm and year-fixed effects and cluster standard errors
at the three-digit industry-country level. Zero patent citations are set to one. The red line indicates zero.
27and perform a comparative static exercise regarding how equilibrium output and innovation
activity is impacted by an increase in common ownership for varying degrees of technological
spillovers. They find three different regions along the spillover dimension, characterised by
low, intermediate and high spillovers.
The mechanism described by Lopéz and Vives (2019) shows how an increase in common
ownership impacts innovation through two distinct channels. Possible internalisation of
R&D efforts in the presence of spillovers increases the incentives to innovate. The strength
of this positive incentive depends on the degree of spillovers. The second channel is rather
indirect. The cartelisation effect has a negative effect on output, which in turn leads to lower
marginal incentives to innovate as now the overall gain of innovation is lower with fewer units
of output.
In the first region, categorised by low-spillover markets, common ownership has a negative
effect on output, thus a positive effect on prices, and a negative or no effect on innovation.
The non-positive impact on innovation in this region stems from the low spillovers that lead
to relatively small internalisation effects of common ownership on innovation, such that the
negative impact of the reduced output on innovation outweighs the positive effects due to
internalisation. In this region, we would expect to find a positive effect on firm markups if
innovation is not impacted by common ownership.
For increasing spillovers in the second region, we would expect to find an increasing effect
on markups, because in the adjacent region with higher spillovers the effect of common
ownership on output is still negative, and thus positive on prices, and also positive on
equilibrium innovation, such that marginal costs are decreasing in common ownership. Here,
the spillovers are sufficiently large for the positive internalisation effects of common ownership
on innovation to outweigh the reduced incentives to innovate due to lower output.
In the third region, characterised by very high spillovers, common ownership has a positive
effect on output and innovation, thus the effect on markups is ambiguous. Here, the positive
spillover effect on innovation is expected to be the largest, such that the increased incentives
28to innovate let marginal costs decrease, even resulting in increased output. However, this
region is not guaranteed to exist by the assumptions of the model by Lopéz and Vives (2019).
One aspect that is not addressed in the article by Lopéz and Vives (2019) is how the
effect of common ownership changes in the presence of firms that are not directly commonly
owned, but that compete with commonly owned firms in the same market. The authors only
consider a symmetric setup where all firms are commonly owned. Regarding price changes
of insiders and outsiders due to the cartelisation effect, neglecting innovation, one would
expect the effects to go in the same direction. However, the impact of common ownership
on the innovation activity of outside firms in this context is unclear. To the best of our
knowledge, there is no theoretical or empirical work that analyses this aspect in terms of
common ownership specifically. There are also only relatively few articles in the literature
on mergers and acquisitions that focus on rivals’ responses to mergers in terms of innovation
activity. Theoretical predictions for rivals are ambiguous in this regard (Haucap et al., 2019).
Technological Spillovers
This section now turns to the empirical evidence on how the effects of common ownership on
markups and innovation vary with different degrees of technological spillovers. We interact
the treatment variable with a three-digit industry-level, pre-sample measure of technological
spillovers by Bloom et al. (2013)9 and perform sample splits. Figures 6a and 6b display the
treatment effect along the spillover dimension on markups and innovation, respectively10 .
Each graph contains, from top to bottom, effects for insiders and outsiders combined, for
insiders only, and effects for outsiders only. The shaded area in each graph shows a 95%
9
Bloom et al. (2013) rely on a firm’s position in technology space, which is measured by the patenting
distribution across an international classification of technology fields, and serves to determine the distance
of rivals in terms of technological advances. The proximity between firms is used to weight respective R&D
stocks, as firms closer to one another have a higher chance to profit from each other’s R&D expenditures
(Bloom et al., 2013). Their firm-level measure of technological spillovers is therefore the sum of the firm’s
competitors’ R&D stock (in million USD) weighted with the pairwise degree of overlap in technology. We
use the pre-sample average of the R&D stocks that spill over within an industry.
10
The treatment effect from the first columns in tables B.8 and B.9 is plotted for markups and innovation,
respectively. The first columns in both tables interact the treatment effect with spillovers.
29confidence interval. For markups, we see that the effect of common ownership is increasing
in the degree of spillovers for insiders and outsiders. The effect only becomes statistically
significant for all treated firms combined and for outsiders. The combined effect ranges up
to roughly 6% in high-spillover industries. A one standard deviation increase in spillovers
increases markups by 1.5%. The effect for insiders, although insignificant, is larger and
reaches a magnitude of up to 12% in high-spillover industries. For innovation, we find an
increasing effect in the degree of spillovers for firms that are directly commonly owned, which
is statistically significant for medium-high and high-spillover industries. For insiders a one
standard deviation increase in spillovers increases patent citations by 2.1%. The effect for
outsiders is decreasing in spillovers, such that it is positive for lower levels of spillovers and
becomes negative for high spillovers.
We also perform sample splits with respect to spillovers in columns 2 to 5 of Tables
B.8 and B.9 for markups and innovation, respectively. Columns 2 in both tables show the
effects for the lower 25th percentile of spillovers. Columns 3 and 4 show the effects for
observations below and above the median value of technological spillovers. Columns 5 in
both tables show the effects for the upper 25th percentile. The results of the sample splits
are consistent with the interaction results shown in Figures 6a and 6b. In the sample splits,
we see that the effect on markups is increasing with the levels of spillovers and reaches
up to 3.4% for observations above the 75th percentile of the spillover distribution. For the
innovation activity of inside firms, we also see an increase of the effects with the degree of
spillovers, where observations above the 75th percentile experience an increase of 9.5% in
patent citations. However, compared to the interaction models, the sample splits provide
additional information with respect to the effect in low-spillover industries, where we see
a positive effect on markups in column 2 of Table B.8. According to Lopéz and Vives
(2019), we would expect a positive effect on markups in this region if there are non-negative
effects of common ownership on innovation. Column 2 of Table B.9 shows that for insiders
and outsiders, there is a positive insignificant effect of common ownership on innovation.
30You can also read