Risk Based Capital (RBC) - for an Illinois Based Insurance Company May 11, 2018 - Illinois Math
←
→
Page content transcription
If your browser does not render page correctly, please read the page content below
Risk Based Capital (RBC)

for an Illinois Based Insurance Company

 May 11, 2018

 Undergraduate Researchers:

 Dong Shin (Bill) Seol, Qinxue Liu,

 Chuyi Ma, Kexin Liu

 Faculty Mentor: Klara Buysse

 University of Illinois at Urbana-Champaign
1

Table of Contents

Introduction to RBC System 2

Risk Based Capital Ratio 5

Required Risk Based Capital 6

 C-1 Asset Risk 7

 C-2 Insurance Risk 12

 C-3. Interest Rate Risk 13

 C-4. Business Risk 17

Examples: Allstate Cooperation 20

Calculation of An Illinois-Based Company 21

Reference 23
2

Introduction to RBC System

 In the 1980s, hundreds of insurance industries went into insolvencies in North America.

Policyholders, insurance companies’ employees, creditors and shareholders of companies, and

the general public suffered from this insurance crisis. Economists and actuaries saw the

weakness in the fixed capital standards from this crisis, and decided to improve it. The fixed

capital standards required companies to hold minimum amount of capital which equals to a fixed

percentage (4.5 percent for U.S. banks before the debt crisis) of their assets, regardless of risks

these companies took in business. RBC standard, created by National Association of Insurance

Commissioners (NAIC), was therefore adopted in 1990s. It measures the minimum amount of

capital a company must hold based on its level of risk. RBC standards make sure financial

institutions keep sufficient amount of capital on hand to support their operations and write

coverage, and therefore protect shareholders, investors and clients of firms.

 Insurance companies use RBC formula to determine the minimum capital they are

required to hold to avoid regulator’s intervention. The major risk factors RBC formula focus on

are asset risk, underwriting risk, and other risks. The asset risk refers to the potential loss of

investments on financial assets, such as lower investment performance in stock market relative to

company’s expectation. The underwriting risk refers to the risk that arises from insurance

companies’ faulty underwriting, such as inaccurate assessments of an insurance policy. Other

risks include everything else, such as interest rate risk, which refers to the potential loss of a

debtor’s default on its financial obligations, requiring the insurance company to make the

required payments.
3

 Different types of insurance have different kind of risk factors, due to the specificities of

these insurance businesses. NAIC developed distinct RBC models for four major insurance

types: Life, Property/Casualty (P&C), Health, and Fraternal.

 Regulators use RBC standards to determine their intervention level on companies. There

are four levels of regulatory action according to the RBC formula:

 - company action,

 - regulatory action,

 - authorized control and

 - mandatory control levels.

 If the company meets the RBC standard, NAIC regulators take no action; if not, the

greater capital deficiency this company has, the higher control level NAIC regulators will take

on company. In this way, regulators ensure companies have adequate financial solvency under

RBC system.

 The levels of regulatory action triggered by the RBC ratio are as follows: NAIC only

takes regulatory action when the ratio becomes less than 250%. If a company’s RBC ratio is

between 250% and 200%, and also fails the trend test (which measures past RBC ratio changes

of the company), Company Action Level is triggered. If the ratio is between 200% and 150%,

the company also triggers Company Action Level, and is required to submit a RBC plan to

improve its RBC ratio into compliance. If the ratio is between 150% and 100%, the company

triggers Regulatory Action Level, and is required to submit a corrective action plan. NAIC will

perform examination or take regulatory action if the commissioner believe it is necessary. If the

ratio is between 100% and 70%, the company triggers Authorized Control Level, and NAIC is

authorized to take regulatory actions, such as rehabilitating or liquidating the insurer. If the ratio
4

is below 70%, the company triggers Mandatory Control Level, and NAIC is authorized to take

regulatory control, including placing the insurer under regulatory supervision.

 In our research project, we look at the basic concepts of the Risk-Based Capital (RBC)

system, investigate RBC regulations, and look into discussions on how to improve companies’

RBC levels. We will then use the knowledge to determine the RBC ratio for a small life

insurance company. The insurance products of this company will be backed by bonds and

equities. This report will show our research progress on RBC system, including our knowledge

on RBC regime, understanding of RBC formulas, and how we put this regulation into practice

with an example.
5

Risk Based Capital Ratio

RBC ratio is calculated by dividing the total adjusted capital of the company by required Risk Based

Capital.

 =

 Total Adjusted Capital (TAC) is the sum of un-invested surplus, Asset Valuation Reserve

which is a liability found in annual statement that is created to buffer for losses1 (Equity and

credit losses), and 50% of the insurer’s dividend liabilities.2 It can be seen as the “total” capital

of the company. For example, a company with a 200% RBC ratio has capital equal to twice its

risk based capital.

 In the following sections, we will go into more detail about the Required Risk Based

Capital.

1
 https://www.actuary.org/files/RBC_AVR_Presentation_to_NAIC_IRBCWG_12-5-13.pdf
2
 https://www.actuary.org/files/Regulatory_Capital_Requirements_US_Life_Insurers_6-17-14.pdf
6

Required Risk Based Capital

 Required Risk Based Capital is intended to calculate the minimum amount of capital an

insurance company should hold in order to not trigger regulatory action, meaning that the

insurance company is solvent enough to do their regular insurance business.

 The capital an insurance company should hold differs from the risks it is taken in its

insurance and investment operations. For example, a company that is investing in risky assets

will probably have to hold more capital than a company that is investing in government bonds.

RBC split the risks a company can take in four major classes for life insurers:

 - C-1 Asset risk,

 - C-2 Insurance risk,

 - C-3 Interest rate risk and

 - C-4 Business risk.

 The Required Risk Based Capital can then be obtained through the formula:

 ( 4 + √( 1 + 3)2 + 22 )3

where C-1, C-2, C-3 and C-4 stands for the risk-based capital under that category. Note that this

formula calculates the required Risk Based Capital at Company Action level, that is, when Risk

Based Capital is twice of Total adjusted Capital.

 As one can see in the formula, the risks are adjusted for covariance. This is done in order

to take into account the fact that all the four risks categories will not occur at the same time.

 In the following sections we will give an overview of the calculation of risk based capital

for each risk.

3
 https://math.illinoisstate.edu/krzysio/MAT483/RBC.pdf
7

C-1 Asset Risk

 C-1 Asset Risk measures the risk of default (of bonds and mortgage) or decrease in the

value of the assets (stocks) insurers hold in their investing portfolio. RBC for Asset risk is

calculated by multiplying different risk factors with different types of investments, including

bonds, stocks, mortgages, real estate, and other long term assets and summing up the terms.

Certain types of assets will need an adjustment based on the size of portfolio.

 Let’s start with bonds. US government bonds have a risk factor of 0. C-1 risk only

measure the default risk of bonds, and the likelihood of default of a government bond is nearly

zero, because the government may fall behind the repayment of the bonds only if the nation is

under severe financial deficit. Corporate issued bonds are classified into six SVO levels, and risk

factors are related to the rating of the bonds. To classify the bonds into the different classes, one

can obtain the ratings from Standard and. The following table shows the conversion and risk

factors of bonds with different ratings.4

 S&P ratings SVO ratings Risk factor

 AAA, AA+, AA-, A+, A, A- Class 1 0.004

 BBB+, BBB, BBB- Class 2 0.0096

 BB+, BB, BB- Class 3 0.039

 B+, B, B- Class 4 0.0738

 CCC+, CCC, CCC- Class 5 0.1696

 CC, C, D Class 6 0.1950

4
 http://www.naic.org/documents/svo_naic_aro.pdf
8

 Another consideration to calculate the risks for bonds is diversification. A well-

diversified portfolio with a large number of different issuer of bonds is considered less risky than

a portfolio with fewer bond issuers. The adjustment factors are shown in the table below.

 Number of issuers factor

 First 50 2.5

 Next 50 1.3

 Next 300 1.0

 Above 400 0.9

Let’s illustrate the calculation of C-1 Asset risk for bonds by means of an example. Assume an

investment portfolio with $1,000 of 30 years US government bonds, $1,000 of Bank of America

Bonds with S&P rating of A, $1,000 of Rogers Communications Inc. bonds with S&P rating of

BBB+. The total number of bond issuers here is 3.

 Pre-adjusted risk = $1,000 * 0 + $1,000 *0.004 + $1,000 *0.0096 = $13.6

 Adjustment: $13.6 * 2.5 = $34

 C-1 bonds risk capital = $34

This means the insurer who invested in the above bonds will need at least $34 in equity to stay at

non action level according to NAIC regulation on RBC.

 NAIC has proposed changes to the calculation of C-1 Asset risk for fixed income

investments since 2015, by expanding the existing 6 NAIC classes to 20. That is, every ratings

from Standard and Poor’s will get a different risk factor from NAIC. For example, the original

NAIC class 1 bonds contains Standard and Poor’s rating from AAA to A-, all getting a risk

factor of 0.003. Under the new proposal, an S&P rating of AAA is equivalent to NAIC rating of
9

1-A, with a risk factor of 0.0021. An S&P AA- bond will be classified as NAIC 1-D bond, and

the risk factor is 0.0057.5

 A reason for proposal of the new “granular” is that insurers has the incentive to invest in

higher return bonds rather than the higher rating ones.6 An investment of AAA bonds requires

the same risk based capital as investing in A- bonds, while A- bonds has higher return rates as

well as higher default risks. The current NAIC classification does not reflect such differences,

and the required risk based capital can be insufficient for the insurers to stay solvent. The

proposal can better eliminate the probability of insolvency by pressurize insurers to redesign

their investment portfolios, optimizing the return and minimizing the risks on the investments.

 Mortgage is another common type of investment. There are many types of mortgage

products available in the market: farm mortgages, insured guaranteed mortgages, resident

mortgages, commercial mortgages, etc. These mortgages contain different default risk, because

part of them are guaranteed or insurance, while others don’t. Those with insurance are assigned

with lower risk factor because the risk of default on such investment is lower than the others.

Mortgages in good standing has lower risk factors than the ones are 90 days overdue, since the

past-due mortgage has a higher risk of default. The adjustment factors of mortgages are based on

the size of the portfolio and the yearly experience of insurer dealing with mortgage assets. Any

insurers with less than five years of experience will use 1.0 as the adjustment factor. In this

research paper we will not go into detail about the specific risk factors in mortgage assets We

assume that the small insurance company only invests in bonds and equities.

5
 https://www.neamgroup.com/insights/proposed-naic-rbc-c1-factors-for-life-insurers
6
 http://www.naic.org/insurance_summit/documents/insurance_summit_160517_financial_risk_based_
capital_update.pdf
10

 Asset risk measures the risk of decrement in value for stocks. Stocks are divided into two

subcategories: affiliated and unaffiliated. For affiliated stock, RBC is calculated by the

percentage of the parent company’s ownership in the subsidiary multiplied by the subsidiary’s

Company Action Level RBC. For example, if company A owns 100% of company B, RBC of

affiliated stock of company A is 100% of the Company Action Level RBC of company B. For

common stocks issued by unaffiliated companies, the risk factor is 0.3 for all. For preferred

stocks of unaffiliated companies, risk factors are again associated with ratings of the preferred

stocks7:

 S&P ratings NAIC class factor

 AAA, AA+, AA-, A+, A, A- 1 0.023

 BBB+, BBB, BBB- 2 0.03

 BB+, BB, BB- 3 0.06

 B+, B, B- 4 0.11

 CCC 5 0.22

 CC, C, D 6 0.30

 Here is an example of the calculation of the Risk Based Capital for stocks:

 Assume we have $1,000 of Accenture common stocks and $1,000 of US Bancorp

preferred stock with a S&P rating of BBB+. Then we need the following capital:

 C-1 stock risk capital = $1,000 * 0.3 + $1,000 * 0.03 = $330

7
 http://www.naic.org/documents/svo_naic_aro.pdf
11

 A risk factor of 0.1 is set for real estate investments. Cash and short term investments

have a risk factor of 0.003. Premium notes, collateral loans and write-in have a risk factor of

0.05.

 A final concentration factor will be applied on the investment before summing up

required capitals for each assets categories. Concentration factor is a penalize on highly

centralization on few assets. To apply the concentration, the insurer find 10 largest single

investments in the portfolio, and double the risk factors associated with the assets to obtain the

new required risk capital. There are two exclusions when working with the concentration factors:

the assets with small risk factors are not considered when finding the 10 largest assets, and the

assets with risk factors bigger than 0.3 are not included in 10 largest assets investments. The

constraint on concentration factor calculation is 0.3, that is, no single assets should end up having

a risk factor higher than 0.3. For example, if an assets has a risk factor of 0.2, the post-adjusted

risk factor will become 0.3 instead of 0.4.

 In our previous investment example, the concentration factor will be applied on the NAIC

class 2 preferred stock and common stock only because 30-year U.S. government bond, NAIC

class 1 bond and NAIC class 2 bond all have risk factors smaller than 0.01, which is considered

as small for concentration factor adjustments. Therefore, the concentration factor effect on this

$5,000 investment portfolio is:

 $1,000 * 0.3 + $1,000 * 0.03 = $330

 Summing up the examples, the insurer with a portfolio that consists out of a US

government bond, two corporate bonds, one common stock and one preferred stock has a RBC

under C-1 category of $34 + $330 + $330= $694. To stay at Non Action level, the insurer needs

at least $694 in equity.
12

C-2 Insurance Risk

 Insurance risk is the risk associated with the mispricing of the products. As the number of

policies written increases, the risk factor will decrease: the risk of loss is diversified. Insurance

risk captures the probability of mispricing, underestimation of expenses, overestimation of

interest rate and investment income, incorrect choice of mortality and morbidity, occurrence of

catastrophe and contagion. These risks are unavoidable for all insurance industry. Risk Based

Capital for this category can be calculated by a risk factor multiplied by net amount at risk. The

net amount of risk is the difference between a claim amount payable if a specific event occurs

and the amount set aside to support the claim8.

 NAIC uses computer simulation to come up with the risk factors for different size of

policy written. Portfolios with 10,000, 100,000 and 1 million are generated with selected death

rate and expected lapse rate, and the variations of the actual death rate and selected mortality

table are detected, which is the error of prediction made by insurers. Risk factors are derived

from the variation caught by the stimulation. The risk factors for ordinary life insurances are:

 Net amount at risk factor

 First $500 million 0.0023

 Next $4500 million 0.0015

 Next $20000 million 0.0012

 Next $25000 million 0.0009

 and above

8
 http://rmtf.soa.org/net_amount.pdf
13

 As an example, we created a whole life insurance policy that has a death benefit of

$20,000 payable at the end of the month, and a fixed premium of $200 at the beginning of each

month. Our example was calculated based on a person aged 35 at time = 0, with a guaranteed

interest rate of 3%. At time = 0, considering that the net reserve is the premium received at time

= 0 for simplification, the Net Amount at Risk (NAR) is calculated to be $20,000 - $200 =

$19,800.00. The RBC in this case would be $19,800.00 * 0.0023 = $45.54. When there are more

insurance issued, risk factor of less value will be applied to the excess of the first $500 million.

For example, with 30,000 insurance issued, the total NAR at time 0 will be equal to $19,800 *

30,000 = $594 million. The RBC in this case is $500 million * 0.0023 + $94 million * 0.0015 =

$1,291,000.

C-3. Interest Rate Risk

 Interest Rate Risk is basically the risk caused by the possible changes in interest rate

levels during the investment period. This can result in an insurer earning fewer returns than

expectation on its investments and thus cannot pay the policyholder. In this situation, interest

obligations under various insurance and annuity contracts cannot be met and disintermediation

will spur: if interest rates go up, more people will surrender their contract which is not good for

the insurance company because they will have less business and thus less profit; on the contrary,

if interest rates go down, less people will surrender their contract which is not good either

because the insurance company have to pay the policyholder, but doesn’t receive a lot of return

from the market.

 This risk depends heavily on how closely the assets and liabilities are matched in time.

For example, if the cash inflows from assets (maturity values are included) exactly equals to the
14

outflows of liabilities, the value of assets changes at the same speed as the value of liabilities. In

this case, the interest rate risk is very little because the assets and liabilities are perfectly matched

and the change in their total value is relatively stable. Conversely, if assets and liabilities are

poorly matched ,their values change at different speeds and the interest rate risk will become

high.

 Based on the assumption of well-matched asset and liability durations, interest rate risks

can be classified into three categories9 10.

 - Low Risk Category

 - Medium Risk Category

 - High Risk Category

 Now, we will explore these three categories in more detail:

a. Low Risk Category: the assumed asset/liability duration mismatch in this category should be

 less than or equal 0.125, usually in a well matched portfolio. The one-year swing in interest

 rates is possibly 4 percent. The category should include reserves that are net of reinsurance,

 but should not include structured settlement reserves or reserves in unitized separate

 accounts. This category usually consists of:

 i. annuity reserve with market value adjustment (excluding unitized separate accounts

 and eligible experience rated pension and separate accounts with guarantees)

 ii. annuity reserve not withdrawable (excluding structured settlement annuities and

 eligible experience rated pension and separate accounts with guarantees)

 iii. guaranteed investment contract reserve within one year

 iv. life insurance reserve less reinsurance and policy loans

9
 https://www.actuary.org/files/publications/Report%20on%20clarification%20of%20c-3%20%2003-01-
2002.pdf
10
 http://www.naic.org/documents/prod_serv_statistical_rsn_lb.pdf
15

b. Medium/High Risk Category: the assumed asset/liability duration mismatch in this category

 should be larger than 0.125. It determined by measuring the value of the additional risk from

 the more discretionary withdrawal provisions based on assumptions of policyholder behavior

 and random interest rate scenarios. For medium risk category particularly, supplementary

 contracts not involving life contingencies (SCNI) and dividend accumulations are also

 included because the historical tendency of these policyholders is relatively insensitive to

 interest rate changes. The category usually includes:

 i. including annuity reserve with surrender charge

 ii. exhibit 10 reserve not included in item 10D of the Notes to Financial Statement

 (excluding reserve not related to specific policies)

 iii. structured settlement annuities

 iv. annuity reserve with no adjustment (for high risk category only)

 During calculation, low risk category is first determined, followed by adding medium and

high risk categories, which are derived from the low one.

 The risk factor for all these three categories of interest rate risks are demonstrated in the

following table11:

 Class Factor

 Low Risk 0.0075

 Medium Risk 0.015

 High Risk 0.03

 The conditions for calculating RBC under C3 are:

11
 http://www.naic.org/documents/prod_serv_statistical_rsn_lb.pdf
16

 a. General account funded:

 ○ because interest rate risks will be meaningless without a founded general

 account;

 b. Reserve interest rate or fund long-term interest guarantee must be less or equal to

 4%:

 ○ because the one-year swing in interest rates that is used to measure low

 risk category is possibly 4 percent;

 c. Experience rating mechanism is immediate participation, retroactive credits of

 other technique other than participating dividends:

 ○ because such an action can give a more credible estimation for the risk;

 d. The investment is not subject to discretionary withdrawal or is subject to market

 value adjustment:

 ○ only if the portfolio experience and current interest rates can be reflected

 in the lump sum market value adjustment reflect, which is expected to

 pass both credit risk and rate risk to the policyholder on withdrawal.

 Here is an example for calculating interest rate risks12:

 For an insurance company investing $3,500 million in a project that is classified in low-

risk categories, the risk factor is 0.75%, and the RBC under C3 Interest Rate Risk, should be

$3,500 * 0.75% = $26.25 million.

12
 https://math.illinoisstate.edu/krzysio/MAT483/RBC.pdf
17

C-4. Business Risk

 Generally speaking, business risk is the unavoidable risk of running a business. It

includes all the extra risks that cannot be simply classified in the previous three kinds of risks.

Although the business risks vary from firm to firm, there is only one factor considered in the

calculation, which is a charge for the risk of guaranty fund assessments (a kind of fund that is

usually used when an insurance company is insolvent and cannot pay his liabilities to the

policyholders13).

 The following table illustrates the business risk for some certain types of firms14:

 Type of Firms Factor

 Life and Annuity Business 0.02

 Health Insurance 0.005

 Here is an example for C4 Business Risk:

 For a health insurance company spending $300 million to invest a project, the RBC

capital under C4 Business Risk is: Investment * Risk Factor = $300 million * 0.5% = $1.5

million.

13
 http://www.ilhiga.org/
14
 http://www.naic.org/documents/prod_serv_statistical_rsn_lb.pdf
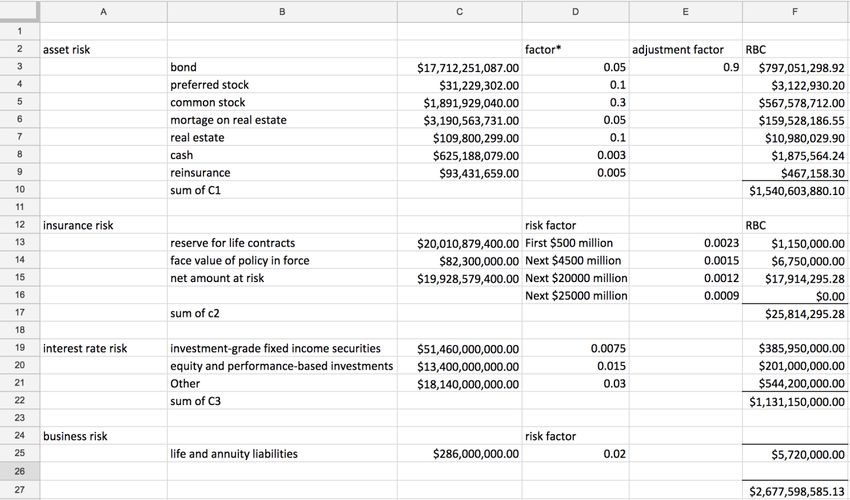
18

Example: Allstate Corporation

 In this section, we are going to introduce an example of RBC calculation on Allstate

Corporation, according to the historical data of Allstate’s assets and liabilities. Using data from

annual statement of Allstate, the Required Risk-Based Capital can be calculated.

 We first evaluate the C-1 (asset default) risk by summing up default risks of Allstate’s

various investments, including bond, preferred stock, common stock, mortgage on real estate,

cash, and reinsurance of Allstate Corp., each adjusted with its corresponding NAIC risk factor.

 C-2 (insurance) risk evaluates the policy mispricing risk Allstate takes, and can be

calculated by subtracting face value of policy in force from reserve for life contracts.

 C-3 (interest rate) risk measures the how sensitive Allstate’s investments are under

changing interest rate. Unfortunately, the interest rate risk rating information of Allstate’s

investments remains private, and we have no access to it. So C-3 risk cannot be calculated.

 C-4 (business) risk represents Allstate’s normal business management and operation risk

and can be calculated by multiplying Allstate’s investment in life and annuity to the

corresponding risk factor.

 The chart below in the next page illustrates the calculation of Allstate’s risks for Risk-

Based Capital.

 Using the RBC formula, the required risk-based capital comes out to be $2.7 billion,

which is reasonable compare to Allstate’s $2.8 billion in annual report. The number is smaller

than $2.8 million mainly because we are lack of data of calculating C3.
19

 According to Allstate’s 2017 annual report, the company has a total adjusted capital of

$17.70 billion. Dividing the total adjusted capital by the authorized control level RBC, the RBC

ratio comes to be approximately 6.32. This significantly exceeds the authorized control level, and

shows that Allstate has sufficient amount of capital, based on its risk level, to support its

operations. As a conclusion, Allstate trigger no regulatory intervention in 2017.
20

Calculation for An Illinois-Based Company

 Here is an example of how we calculate RBC for an Illinois-Based Company. We

calculate it from the balance sheet below.

 Asset Liability Capital

 Bond 3000 Aggregate Reserve 1686.92 Common Stock 0

 Common Stock 1000 AVR 2000 Surplus 1313.08

 (Unassigned

 Funds)

 Preferred Stock 1000

 Total Asset 5000 Total Lia. 3686.92 Total Capital 1313.08

 From section C-1, an investment portfolio of $5,000 calculates to have C-1 RBC of $694.

From section C-2, with an example of whole life insurance product of death benefit $20,000, C-2

RBC is calculated to be $45.54. This insurance policy also has a liability of $1686.92 at time 0.

This liability can be covered by the equity of $5,000 invested in bonds. Using this same

insurance product, C-3 interest rate risk is risk on the reserves, which is the first premium

received of $200, and it’s calculated to be $1.50 (200*0.0075). C-4 risk is also calculated using

the premium because a part of premium is used to pay for the guaranty fund. It is calculated to be

$4 (200 * 0.02). All these risks summed up using the RBC formula gives us a value of $700.99.

It means that the Company Action Level RBC is 700.99, and the total adjusted capital of this
21

amount of above would satisfy the Company Action Level.

 Assume our company has AVR (Asset Valuation Reserve)of $2000, and a surplus of

$1313.08. Our Total Adjusted Capital is $2000 + $1313.08 = $3313.08, and our RBC ratio is:

 $3313.08
 = 4.73 which exceed the required ratio of 2.50. Our company is considered solvent
 $700.99

at this point.
22

Reference

 1. Bennett N., (June 2014) Regulatory Capital Requirements for U.S. Life Insurers,

 Retrieved from https://www.actuary.org/files/Regulatory_Capital_Requirements_US_

 Life_Insurers_6-17-14.pdf

 2. Bennett N., (December 2013) Life Risk-Based Capital and the Asset Valuation Reserve,

 Retrieved from https://www.actuary.org/files/RBC_AVR_Presentation_to_NAIC_

 IRBCWG_12-5-13.pdf

 3. Brown C., Garber J., (2016) Insurance Summit Risk-Based Capital Update, Retrieved

 from http://www.naic.org/insurance_summit/documents/insurance_summit_160517_

 financial_risk_based_capital_update.pdf

 4. Illinois Life and Health Insurance Guaranty Association. (2017) Retrieved from

 http://www.ilhiga.org/

 5. Lilly C., Webb B., (1994) Raising the Safety Net Risk-Based Capital for Life Insurance

 Companies, National Association of Insurance Commissioners Publications Department

 Retrieved from http://www.naic.org/documents/prod_serv_statistical_rsn_lb.pdf

 6. NAIC, (Nov 2017) CRP CREDIT RATING EQUIVALENT TO SVO DESIGNATIONS,

 Retrieved from http://www.naic.org/documents/svo_naic_aro.pdf

 7. Yu M., (April 2017) Proposed NAIC RBC C1 Factors for Life Insurers, Retrieved from

 https://www.neamgroup.com/insights/proposed-naic-rbc-c1-factors-for-life-insurers

 8. Ostaszewski K., (2003) Spring 2003 Notes for SOS Course 6 exam, Retrieved from

 https://math.illinoisstate.edu/krzysio/MAT483/RBC.pdf

 9. Allstate Corporation. 2017 Annual Report. Northfield Township, IL: Allstate

 Corporation, 2018. Allstate Corporation. Web. 10 May 2018, Retrieved from
23

https://www.allstate.com/resources/allstate/attachments/annual-report/328815-allstate-

complete-combo-2017.pdf
You can also read