Roadshow Presentation - June Lars Schnidrig, CEO | Dr. Kai Klinger, CMO - Corestate Capital

Page created by Manuel Lopez
 
CONTINUE READING
Roadshow Presentation - June Lars Schnidrig, CEO | Dr. Kai Klinger, CMO - Corestate Capital
Roadshow Presentation
June
Lars Schnidrig, CEO | Dr. Kai Klinger, CMO
Roadshow Presentation - June Lars Schnidrig, CEO | Dr. Kai Klinger, CMO - Corestate Capital
Disclaimer

This presentation contains forward-looking statements that are subject to various      Glossary
risks and uncertainties. Such statements are based on a number of assumptions,
estimates, projections or plans that are inherently subject to significant risks, as   € = Euro;
well as uncertainties and contingencies that are subject to change.                    $ = (US)Dollar;
Actual results can differ materially from those anticipated in the forward-looking     % = percentage;
statements of CORESTATE Capital Holding S.A. (the “Company”) as a result of a          a = actual;
variety of factors, many of which are beyond the control of the Company,
including those set forth from time to time in the Company’s press releases and
                                                                                       acc. = according;
reports and those set forth from time to time in the Company’s analyst and             adj. = adjusted;
investor calls and discussions. The company does not assume any obligation to
                                                                                       aggr. = aggregated;
update the forward-looking statements contained in this presentation.
                                                                                       approx. = approximately;
This presentation does not constitute an offer to sell or a solicitation or offer to   c(a) = circa;
buy any securities of the Company, and no part of this presentation shall form the
basis of or may be relied upon in connection with any offer or commitment              e = expected;
whatsoever. This presentation is being presented solely for information purposes       (F)Y = (financial) year(s);
and is subject to change without notice.
                                                                                       H = half year(s);
                                                                                       LTM = last twelve months;
                                                                                       M = month(s);
                                                                                       Q = quarter(s);
Extent and impact of the corona pandemic on the course of business in 2020
cannot yet be conclusively assessed. The company is therefore monitoring further       tba = to be announced
developments and their impact on business activities very closely and will always      k = thousand(s);
present reliable information transparently in a timely manner.
                                                                                       m = million(s);
                                                                                       bn = billion(s)

                                                                                                                     2
Roadshow Presentation - June Lars Schnidrig, CEO | Dr. Kai Klinger, CMO - Corestate Capital
A Fully Integrated and Specialized Real Estate Investment Manager

         € c28bn                                                       >50%
         Assets under                                                   EBITDA
         Management                                                     Margin

                               ~800 FTEs | 42 Offices | 7 Countries

         BB+ (stable)                   € >4.0bn                      € >1.3bn
        Corporate Credit                Deal Pipeline in              Fund Volume
             Rating                    selected countries             in Real Estate
                                                                        Mezzanine

                                                                                       3
Roadshow Presentation - June Lars Schnidrig, CEO | Dr. Kai Klinger, CMO - Corestate Capital
Attractive Offerings for our Clients in Various Asset Classes

                                                           Key product range

                                                                                       Market                                  Market
                                                                                       leader
                Products                                                                                                       leader

                                  Office             Residential         Micro Living            Retail                Mezzanine
                Return*          3.5% - 4%            4% - 4.5%            5% - 5.5%             5% - 6%                11% - 13%
One-Stop-Shop

                integrated                                        Asset & Property Management
                Platform
                                                   Fundraising, Reporting, Risk Management, Financing etc.

                Clients /                        Semi Institutional       Institutional            Retail
                Investors                              (>300)                (>100)              (>70.000)

                                             Still underinvested asset allocation to (German) Real Estate (Δ c -30%)

                 * after costs

                                                                                                                                    4
Roadshow Presentation - June Lars Schnidrig, CEO | Dr. Kai Klinger, CMO - Corestate Capital
Corestate’s Embedded Growth Strategy

Strong upside potential from both organic and inorganic sources                                                         Mid-term
                                                                                                                        growth
                                                                                      Loan                              perspectives

                                                                                                                         +5-10%
                   Diversified        Institutional &        Micro Living          Private debt       Digitalization/    AuM p.a.
                    Products         Retail Investors                                                Standardization
 Organic       Recurring income  Structural under                                                   Regulation
                                                           Flexible workforce    Stable demand
 Drivers        and strong cash      allocation to                                 in large cities    Client demand
                                                           Bologna Protocol
                flow from            European real                                Regulation
                innovative and       estate
                platform synergies  Interest rate
               Urbanization         environment
               Demographic
                changes

                                                                                                                         +€ 3-5bn
Inorganic
                                                                                                                         AuM p.a.
                   Additional bolt-on                   Fragmented AM market              Firepower (FCF generation
                    or add-in M&A                            in Europe                       & leverage capacity)

                                                                                                                                       5
Roadshow Presentation - June Lars Schnidrig, CEO | Dr. Kai Klinger, CMO - Corestate Capital
Diversified Geographic Exposure and Expected Near-term Expansion

                                       c €3.3bn                               Norway                                c €16.6bn
                                                                                                Sweden
                                                                BeNeLux c €1.8bn
                                                                                                                       Micro
 RoW     c €3.2bn                                                                                                      Living

                                                                                   Denmark

                                             Ireland                                    Hamburg
                                                          Oxford
                                                                                                         Poland
                                                            London                 Leipzig
                                                                                                                                c €0.4bn
                                 c €1.9bn
                                                                     Luxemburg      Frankfurt
                                                                                   Munich
                                                                            Zurich               Vienna Hungary
                                                                            Wollerau
                                 c €0.2bn                                                                c €0.4bn

                                                                                             Italy

                                            Portugal
                                                       Madrid
   Headquarters
   Main offices
   Short-term expansion expectations

                                                                                                                                       6
Roadshow Presentation - June Lars Schnidrig, CEO | Dr. Kai Klinger, CMO - Corestate Capital
Ample Room for External Growth

                                                Strict set of acquisition criteria drives approach to
                                                                   external growth

                                                                           new
                                                                        geography
   Sector consolidation driven by trend to                     new                   new asset
   bigger asset managers and increasing                     investors                  class
   regulatory costs (AIFMD)
                                                       Real
                                                      estate &                               cross-
                                                     complemen-                              selling
   European Real estate AM market is
                                                     tary AuMs                           opportunities
   fragmented: >90 asset managers with
   AuM below € 10bn

   Comprehensive and integrated multi-                      high % of
   boutique platform enables an efficient and               recurring               EPS accretion
   flexible dock process of new asset manager               revenues

                                                                                                         7
Roadshow Presentation - June Lars Schnidrig, CEO | Dr. Kai Klinger, CMO - Corestate Capital
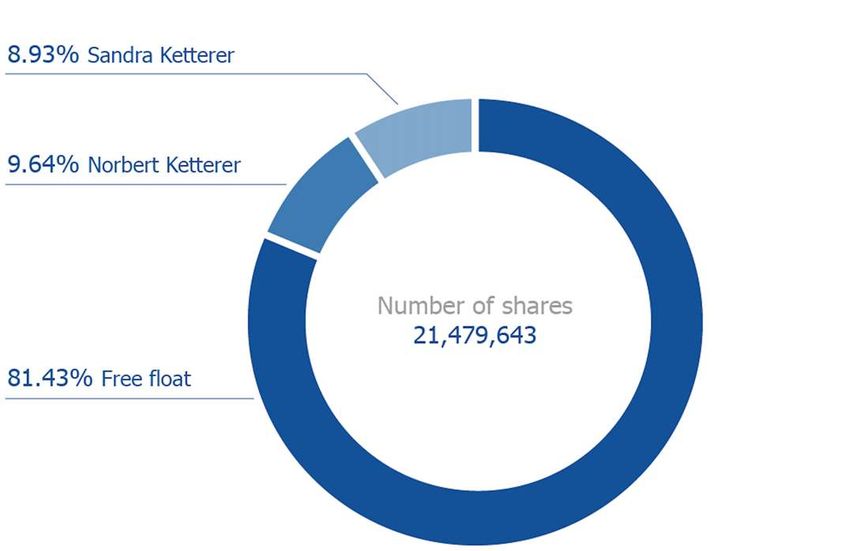
Highlights of Q1-2020

   COVID-19 Key Consequences & Ambitions

      Responsibility
       Safety and healthiness for staff and clients as well as maintenance of operations and quality
      Resilience
       Change of near-term focus from active growth to consistent corporate de-risking
       Preserve liquidity, safeguard financial flexibility and limit balance sheet exposure
      Recovery
       All market drivers intact
       Shifted transactions facilitate significant catch-up effects for 2021

   Solid Start in 2020 Followed by Increasing Market Turmoil
       Decent set off in January and February followed by dynamic impact from Corona Crisis in March
       Nearly complete market slow down in real estate investment
       >2% organic growth on RE AuMs

                                                                                                        8
Roadshow Presentation - June Lars Schnidrig, CEO | Dr. Kai Klinger, CMO - Corestate Capital
Update – Real Estate Investment Markets under COVID-19

Distinct Market Slow Down since March                    Sneak Preview on Upcoming Months
   Near-term uncertainty and potential macro impact       Since May, prudent steps to re-start public life
   Credit crunch & variance in valuations                 Clients will very carefully observe the situation,
   Reluctant client sentiment                              especially in segments like hotel or retail
                                                           General focus will stay on Core and Core+
Various Segments Show Different Vulnerabilities             (residential, logistics and office in top cities)
 Retail, hotel and leisure                                 Investments in micro living might start later
   Partly rent postponements/losses (on funds levels)      this year
 Residential                                               We expect interesting market opportunities to
   Very defensive product                                  materialise over the next six to twelve month
 Logistics and office
   Very limited impact
 Micro Living
   Student homes depend on universities re-openings
   Standstill in Spanish projects
   Temporary reduced occupancy in serviced apartments

                                                                                                                 9
Roadshow Presentation - June Lars Schnidrig, CEO | Dr. Kai Klinger, CMO - Corestate Capital
Enhanced Corporate Governance: New Supervisory Board

  Supervisory Board: Focus on Diversity, Independence and Competences*

              Dr. Georg Allendorf (Chairman)
              Former Head of Real Estate Europe at DWS
                              Dr. Gabriele Apfelbacher (Head of Governance Committee)
                                     Former Partner at Cleary Gottlieb Steen & Hamilton

              Timothy Blackwell (deputy Chairman)
              Former Head of Real Estate IM at Credit Suisse

                                                                         Marc Driessen
                                                CEO, Bloxxter, former MD of HansaInvest
              Olaf Klinger (Head of Audit Committee)
              CFO of Symrise

                                                                     * Further information and full CVs on our website

                                                                                                                         10
Assets under Management on Record High

Assets under Management                                                                                       Sourcing Pipeline
 +2.2% net organic growth in RE AuM in Q1-2020 and Ø 9-10% since 2016                                      Deal Pipeline down due to
 STAM added initially net c € 1.4bn in AuM                                                                  market slow down

 Planned decrease in non-Real Estate AuM of € -0.3bn (decreased by c 44%                                   Clients with ongoing cautious
  since acquisition)                                                                                         deal appetite
                                                                                                            High percentage in advanced
                                                                                                             contractual status
                                                                                  28bn
                                             25bn               26bn                                                          in exclusivity / DD
   non Real Estate                                                                          3.2bn non-RE                             23%
   Logistic/other                                                        +9%      9%
                            22bn                      +10%
   Retail                                                                         14%
   Office                          +28%                                                                            € 4.3bn
                                                                                  28%                                                    in LOI
   Micro Living                                                                             24.8bn RE                                     12%
                                                                         22.2bn
   Residential                                        20.7bn                      23%
                                   16.2bn
                    +440%                                                                                    under review / identified
              3bn                                                                 26%                                  65%

            FY-2016     FY-2017             FY-2018            FY-2019            Q1-2020

                                                                                                                                              11
                                                                                                                                              11
Real Estate Debt – Highly Diversified with Clear
Focus on Residential Projects in Top7 German Cities

Uses of Mezzanine Funds at the End of Q1-2020
                                                                         Residential               Retail
  Total fund volume: > € 1.3bn
                                                                               70%                 16%
  # of financed projects: 62
                                                                                          62
  Ø size of mezzanine financing: c € 22m                                               projects     Office
  Regular analyses (projects and borrowers) without any negative                                    14%
   result or approach to critical risk levels

Regional Break Down of Current Outstanding Financings (in m€)

                   >70% of lending volume goes to
                           Top7 cities in Germany

  292
         191
                  140     137     113       92   13      62                                   82      18      17
                                                                    57         48      38

                                                                                                                   12
Overview HFS Stratos Funds

     Historic Mezzanine Fund Volumes                                                  Stable Investor Base

     1.400                                                                     c1,3
                                                                  1,155                           Pension Funds 20%
     1.200                                           1,108
                                                                                      Insurers                            Investment
                                          962                                                                              Funds 10%
     1.000                                                                              18%
                              758
       800                                                                                                                    Others3)
                                                                                                       c70                      2%
       600
                 414                                                                              institutional
       400                                                                                           clients
       200
                2014        2015         2016        2017         2018         2019
                12,8%       13,2%        12,7%       12,0%        11,1%        13%
Committed 1)    99.2%       98.6%        98.7%       99.3%        99.2%       99.1%
                12.8%       13.2%        12.7%       12.0%        11.1%        13%
                                                                                                       Pension Schemes 50%

                                                                                                          3) Others incl. Banks, Foundations etc…
      Key Performance Parameter
      Avg. performance2) since inception around 12.0% p.a.                             Outstanding performance driven
      Interest-bearing share of committed fund volume c 80%                            by efficient deployment of funds
                                                                                        in combination with cautious
      Very visible investment pipeline for the upcoming quarters
                                                                                        volume increase

    1) Average commitment of fund volume to projects
    2) Based on reported performance of IAF Stratos II & IV acc. to BVI standard                                                               13
Revenue Streams in Q1 Partly Hit by Covid-19 Pandemic

 Q1-2020 Revenue Split-Up
 in m€ (Q1-2019)

    7.7 (4.2)                     Acquisition rel. fees    Market slow down after decent first weeks

    25.2   (20.2)                 Asset & property mgt.    Solid start into 2020

                10.9 (13.3)       Coupon Particip. Fee     Slight impact (mainly accounting driven)

                0 (0)             Promote/sales fee        Value-add market nearly completely closed

                    1.6 (5.7)     Mezzanine Loans          Less balance sheet exposure

                     4.5 (11.4)   Alignment capital        Valuations reflecting market uncertainties

                                  Warehousing/
                      1.9 (3.8)                            Changed approach to warehousing
                          25.1    RE operations

  51.7 (58.6)                     Aggr. revenues           Company operationally clearly profitable

                                                                                                         14
Adjusted Short Term Strategy on Warehousing and
Balance Sheet Exposure Led Temporary to Lower Margins

Key P&L Figures Q1-2020
in m€

Aggr. revenues                     51.7    100%
                                                    Higher OpEx ratio (>50%) due to seasonality and weaker
Expenses from RE Investment Mgt.   -21.9   42.4%     revenue lines esp. in warehousing and alignment capital

Alignment capital expenses          -2.6    5.0%    Financial result in last year´s Q1 was driven by higher
                                                     warehousing debts
Warehousing expenses                -1.7    3.3%    D&A affected by IFRS 16 and consolidation of STAM
G&A expenses                        -7.1    9.7%    Adjustments on net profit level
Other Income                        2.4     4.6%
                                                         Management contracts € 6.3m
                                                         DTA € -0.8m
EBITDA                             20.9    40.4%

D&A                                 -8.4   16.2%

EBIT                               12.5    24.2%

Financial result                    -2.5    4.8%

Net profit                          8.8    16.2%

Adj. net profit                    14.3    27.5%

                                                                                                               15
Key Balance Sheet Figures with Solid Cash Position

     Debt Overview at the End of March 2020
     in m€

                                                                                              Robust liquidity position as key priority
                     575.4                  81.5                                              Slight reduction of Bank & other debt
        Bank &
                       111                                                                       (warehousing debt down to € 33m reflects
    other debt
(incl. € 33m in                                                                                  cautious usage of balance sheet risk)
  warehousing                                                 493,9                           Financial leverage IFRS 16-adjusted at 3.1x,3
          debt)
                                                                                                 mid-term target range of between 2x and 3x
                                                                                                 remains in place
          Senior
                       295
           bond                                                                               S&P rating update from April 2020:
                                                                                                 BB+, outlook “stable” (from “positive”)

                                                                                              No substantial redemptions/refinancing needs
    Convertible                                                                                  until end of 2022
                       192
         bond

                  Total debt1              Cash2           Net debt

1 Total financial debt adjusted for rental and leasing liabilities
2 incl. restricted cash
3 Net debt / EBITDA LTM of € 157.2m; excl. IFRS 16 adjustments, financial leverage would be at 3.3x

                                                                                                                                               16
Outlook

    Weather the Crisis Based on Robust Liquidity, Entrepreneurial Flexibility and a Promising
    Business Perspective
      High cost and capital discipline based on a comprehensive catalogue of measures

      Clearly profitable operations

      Intensified risk and performance analyses on fund structures

      Further negative impacts from crisis in Q2-2020 expected esp. on alignment capital, warehousing
       and promote fees

      New financial outlook 2020 as soon as possible, most likely during Q3

      Catch-up effects from postponed transactions in a normalized market environment

      Clear objective to reduce net financial debt in the medium term

      Adjusted pay out ratio: at least 30% of EpS (as from 2021)

                                                                                                         17
Appendix
Appendix: 2019 ESG & Client Initiatives – Sustainability, Transparency
                         and Digitization

                                                                Long term Commitments               Client Services and Digitalization
                                                               -20% CO2 emissions by 2025          First ESG Report published in 6/2019
                                                   nvi-        +30% energy efficiency by 2025
Definition of Clear and Ambitious ESG Targets

                                                ronment        -20% water consumption by 2025
                                                               -20% residual waste by 2025

                                                             +30% of women in management
                                                   ocial      by 2025                               Launch of compelling new
                                                Issues       Corestate Foundation and employee      homepage with client foucs
                                                              charity day

                                                             Supervisory Board extension and
                                                    over-     independence
                                                nance        Compliance and Transparency
                                                              (Inrev, UNPRI, ethics declaration)
                                                                                                     Launch of own digital distribution
                                                                                                      platform

                                                                                                                                      19
Appendix: Long-dated Fund Maturity Profile

                                                                                               Maturities by type of funds (1)
                                                                                                                                                                                                                          46%

                                                                                                                                                                                                           HFS funds in
                                                                                                                                                                                                             evergreen
                                                                                                                                                                                                              structure

                13%

                                          6%
                                                                                           5%
                                                                                                                   2%                       3%                                                          2%         2%
                                                                  1%                                                                                                1%                       1%

                2021                     2022                    2023                     2024                    2025                    2026                     2027                    2028         2029      2030    2030+

                                       Real Estate Equity Funds                                                     Real Estate Debt Funds                                                    Non Real Estate

 Notes:
 (1) Maturities are defined as the contractual end of the AM contract. It is expected that most of the contracts are renewed or a transfer of the assets into another CORESTATE vehicle takes place..

                                                                                                                                                                                                                                  20
Appendix – Q1/2020 Profit & Loss Statement

        (€ m)                                                    Q1/2020    Q1/2019
        Revenue from Acquisition Related Fees                         7.7       4.2
        Revenue from Asset and Property Management                  36.1       33.5
        Revenue from Promote and Sales Fees realized                (0.1)         0
        Income from Mezzanine Loans                                   1.6       5.7
        Revenue from Real Estate Investment Management              45.3       43.4
        Management expenses                                        (21.9)     (15.5)
        Earnings from Real Estate Investment Management              23.5       27.9
        Net Rental Income                                             1.4        2.7
        Revenue from Service Charges                                  0.8        0.9
        Net Gain from Selling Property Holding Companies            (0.3)        0.1
        Total Income from Real Estate Operations / Warehousing        1.9        3.8
        Expenses from Real Estate Operations / Warehousing          (1.7)      (3.4)
        Earnings from Real Estate Operations / Warehousing            0.2        0.5
        Earnings from Alignment Capital                               1.9        9.8
        General and Administrative Expenses                         (7.1)      (3.6)
        Other Income                                                  2.4        4.1
        EBITDA                                                       20.9       38.7
        Depreciation and Amortisation                               (8.4)      (7.6)
        EBIT                                                         12.5       31.1
        Net Financial Expenses                                      (2.5)      (7.4)
        EBT                                                          10.0       23.7
        Income Tax expenses                                         (1.2)      (2.6)
        Net Profit for the Period                                     8.8       21.0
        of which attributable to equity holders                       8.7       21.0

                                                                                       21
Appendix – Balance Sheet as of 31 March 2020

          (€ m)                                         31 March 2020   31 Dec 2019
          Non-Current Assets
          Goodwill                                              607.4         567.1
          Other Financial Instruments                           173.9         172.2
          Intangible Assets                                     111.0         109.6
          Investment in Associates and Joint Ventures           117.2         126.5
          Other Non-Current Assets                               76.8         104.9
          Total Non-Current Assets                            1,086.3       1,069.9
          Current Assets
          Inventories                                            62.3          62.3
          Cash and Cash Equivalents                              79.0         103.2
          Other Current Assets                                  196.8         172.6
          Total Current Assets                                  354.7         338.1
          Total Assets                                        1,441.0       1,418.4
          Total Equity                                          684.9         676.3
          Long-term Financial Liabilities to Banks                6.8          17.0
          Other Long-term Financial Liabilities                 544.3         520.3
          Other Non-Current Liabilities                          16.6          35.2
          Total Non-Current Liabilities                         569.7         572.5
          Current Liabilities
          Short-term Financial Liabilities to Banks              47.3          37.7
          Other Short-term Provisions                            12.1          13.9
          Other Current Liabilities                             126.9         117.9
          Total Current Liabilities                             186.3         179.6
          Total Equity and Liabilities                        1,441.0       1,418.4

                                                                                      22
Appendix –Shareholder Structure and Research
                                               Shareholder Structure (acc. to latest public filing)

                                               Average target price > €42 (100% Buy)

                                                                   € 65
       € 56                                                                                                                             Buy
                                                                                 € 50
                     € 40                           € 38                                                     € 41           € 40
                                                                                                                                        Hold
                                   € 25                                                         € 28
                                                                                                                                        Sell

   12 Mai 2020   12 Mai 2020   29 April 2020     08 Juni 2020   25 Feb 2020   12 Mai 2020   12 Mai 2020   30 April 2020   12 Mai 2020

                                                                                                                                               23
IR-Contact and Financial Calendar 2020

Key Investment Proposition
1    Fully integrated real estate investment manager with € 28bn AuM
2    Solid macro backdrop and strong recurring fee income streams provide stability
3    € >4bn pipeline drive superior organic AuM growth
4    Growing allocation to real estate provides fundraising base

5    External growth opportunities from sector consolidation
6    Strong profitability and attractive dividends

Investor Contact                                           Financial Calendar 2020
Dr. Kai G. Klinger                                              25 February         Publication preliminary results for FY 2019
Chief Markets Officer                                               24 March        Annual financial report 2019
Phone: +49 69 3535630-106                                              12 May       Publication results for Q1
ir@corestate-capital.com                                                5 June      Annual General Meeting
                                                                   11 August        Publication results for H1
                                                               10 September         Capital Markets Day
                                                               11 November          Publication results for first nine months

                                                            Please note that these dates could be subject to change
You can also read