ROOT CAUSE ANALYSIS
KRISTEN BIGELOW-TALBERT, COMMUNITY HEALTH QUALITY MANAGER, MSHM, CPHQ

BI-STATE PRIMARY CARE ASSOCIATION, MONTPELIER, VT
←
→
Page content transcription
If your browser does not render page correctly, please read the page content below

ROOT CAUSE ANALYSIS KRISTEN BIGELOW-TALBERT, COMMUNITY HEALTH QUALITY MANAGER, MSHM, CPHQ BI-STATE PRIMARY CARE ASSOCIATION, MONTPELIER, VT

INTRODUCTIONS

• Kristen Bigelow-Talbert, CPHQ, MSHM
• Community Health Quality Manager
   • Bi-State Primary Care Association
   • VT Rural Health Alliance, an HCCN
   • 11 FQHCs across 64 sites in VT
   • 11 FQHCs and 1 FQHC LAL across 47 sites
     in NH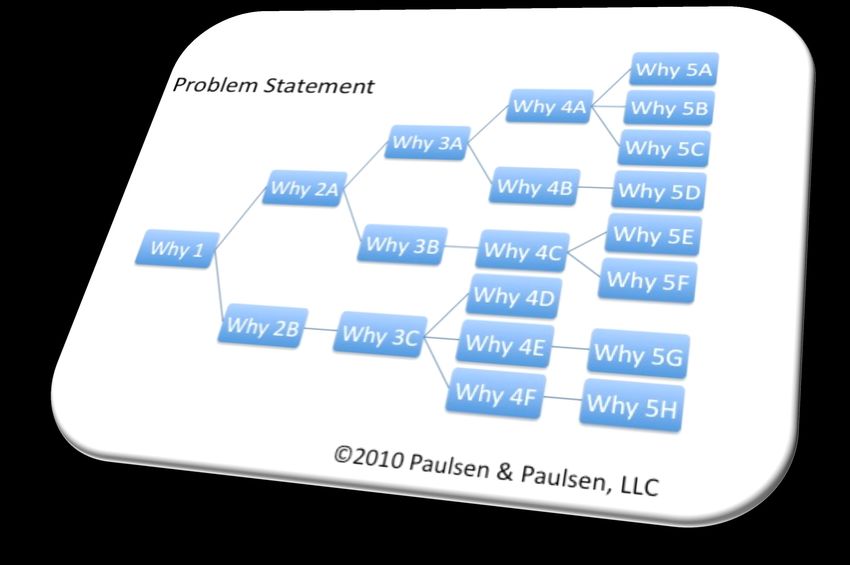
LEARNING OBJECTIVES

        1                   2                3                   4
 The participant     The participant   The participant    The participant
 will be able to     will understand   will understand    will understand
 summarize the       how to develop    the most           how a root cause
 importance of       your Problem      common methods     analysis may be
 conducting a root   Statement and     of Root Cause      used to identify
 cause analysis.     gather baseline   Analysis and how   priorities for
                     data.             to conduct them.   diabetes
                                                          prevention using a
                                                          prioritization
                                                          matrix.

ROOT CAUSE ANALYSIS: WHY BOTHER?

Root cause analysis helps to get at the
underlying problem (the root) that is
causing the symptoms (the problem) that
you see. Doing an intervention without
first doing a root cause analysis is akin to
putting a band-aid on a wound that needs
surgery. It won’t fix the problem!

LINCOLN MEMORIAL
MYSTERY
WHY WAS THE LINCOLN MEMORIAL CRUMBLING?
LINCOLN MEMORIAL MYSTERY
•   Why was the Lincoln memorial crumbling?
     •   Harsh cleaning chemicals and a large volume of water were used to clean it
         daily

•   Why were harsh chemicals used?
     •   To get off the bird droppings

•   Why were there so many bird droppings on the memorial?
     •   There were numerous spiders living in the Memorial, providing ample food for
         starlings and sparrows

•   Why were there so many spiders in the Memorial?
     •   Midges (a type of tiny insect) swarmed the Memorial at dusk, providing ample
         food for the spiders

•   Why were the midges swarming the Memorial?
     •   They were attracted to the lights
LINCOLN        • Proposed solution: turn off the lights
MEMORIAL:        during the one hour timeframe after
ROOT CAUSE &     sunset.
SOLUTION            • Results of a 6 week PDSA: 85% reduction
                      in midge infestation

               • https://www.deseretnews.com/article/96997/MONUMENT-LIGHTING-WILL-BE-
                 DELAYED-TO-GET-THE-BEST-OF-PEST.html?pg=all
DEVELOPING YOUR PROBLEM STATEMENT

• To be done BEFORE starting your Root Cause Analysis
• “All patients with diabetes who have an A1C over 9” is too
  broad of a category. Narrow it down!

Data

  Problem
Identification
TIPS FOR WRITING YOUR PROBLEM STATEMENT:

       Include                          Do Not Include
          Identify the Gap                  Assumed causes of the problem

         Timeframe / trend                 Possible solutions to the problem

 Impact (health outcomes, cost, etc.)     Conjecture or belief rather than fact

                                         External issues outside of the scope of
        Importance (urgency)                          the problem

          Data (if available)                        Names of staff
EXAMPLE PROBLEM STATEMENTS: THE GOOD, THE BAD, THE UGLY • “45% of our patients aren’t coming to us for their flu shots, because they prefer the timeliness of getting them at the pharmacy.” • “30% of our patients with an A1C over 9 have not come in for their 3 month diabetic check. For patients with out of control A1Cs, ongoing patient engagement is necessary to help patients manage their diabetes.” • “The problem is that the triage nurses aren’t answering the phones, so we have a backlog of phone messages.”
EXAMPLE PROBLEM STATEMENTS: THE GOOD, THE
   BAD, THE UGLY

• “45% of our patients aren’t coming to us for their flu shots, because they prefer the
  timeliness of getting them at the pharmacy.”
    • REVISED: “We are missing information on whether or not 45% of our patients have had a flu shot
      this season.”

• “30% of our patients with an A1C over 9 have not come in for their 3 month diabetic check.
  For patients with out of control A1Cs, ongoing patient engagement is necessary to help
  patients manage their diabetes.”
• “The problem is that the triage nurses aren’t answering the phones, so we have a backlog of
  phone messages.”
EXAMPLE PROBLEM STATEMENTS: THE GOOD, THE
BAD, THE UGLY
• “45% of our patients aren’t coming to us for their flu shots, because they prefer the
timeliness of getting them at the pharmacy.”
• REVISED: “We are missing information on whether or not 45% of our patients have had a flu shot
this season.”
• “30% of our patients with an A1C over 9 have not come in for their 3 month diabetic check.
For patients with out of control A1Cs, ongoing patient engagement is necessary to help
patients manage their diabetes.”
• “The problem is that the triage nurses aren’t answering the phones, so we have a backlog of
phone messages.”EXAMPLE PROBLEM STATEMENTS: THE GOOD, THE
BAD, THE UGLY
• “45% of our patients aren’t coming to us for their flu shots, because they prefer the
timeliness of getting them at the pharmacy.”
• REVISED: “We are missing information on whether or not 45% of our patients have had a flu shot
this season.”
• “30% of our patients with an A1C over 9 have not come in for their 3 month diabetic check.
For patients with out of control A1Cs, ongoing patient engagement is necessary to help
patients manage their diabetes.”
• “The problem is that the triage nurses aren’t answering the phones, so we have a backlog of
phone messages.”
• REVISED: “We have a backlog of phone messages in our system; 30 from last week, and 23 from
the week before. This is not only a liability risk, but a patient safety risk.”REAL PROBLEM STATEMENT EXAMPLE
For some patients we are missing lab
results. It is unclear if the patient attended
their lab appointment or not. Missing lab
results impacts patient quality of care.Proposals
Solutions
BEFORE YOU BEGIN…
IdeasGET YOUR TEAM TOGETHER • Assign a facilitator • Clinicians • QI Lead • Other folks that are involved in patient care for the topic (Care Coordinators, RNs, MAs, etc.) • Don’t forget non-clinical folks! (Front desk staff, IT, Management, etc.)
ROOT CAUSE ANALYSIS
       THE FIVE WHY’S
The Five Why’s
CAREFUL WHEN ASKING “WHY”…

• Craft your “why” question so that it doesn’t point fingers at individuals; rather,
                                                                          “She’s lazy.” inquire about
  processes, barriers, and systems.                                       “She doesn’t care.”
                                                                            “She’s too busy.”
    • Examples:
         • “Why is Susan not following up on these referrals?”
CAREFUL WHEN ASKING “WHY”…
• Craft your “why” question so that it doesn’t point fingers at individuals; rather,
“She’s lazy.” inquire about
processes, barriers, and systems. “She doesn’t care.”
“She’s too busy.”
“No time set aside”
• Examples: “They don’t see it as
“Difficult to track in
EMR”
• “Why is Susan not following up on these referrals?” important.”
• Instead, try: “Why are referrals not being followed up on?”
• “Why is our CEO not providing leadership and resources to this?”CAREFUL WHEN ASKING “WHY”…
• Craft your “why” question so that it doesn’t point fingers at individuals; rather, inquire about
processes, barriers, and systems.
“No time set aside”
• Examples: “They don’t see it as “Difficult to track in
EMR”
• “Why is Susan not following up on these important.”
referrals?” “Right now MAT and
SUD are taking a lot
• Instead, try: “Why are referrals not being followed up on?” of time and
resources.”
• “Why is our CEO not providing leadership and resources to this?”
• Instead, try: “Why is this project not a top priority for management?”TO SIMPLIFY… JUST ASK: “WHY DID THAT HAPPEN?” OR “WHY DID THIS OCCUR?”
For some patients we are missing lab results. It is unclear if the patient actually attended their lab
            appointment or not. Missing lab results impacts patient quality of care.
CAUSE AND EFFECT DIAGRAMS (ALSO KNOWN AS FISHBONE DIAGRAMS)
WHY USE A “FISHBONE DIAGRAM?”

Often many “root       Visual way to       Categorize causes,     Group process;
causes,” or factors   organize a list of   determine what is      actively engages
 contributing to a    causes and their     and is not in your    everyone that is
     problem            relationships           control         part of the process,
                                                                 or influences the
                                                                      outcome
CAUSE-EFFECT
DIAGRAM
(FISHBONE DIAGRAM)
• Developed by Prof. Kaoru Ishikawa
• It visually connects “effect” (problem
statement) and “cause(s)”
• A good tool to investigate several
categories for each problem statement
• Useful for visual learners
https://www.leanstrategiesinternational.com/listen-to-the-
gemba/the-fish-bone-diagram-7-basic-quality-toolsCOMMON CATEGORIES USED • The 6 M’s: Methods, Machines, Materials, Manpower, Measurement, Management • The 4 S’s: Surroundings, Suppliers, Systems, Skills • The 8 P’s: Procedures, Policies, Place, Product, People, Processes, Price and Promotion Can also organize by functions or processes: • Prescribing, filling, dispensing, purchasing, and taking medication • Ordering, performing, resulting, communications
How to Create a Fishbone Diagram
  • Your Problem Statement is placed on the far right as the “head” of the fishbone
  • Decide what categories you want to use; these categories will then become the main “bones”
  • Draw a line to connect the categories to the problem statement

                Category 1                         Category 2

                                                                                      Problem Statement
                Category 3                         Category 4
How to Populate a Fishbone Diagram
• Examine each category and determine what in that category is affecting the problem (ask
“why?”). These then become smaller “bones” on each category.
• As you dig deeper, more “bones” are added
Category 1 Category 2
Problem Statement
Category 3 Category 4https://twitter.com/TheIHI/status/867029107149856769/photo/1
5 WHYS VS.   Fishbone is broken out into categories,
FISHBONES    visual helps to see connections,
             relationships between causes

             Easier to go into deeper levels with “5
             Whys”

             BOTH valid RCA tools!
WHEN ARE YOU AT THE ROOT?...
EXAMINING ROOT CAUSES: PRIORITIZE

Prioritizing: Which would have     Tools: Prioritization Matrix (a
      the biggest impact?                simplified version)
                                 Criteria to consider:
                                 • Impact on the Problem Statement
                                 • Feasibility
                                 • Urgency
Priority Matrix (Simplified)
Key: 10 = high, 1 = low
Problem Statement: Poor diet is contributing to the rise of DM Type 2, obesity, and high A1Cs.
ROOT CAUSE
PRIORITY
Impact on Problem
MATRIX:
Actionable?
Statement
Feasibility
Urgency
TOTAL
Root Causes
Patients were not brought up to know how to cook
EXAMPLE
(FICTIONAL)
6 8 4 5 23
raw/healthy/non-processed foods
The older population seems to have a heavy reliance
on doctors and Rx to fix them. It's a generational
7 1 3 1 12
barrier; a cultural expectations. "If I take this pill, I
should be able to eat what I want."
There are food desserts, and no transportation to
grocery stores after working hours. (We are rural, and
there are not enough people to make that 8 5 3 5 21
affordable.) People are shopping at gas stations /
dollar stores / whatever is closest to their homes.
Grocery stores are not open 24/7. For patients who
need to grocery shop between work shifts, their food 4 1 3 3 11
options are limited.BRAINSTORMING SOLUTIONS • Focus on one root cause at a time! • All ideas are valid! Anything on the table • Brainstorming methods: • Sticky notes • Whiteboard • Quiet team members? Talk to them privately • Revisit your parking lot! • Prioritize Solutions! • Can use the same Matrix • Feasibility, Cost, Impact, Actionable?
Take the 3 Root Causes that are
               Root Causes
DEVELOPING                                at the top of the priority list

YOUR QUALITY
IMPROVEMENT                           All ideas are equal – write them down!

PROJECTS
                                      Involve all players – even community
               Brainstorm Solutions   partners
                                      Revisit your parking lot

               Prioritize                 Use the Prioritization Matrix

                                          Develop Your PDSAs
               Develop Next Steps         Who do you need to collaborate
                                          with?
• Use your Problem • Implement your selected
Statement and Identified solution
Root Cause • Re-Measure your data,
• Identify your Measures using the same criteria as
• Collect your Baseline your baseline, but a new
• Create your Action Plan
• Set your goal Plan Do timeframe.
• Use analysis to
determine next steps
Act Study • Analyze data for trends
and tweaks to the process, and patterns.
if needed.
• Repeat PDSA stepsInclude:
THE PLANNING PHASE
• Original Problem Statement
• Identified Root Cause
• Identified Solution
• Next steps (what, who, and by when)
Ask Yourself:
• Who could we collaborate with?
• What measures would tell the story we are
trying to learn about? (Quantifiable data!)
• What resources do we need to pull this off?
• What is your goal?Specialists
& Hospitals
Housing Schools
REMEMBER
YOUR
COMMUNITY SUD Area
Treatment Agencies
PARTNERS! Facilities on Aging
Health
Primary
Center
Family
Care
Centers
Association
State Dept Transportation
of Health Companies
Food
Shelves /
SupermarketsWHERE TO START?
BASELINE DATA
• Know your data! Check:
• What are your available data
sources?
• What criteria is used?
• Is it telling the truth?
• Important! Does the data tell the
story that you want to learn about?
• Valid?
• Don’t just focus on percentages!SELECTING YOUR MEASURES • Measures include a numerator, denominator and rate • Look at your denominator size • Get your baseline! (Required!) • Beware of generics! • Think outside of the box • What will tell the story??
CONVERTING QUALITATIVE
                               TO QUANTITATIVE
• Some data – like experiences – can be
  hard to quantify.
• Try using a scale; 1-10
• Look for common themes in the data; can
  any be grouped? (for example, comments
  about the staff, comments about the space,
  positive comments, negative comments,
  etc.)
• Try to structure your data collection
  ahead of time to get as much quantitative
  data as possible.
SETTING YOUR GOAL: BE SMART!
SETTING AIMS & GOALS:
EXAMPLES
• Aim: To get patients to stop no-showing
   • Needs Improvement!

• Aim: To reduce no-shows from our baseline of 10% to 8%
   • Better

• Aim: To reduce no-shows from our weekly baseline of 10% to 8%
  within 1 month
   • Best!
FROM PAPER TO PRACTICE

                         • Develop your Action Plan!
                         • What / Who / When?
                         • Important to assign tasks!! Don’t
                           assume.
                         • Create a deadline and hold folks to it.
                         • Meet regularly; review the To-Do’s
                           from the previous meeting; status?
                           Complete? Barriers to completion?
SAMPLE ACTION PLAN:
OUTREACH
When
Tasks to be completed Who will do will it be Tools/Resources Status
it? done by? needed?
Generate a list of patient not Access to the EMR,
June 15,
up to date on their IT desired parameters for Complete
2017
Mammogram Screening report
Decide: Phone Calls or Letter? June 20, Complete: letter
QI Team
2017 was decided upon
Draft a phone script / letter Complete: letter
June 30,
QI Team Word Processor drafted and ready
2017
to be printed
Conduct Outreach Care July 30, Printer, paper, In process; 50%
Coordinators 2017 envelopes, stamps, etc. complete
Monitor / Track responses August 1,
Care Spreadsheet with patient
2017 &
Coordinators list
ongoing
Track data August 1,
IT 2017 & EMR
ongoing
Analyze Progress and Next Team members, status
QI Team Monthly
Steps updatesDO IMPLEMENT CHANGES
• Make sure all involved staff understand WHY the change is
needed. Get them on board!
• Make sure all staff understand what you want them to do. No
guessing games!
• Have a contact person for questions / concerns.
• EXPECT resistance. Change is scary!! Support them, hear
them. Their concerns are valid, and they deserve to be
heard.
• Having a clinical champion can help tremendously. Someone
who is passionate about the cause!
• Check-in frequently. Make sure the requested changes are being
done.http://10minutehr.com/wp-content/uploads/2013/09/Virginia- Satir-change_process-by-Michael-Erickson.gif
Leadership buy-in

 TIPS TO   Find a Clinical Champion!

SUSTAIN    Communication, communication, communication!!!

CHANGE     Involve those who will be impacted – from the start!!!

           Make results visible

           Celebrate small successes

           Check in – how are things going for staff? Do they have questions or
           need extra support?
QUESTIONS?? • (Please fill out the evaluation!) Contact Information: Kristen Bigelow-Talbert, CPHQ, MSHM Community Health Quality Manager Bi-State Primary Care Association kbigelow@bistatepca.org
You can also read