RURAL COMMODITIES WRAP - FEBRUARY 2021 Author Phin Ziebell, Senior Economist - Agribusiness - NAB

Page created by Kevin Robinson
 
CONTINUE READING
RURAL COMMODITIES WRAP - FEBRUARY 2021 Author Phin Ziebell, Senior Economist - Agribusiness - NAB
RURAL
COMMODITIES
WRAP
FEBRUARY 2021

Author Phin Ziebell, Senior Economist – Agribusiness
RURAL COMMODITIES WRAP - FEBRUARY 2021 Author Phin Ziebell, Senior Economist - Agribusiness - NAB
KEY POINTS
                          Despite the global challenges of 2020, Australian agriculture had
CONTENTS                  a generally very good run, driven by strong prices for many (but
                                                                                                 NAB RURAL COMMODITIES INDEX
                          not all) commodities and much better seasonal conditions. While        National and by state
3 | In focus
                          trade issues with China hurt some sectors, the reality is that         200
5 | Seasonal conditions                                                                                          National                 NSW
6 | Farm inputs           Australian agriculture is in its strongest position in years.          180             VIC                      QLD
7 | Livestock                                                                                                    WA                       SA
                          But what will 2021 deliver? Overall our sense is that 2021 should                      TAS
8 | Winter crops                                                                                 160
                          bring another solid year for many, although it is likely that an
9 | Summer crops, sugar   appreciating AUD and frothy livestock prices will see some             140
10 | Rainfall data        downwards pressure on the NAB Rural Commodities Index in
                          the back half of 2021. This should however be seen in context:         120

CONTACTS                  cattle prices are currently at record highs and the Rural              100
                          Commodities Index hit a record in April last year (although has
Phin Ziebell              since fallen somewhat). Prices for most commodities (with some         80
Senior Economist          exceptions) should be supportive of good producer returns                2010       2012      2014      2016      2018    2020
+61 (0) 475 940 662       throughout 2021.
                                                                                                 MONTHLY COMMODITY PRICE CHANGES
Alan Oster                Chinese trade barriers were a feature of 2020 and their
Group Chief Economist     continuation, escalation or de-escalation is a key question for                         Nov 20         Dec 20         Jan 21
+61 (0) 414 444 652       Australian farmers in 2021.                                              Wheat          ▼ 6.1%         ▼ 4.5%         ▲ 4.0%
Dean Pearson              Seasonal conditions have been generally wetter than average in           Beef           ▲ 3.1%         ▼ 3.5%         ▲ 5.0%
Head of Economics         the south-east as well as northern Australia, reflecting the La Nina
+61 (0) 457 517 342       we entered last year. However, large areas of Queensland remain          Dairy          ▼ 8.9%         ▼ 0.9%         ▲ 8.7%
                          drier than average, as does much of Western Australia. The               Lamb           ▼ 2.7%         ▼ 0.4%         ▲ 13.1%
                          Bureau of Meteorology expects the La Nina to continue to
                          weaken, although the seasonal outlook for the next three months          Wool           ▲ 5.7%         ▼ 0.7%         ▲ 2.5%
                          is wetter than average.
                                                                                                   Sugar          ▲ 2.2%         ▼ 5.0%         ▲ 5.9%
                          Overall, the NAB Rural Commodities Index fell 1.7% in December
                          2020 but rose 4.2% in January 2021 on a month-on-month basis.            Cotton         ▲ 1.6%         ▲ 0.9%         ▲ 4.8%
                          The index is now 7.3% higher than the same time last year.
                                                                                                  Source: NAB Group Economics, ABARES, Meat
                                                                                                  and Livestock Australia, Australian Pork,
                                                                                                  Ausmarket Consultants, Australian Bureau of
                                                                                                  Statistics, Bloomberg and Profarmer.
 2
RURAL COMMODITIES WRAP - FEBRUARY 2021 Author Phin Ziebell, Senior Economist - Agribusiness - NAB
IN FOCUS: KEY FORECASTS FOR 2021
                                                                                                 With 2020 done and dusted, we have (perhaps ill-advisedly) put our
NAB AUD FORECASTS                                                                                heads on the chopping block with some thoughts on the direction
AUDUSD, quarterly. Note forecasts represent end of quarter                                       of key grain and livestock commodity prices in 2021.
      1.00
                                                                                                 Underpinning our 2021 forecasts is the AUD forecast track. The
      0.90                                                                                       AUD tanked early in 2020, but quickly recovered and has been
                                                                                                 trading in the 76-78c range this year, with USD weakness the driver
      0.80
                                                                                   0.81
                                                                                          0.83   of many currencies’ strength, Australia’s included. Our forecasts
                                                                            0.80
                                                              0.77   0.77                        point to the AUD climbing to 80 cents by mid-year and 83c by the
      0.70
             0.71   0.70          0.70                 0.71                                      end of 2021.
                           0.67                 0.69
      0.60                                                                                       While there are clearly some risks to our AUD outlook (equity
                                         0.62
                                                                                                 market volatility, trade issues, vaccine rollout delays, broader risk
      0.50
                                                                                                 events etc), the reality is that China’s economic recovery is
                                                                                                 relatively steel intensive and this is pushing up demand for
                                                                                                 Australian iron ore. With iron ore prices buoyant, the US dollar
NAB RURAL COMMODITIES INDEX                                                                      relatively weak and Australia’s economy outperforming
Quarterly. Note forecasts represent quarterly average                                            expectations (in substantial part due to good virus management),
                                                                                                 the AUD is likely to appreciate over the year.
180
                                                                                                 For a more detailed look at our FX forecasts, see our Global FX
160
                                                                                                 Strategist.
                                                                                                 This currency appreciation will likely put some pressure on rural
140                                                                                              commodity prices. While some commodities, like grains, wool,
                                                                                                 cotton etc are highly FX sensitive, others like saleyard cattle prices
120                                                                                              are more driven by weather at present. Our forecasts for the
                                                                                                 commodities underpinning the NAB Rural Commodities Index are
100                                                                                              mixed, but overall we see an easing of rural commodity prices this
                                                                                                 year, largely unwinding the gains of 2020. For more detail on our
                                                                                                 cattle and grain forecasts, see overleaf.

  Source: ABARES, ABS, MLA and NAB Group Economics

  3
RURAL COMMODITIES WRAP - FEBRUARY 2021 Author Phin Ziebell, Senior Economist - Agribusiness - NAB
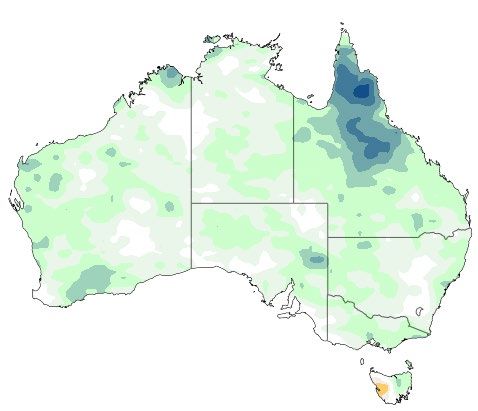
IN FOCUS: KEY FORECASTS FOR 2021 (CONTINUED)
                                                     Cattle prices are likely to be a major driver of this unwinding. Cattle
LIVESTOCK FORECASTS                                  prices have enjoyed a monster run over 2020, largely in response to
AUc/kg, quarterly                                    better seasonal conditions driving restocker demand. EYCI is now
     1000                                            approaching 900c/kg. While it is possible that prices will continue
     800
                                                     to move higher if Queensland rains deliver, local prices are now out
                                                     of step with global fundamentals, particularly in light of an
     600                                             appreciating AUD. While it is entirely normal for Australian prices
                                                     to be out of step with global benchmarks during times of herd
     400                                             rebuilding, if demand eases there is substantial downside risk.
     200                                             On balance, we expect saleyard prices to fall somewhat in the back
                  EYCI             Trade lamb        half of the year. Our forecast track has EYCI at 700c in Q3 and 650c
       0
                                                     in Q4 2021. It is important to consider that there is substantial
                                                     uncertainty around cattle prices for the coming year, with weather
                                                     events, currency moves, global demand and global supply
                                                     (particularly if processor capacity improves in the Americas), all
NAB RURAL COMMODITIES INDEX                          major influences.
Quarterly
                                                     Australian grain prices headed south over 2020, with eastern states
     500                                             wheat futures down almost 20% over the year. This largely
                                                     reflected the end of domestic premiums as drought-induced supply
     400
                                                     shortages and feed demand ended. With a massive crop now
     300                                             harvested, growers will be looking to the trajectory of 2021 prices.
                                                     One on hand, global prices have rallied over past year on supply
     200                                             concerns, trade issues and the Covid-induced desire to hold more
                    East Aust milling wheat future
     100
                                                     physical grain for security reasons. We see global prices remaining
                    East Aust feed barley            elevated, but largely counterbalanced by a higher AUD and the
       0                                             demise of basis. All this adds up to a forecast for Australian wheat
                                                     in the low $300s range, a respectable price especially factoring in
                                                     good to excellent yields in the recent harvest.
                                                     Barley has come under more pressure due to China’s trade
 Source: ABARES, ABS, MLA and NAB Group Economics    restrictions, although alternative markets have been found,
                                                     predominantly in Saudi Arabia as feed. We do not expect a swift
 4                                                   resolution to this trade issue.
SEASONAL CONDITIONS
The declaration of La Nina late last year         ROOT ZONE SOIL MOISTURE         BOM RAINFALL OUTLOOK
promised much for agriculture in eastern          2 February 2020                 February – April 2021
and northern Australia. While it has
delivered handsomely for Victoria, New
South Wales, South Australia and northern
Tasmania, Queensland is much patchier. Soil
moisture from central Queensland to the
Gulf Country remains below average.
The Bureau’s latest update suggests that El
Nina is likely to have peaked, but it likely to
continue into autumn. The latest three-
month outlook points to above average
rainfall from February to April, particularly
in far-north Queensland.
Subsoil moisture levels in much of Victoria,
                                                  RAINFALL DECILES                BOM ENSO TRACKER
New South Wales and South Australia               January 2021                    Monthly SST anomaly 2 February update
should be enough to give the 2021-22
winter crop a fighting start, and paddock
feed levels remain anecdotally very good in
many regions.

                                                  Source: Bureau of Meteorology
 5
FARM INPUTS
                                                                                                           Farm input prices seen some uptick in the
NAB FERTILISER INDEX                                     NATIONAL AVERAGE FUEL PRICES                      new year, higher AUD notwithstanding.
AUD index                                                AUc/litre
                                                         180                                      petrol
                                                                                                           Our fertiliser index saw big declines from
240                                                                                                        late 2018 to mid-2020, but the trajectory
                                                         160                                      diesel
220                                                      140                                               since has been anything but. In January
200                                                      120
                                                                                                           alone our fertiliser index rose 8.8%. While
                                                                                                           there has been considerable volatility in
180                                                      100
                                                                                                           fertiliser prices of late, producers should
160                                                      80
                                                                                                           perhaps be mindful of upside risk,
                                                         60
140                                                                                                        particularly given the rally in natural gas
                                                         40
120                                                                                                        prices recently.
                                                         20
100                                                       0                                                Fuel prices have moved upwards recently
   2010      2012   2014    2016   2018     2020           2010      2012   2014   2016   2018   2020      (although more so for petrol than diesel),
                                                                                                           following a period of fairly low prices
NAB FEED GRAIN PRICE INDEX                                                                                 throughout 2020. Global oil prices have
AUD/t                                                                                                      essentially recovered to pre-pandemic
                                                                                                           levels, presaging upward pressure at the
400                                                                                                        bowser. Pre-pandemic, national average
                                                                                                           diesel prices were closer to 150c/l,
300                                                                                                        compared to around 120c/l for much of
                                                                                                           2020.
200                                                                                                        NAB’s feedgrain price index has shown
                                                                                                           some signs of life in 2021, following a
                                                                                                           downward trend in 2020. With Australian
100
                                                                                                           grain prices now comparable to world
                                                                                                           benchmarks, and higher global grain prices
  0                                                                                                        offsetting the rise in the AUD, it is likely that
      2010           2012              2014              2016               2018          2020             feed prices have reached their low point.
                                                                                                           That said, with good domestic supplies,
  Source: Bloomberg, Profarmer and NAB Group Economics                                                     we do not see major upside for prices.

  6
LIVESTOCK
                                                                                                                           Lamb prices moved out of sync with their
 CATTLE                                                     LAMB                                                           usual seasonal patterns last year, rising
 AUc/kg                                                     ESTLI, AUc/kg                                                  instead of falling during the spring flush. The
 1000            EYCI                                       1,000                                                          new year has brought further gains, with
                                                                                                                           trade lamb above year-ago levels. That, said
  800            US live cattle future                        800                                                          we see lamb values as essentially maxed out
                                                                                                                           at 2020’s peak. While that may see some
  600                                                         600                                                          upside in coming months, spring flush price
                                                                                                                           falls are likely to return this year after an
  400                                                         400
                                                                                                                           absence in 2020.
  200                                                         200                                                          Wool prices have recovered somewhat from
                                                                                                                           their lows in September last year, but recovery
       0                                                        0
                                                                                                                           has been much more pronounced for finer
        2010   2012     2014    2016     2018   2020             2010     2012     2014     2016     2018       2020
                                                                                                                           wools, generally below 20 micron and below.
                                                                                                                           While the Australian wool industry has made
 GDT AUCTION RESULTS                                        WOOL                                                           great strides in diversification, the extent to
 AUD/tonne                                                  Southern region, by micron, AUc/kg                             which office workers return post-pandemic –
                        Butter                                                17          19          21              23   and the attire they wear – will be of great
9000                                                        3,500
                        Cheddar                                               25          28          30                   interest to the sector.
8000                    Skim milk powder                    3,000
7000                    Whole milk powder                                                                                  Global Diary Trade auction results have
                                                            2,500                                                          moved higher in USD terms over the last six
6000
5000                                                        2,000                                                          auctions in a row. NAB’s dairy export price
                                                                                                                           indicator moved 4.9% higher in AUD terms in
4000                                                        1,500
                                                                                                                           January – encouraging news for the sector.
3000
                                                            1,000
2000                                                                                                                       For more information on cattle, see our more
1000
                                                              500                                                          detailed forecasts on page 4.
  0                                                              0
   2010        2012     2014   2016      2018   2020              2010    2012     2014    2016    2018        2020

  Source: NAB Group Economics, ABARES, Meat and Livestock Australia, Australian Pork, Ausmarket Consultants,
  Australian Bureau of Statistics, Bloomberg and Profarmer.

  7
WINTER CROPS
Harvest is now done and dusted and has
delivered excellent results. In the east,
                                                 WHEAT                                                        PULSES
Graincorp brought in 12.8mmt of grain            AUD/t                                                        AUD/t
                                                                                                              1,400         Chick peas        Field peas      Lupins
(8.4mmt NSW, 3.5mmt VIC and 1mmt QLD)            500
as of 11 January, while in the west CBH                                                                       1,200
                                                 400
brought in 14.2mmt as of 18 December.                                                                         1,000
While a big crop was largely expected in
                                                 300                                                            800
eastern states due to the wetter than
average conditions, the strong numbers in        200
                                                                                                                600
Western Australia came despite fairly
                                                                                                                400
challenging seasonal conditions.                 100                            ASX east Aust future
                                                                                                                200
ABARES’ December update had wheat                                               AUD denominated CBOT
pegged at a monster 31.2mmt, essentially           0                                                               0
                                                    2010      2012     2014     2016    2018     2020               2010    2012     2014     2016     2018   2020
double 2019-20’s crop and just shy of the
2016-17 record. Meanwhile ABARES had
barley at just shy of 12mmt.                     COARSE GRAINS                                                CANOLA
                                                 AUD/t                                                        AUD/t, Newcastle
While we went into some detail around our        500          barley (feed)                                     800
forecasts for wheat prices on page 4, barley                  barley (malting, Geelong)                         700
will be closely watched in the coming
                                                 400          oats (feed, Albany)
months. With a huge crop to move and                                                                            600
China imposing 80% tariffs, Australian                                                                          500
                                                 300
growers have been fortunate to enjoy
                                                                                                                400
strong Saudi buying activity. While this is
only feed barley, the global grain price rally   200                                                            300
has allowed growers to enjoy reasonable                                                                         200
prices.                                          100
                                                                                                                100
                                                   0                                                               0
                                                    2010       2012    2014     2016     2018     2020              2010    2012     2014     2016     2018    2020
                                                       Source: NAB Group Economics, ABARES, Meat and Livestock Australia, Australian Pork, Ausmarket
                                                       Consultants, Australian Bureau of Statistics, Bloomberg and Profarmer.

 8
SUMMER CROPS, SUGAR AND HORTICULTURE
Cotton prices have risen gradually in AUD
terms recently, although price is arguably
                                                            COTTON                                                         SORGHUM AND RICE
not the constraint for Australian cotton.                   AUD/bale                                                       AUD/t
                                                           1,400
                                                                                                                             800
Two major areas will be a focus for 2021.                                                                                                                sorghum (Newcastle)
Firstly, water availability is always a key                1,200                                                             700                         rice (US rough)
determinant of plantings (although dryland                 1,000                                                             600
cotton is back in the ground this year), and                                                                                 500
                                                             800
total water in storage in the Murray Darling                                                                                 400
basin is 53%, and just 27% in the northern                   600
                                                                                                                             300
basin. Growers will be hoping for further                    400
                                                                                                                             200
inflows this year. Secondly, with a
                                                             200                                                             100
commodity so dependent on the Chinese
market, growers will be closely watching                       0                                                               0
any formal or informal restrictions on                          2010     2012      2014     2016     2018     2020              2010     2012     2014      2016        2018     2020
Australian cotton.
Fruit and vegetable prices were – as is often               SUGAR                                                          FRUIT AND VEGETABLES
the case – mixed in wholesale market data.                  AUD/t                                                          Index
Fruit prices gained 6.6% while vegetables                  1,000                                                            300
were off 3.0% in January. A lack of labour                                                                                                                                     Fruit
                                                                                                                            250
availability continues to be the major                       800                                                                                                               Vegetables
concern for industry, with some producers                                                                                   200
unable to harvest crops. It is unlikely that                 600
quarantine will end until later this year,                                                                                  150
although special arrangements have been                      400
                                                                                                                            100
made for some farm workers.
                                                             200                                                              50

                                                               0                                                               0
                                                                2010     2012      2014     2016     2018     2020              2010     2012     2014      2016        2018      2020
 Source: NAB Group Economics, ABARES, Meat and Livestock Australia, Australian Pork, Ausmarket Consultants, Australian Bureau of Statistics, Bloomberg and Profarmer.

 9
MONTHLY AVERAGE RAINFALL IN WINTER CROPPING REGIONS (MM)
                                                 Long run average 1900-01 to 2013-14                                      La Nina years                       2021                              2020
NEW SOUTH WALES                                                               VICTORIA                                                                        QUEENSLAND
150                                                                           150                                                                           150

100                                                                           100                                                                           100

 50                                                                           50                                                                            50

  0                                                                            0                                                                             0
                                                            Oct

                                                                                                                                          Oct

                                                                                                                                                                                                                        Oct
                                                                  Nov
            Feb
                  Mar
                        Apr

                                                      Sep
                              May

                                                                                          Feb

                                                                                                                                    Sep

                                                                                                                                                Nov
                                                                                                Mar
                                                                                                      Apr
                                                                                                            May

                                                                                                                                                                        Feb
                                                                                                                                                                              Mar
                                                                                                                                                                                    Apr

                                                                                                                                                                                                                  Sep

                                                                                                                                                                                                                              Nov
                                                                                                                                                                                          May
                                          Jul

                                                                                                                        Jul

                                                                                                                                                                                                      Jul
                                    Jun

                                                Aug

                                                                        Dec

                                                                                                                  Jun

                                                                                                                              Aug

                                                                                                                                                      Dec

                                                                                                                                                                                                Jun

                                                                                                                                                                                                            Aug

                                                                                                                                                                                                                                    Dec
      Jan

                                                                                    Jan

                                                                                                                                                                  Jan
WESTERN AUSTRALIA                                                             SOUTH AUSTRALIA                                                                 TASMANIA
150                                                                           150                                                                           200

                                                                                                                                                            150
100                                                                           100

                                                                                                                                                            100

 50                                                                           50
                                                                                                                                                            50

  0                                                                            0                                                                             0
                                                            Oct

                                                                                                                                          Oct

                                                                                                                                                                                                                        Oct
                                                                  Nov
            Feb

                                                                                                                                                                                                                  Sep

                                                                                                                                                                                                                              Nov
                  Mar
                        Apr

                                                      Sep
                              May

                                                                                          Feb

                                                                                                                                    Sep

                                                                                                                                                Nov
                                                                                                Mar
                                                                                                      Apr
                                                                                                            May

                                                                                                                                                                        Feb
                                                                                                                                                                              Mar
                                                                                                                                                                                    Apr
                                                                                                                                                                                          May
                                          Jul

                                                                                                                        Jul

                                                                                                                                                                                                      Jul
                                    Jun

                                                Aug

                                                                        Dec

                                                                                                                  Jun

                                                                                                                              Aug

                                                                                                                                                      Dec

                                                                                                                                                                                                Jun

                                                                                                                                                                                                            Aug

                                                                                                                                                                                                                                    Dec
      Jan

                                                                                    Jan

                                                                                                                                                                  Jan
 Source: Bureau of Meteorology and NAB Group Economics

 10
Important Notice
This document has been prepared by National Australia Bank Limited ABN 12 004 044 937 AFSL 230686 ("NAB"). Any advice contained in this document has been prepared without taking into account your objectives,
financial situation or needs. Before acting on any advice in this document, NAB recommends that you consider whether the advice is appropriate for your circumstances.
NAB recommends that you obtain and consider the relevant Product Disclosure Statement or other disclosure document, before making any decision about a product including whether to acquire or to continue to
hold it. Please click here to view our disclaimer and terms of use.

Photo | Mai Thai
You can also read