Supplement of Global flood exposure from different sized rivers
←
→
Page content transcription
If your browser does not render page correctly, please read the page content below
Supplement of Nat. Hazards Earth Syst. Sci., 21, 2829–2847, 2021
https://doi.org/10.5194/nhess-21-2829-2021-supplement
© Author(s) 2021. CC BY 4.0 License.

Supplement of
Global flood exposure from different sized rivers
Mark V. Bernhofen et al.

Correspondence to: Mark V. Bernhofen (cn13mvb@leeds.ac.uk)

The copyright of individual parts of the supplement might differ from the article licence.
Contents
S1 Model Calibration ........................................................................................................................................................ 1
S2 Model Validation ......................................................................................................................................................... 6
 S2.1 Validation Against Existing Models ....................................................................................................................... 6
 S2.2 Validation Against Observed Events ................................................................................................................... 19
S3 Top 50 Countries Exposure........................................................................................................................................ 21
S4 HRSL Missing Countries ............................................................................................................................................. 23
S5 GFM Coverage Maps ................................................................................................................................................. 24
S6 References ................................................................................................................................................................. 27

S1 Model Calibration
The globe was split into five simplified climate zones (Figure S1). The 30 Köppen-Geiger climate classifications (Beck
et al., 2018) were categorized into five climate zones as follows: Tropical (Af – Tropical, rainforest; Am – Tropical,
monsoon; Aw – Tropical, savannah), Arid (BWh – Arid, desert, hot; BWk – Arid, desert, cold; BSh – Arid, steppe, hot;

Figure S1. Map of Model Calibration Basins and Simplified Köppen-Geiger Climate Classifications

BSk – Arid, steppe, cold), Temperate (Csa – Temperate, dry summer, hot summer; Csb – Temperate, dry summer,
warm summer; Csc – Temperate, dry summer, cold summer; Cwa – Temperate, dry winter, hot summer; Cwb –
Temperate, dry winter, warm summer; Cwc – Temperate, dry winter, cold summer; Cfa – Temperate, no dry season,
hot summer; Cfb – Temperate, no dry season, warm summer; Cfc – Temperate, no dry season, cold summer),
 1
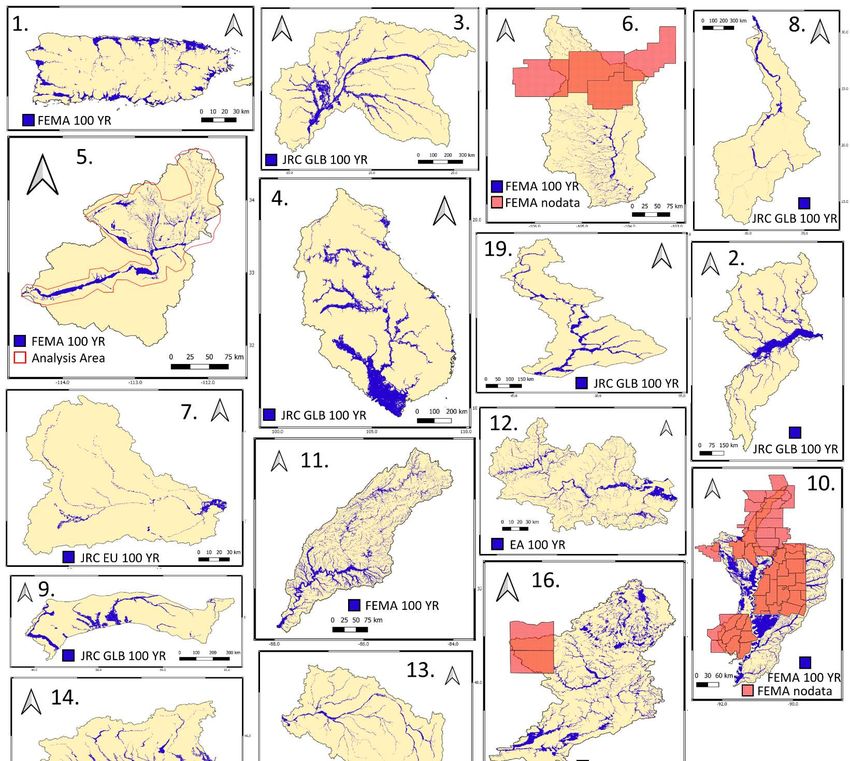
Continental (Dsa – Cold, dry summer, hot summer; Dsb – Cold, dry summer, warm summer; Dsc – Cold, dry summer,
cold summer; Dsd – Cold, dry summer, very cold winter; Dwa – Cold, dry winter, hot summer; Dwb – Cold, dry
winter, warm summer; Dwc – Cold, dry winter, cold summer; Dwd – Cold, dry winter, very cold winter; Dfa – Cold, no
dry season, hot summer; Dfb – Cold, no dry season, warm summer; Dfc – Cold, no dry season, cold summer; Dfd –
Cold, no dry season, very cold winter), Polar (ET – Polar, tundra; EF – Polar, frost).

Our River Flood Susceptibility Model (RFSM) was calibrated against reference flood maps in 19 different calibration
basins globally. These calibration basins, visualized in Figure S1, span all climate zones (except Polar regions). The
aim in choosing the calibration basins was to ensure that for each climate zone we had reference flood maps for
rivers of all Strahler stream orders. We use 4 different reference flood maps: FEMA’s 100 year national flood hazard
layer (https://www.fema.gov/flood-maps/tools-resources/flood-map-products/national-flood-hazard-layer), The
Environment Agency’s 100 year flood map for planning (http://apps.environment-
agency.gov.uk/wiyby/cy/151263.aspx), JRC’s 100 year flood map for Europe (Dottori et al., 2016b), and JRC’s Global
100 year flood map (Dottori et al., 2016a). The 100-year return period was chosen as it was the only return period
consistent across all the datasets. Table S1 summarizes each of the calibration basins and the reference flood map
used. Figure S2 shows maps of each of the calibration basins and visualizes the reference flood maps within the
basins.

 Table S1. Calibration Basin Information

 # Basin Name Climate Zone Reference Flood Map Strahler Orders
 1 Puerto Rico Tropical FEMA 100 YR 1-5
 2 Central Amazon Tropical JRC GLOBAL 100 YR 6-8, 11
 3 Lower Congo Tropical JRC GLOBAL 100 YR 5-10
 4 Lower Mekong Tropical JRC GLOBAL 100 YR 6-10
 5 Lower Gila Arid FEMA 100 YR 1-6, 9-10
 6 Upper Pecos Arid FEMA 100 YR 1-7
 7 Jucar Arid JRC EU 100 YR 4-7
 8 Upper Nile Arid JRC GLOBAL 100 YR 6-10
 9 Lower Lena Arid JRC GLOBAL 100 YR 6-9, 11
 10 Lower Mississippi Temperate FEMA 100 YR 1-10
 11 Alabama Temperate FEMA 100 YR 1-7
 12 Thames Temperate EA 100 YR 1-6
 13 Loire Temperate JRC EU 100 YR 4-9
 14 Po Temperate JRC EU 100 YR 4-8
 15 Muskingum Continental FEMA 100 YR 1-7
 16 Rock Continental FEMA 100 YR 1-7
 17 Susquehanna Continental FEMA 100 YR 1-8
 18 Oder Continental JRC EU 100 YR 4-9
 19 Central Lena Continental JRC GLOBAL 100 YR 6-7, 10-11

 2
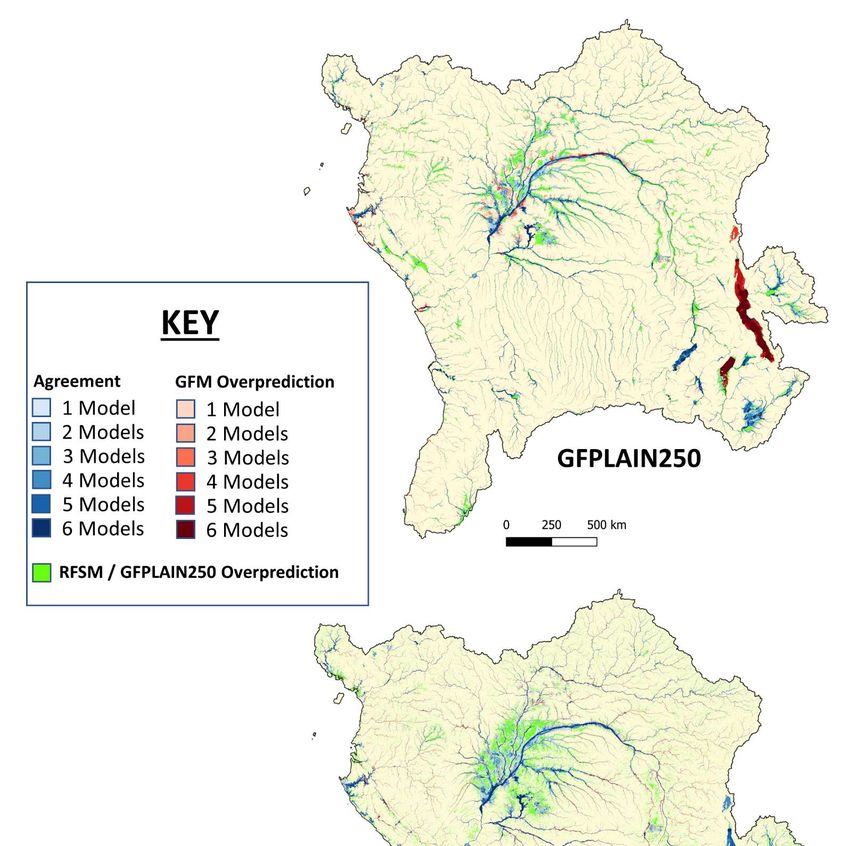
Figure S2. Visualization of the reference flood maps used for calibration in each of the calibration basins. Calibration
basins are as follows: 1. Puerto Rico, 2. Central Amazon, 3. Lower Congo, 4. Lower Mekong, 5. Lower Gila, 6. Upper Pecos,
7. Jucar, 8. Upper Nile, 9. Lower Lena, 10. Lower Mississippi, 11. Alabama, 12. Thames, 13. Loire, 14. Po, 15. Muskingum,
16. Rock, 17. Susquehanna, 18. Oder, 19. Central Lena

 3
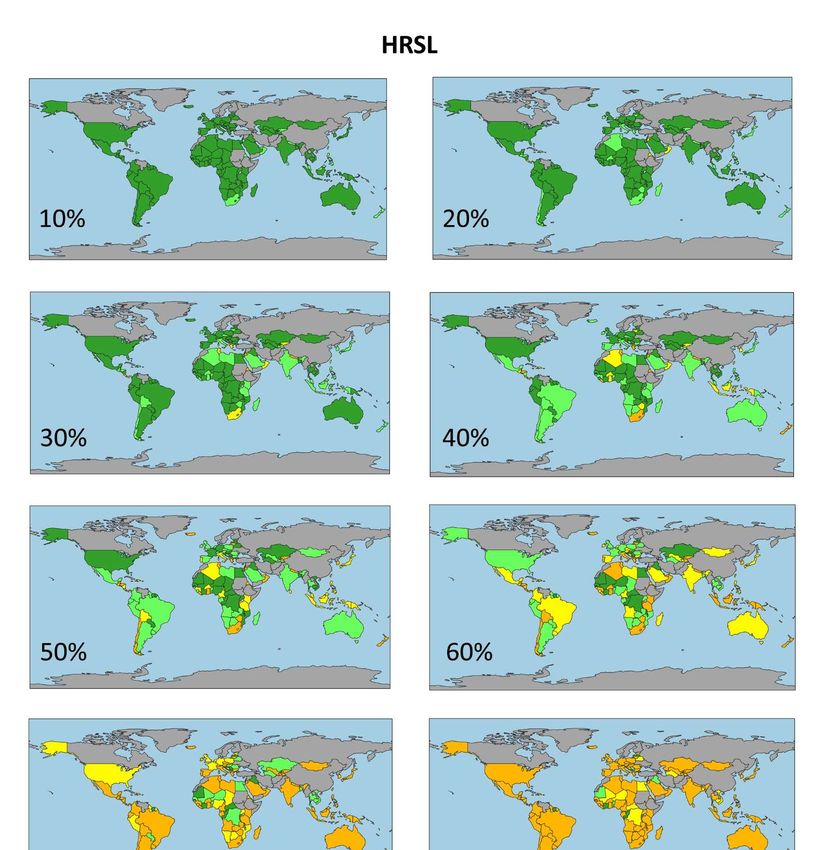
Table S2. Performance Score Contingency Table

 Model
 Wet Dry
 Wet A – wet agreement C – model underpredict
 Reference
 Dry B – model overpredict D – dry agreement

Our method of model calibration aims to find the optimum Height Above Nearest Drainage value, HN, for each
Strahler stream order river that results in the best fit with the reference flood map. We use three different ‘fit’
statistics, derived from a contingency table (Table S2). The first score is the critical success index (CSI):

 =
 + + (S1)

 CSI scores range from 1 (best) to 0 (worst). The second score is the hit rate (HR):

 =
 + (S2)

HR ranges from 1 (entire reference flood map captured) to 0 (none of the reference flood map captured). The third
score is Bias:
 +
 =
 + (S3)

Bias scores 1 indicate a bias towards underprediction and overprediction, respectively.

Calibration was split into two stages. In the first stage, each river in the calibration basin was split by Strahler stream
order and each order was processed individually. A range of permissible HN values (typically the 5 HN values resulting
in bias scores close to 1) was found for each stream order. In the second calibration stage, the Hn ranges for each
stream order were combined to produce maps with several different Hn combinations. Each of these combinations
was then tested against the reference flood maps to find the optimal Hn combination for each climate zone.

In the first calibration stage, the river network was split into separate Strahler stream orders. Potential HN values
ranging from 0-20 m were tested for each Strahler stream order in each basin. HN values that produced Bias scores
closest to 1 (unbiased), hereafter referred to as u-HN, were identified for each Strahler stream order. The u-HN values
were then used as the basis for producing the permissible HN ranges for each order. Ranges were initially chosen as
u-HN ± 2. Some of the ranges were widened to match the ranges of the other calibration basins in the same climate
zone. The final HN ranges taken into part 2 of the calibration are listed in Table S3.

In the second calibration stage, flood maps were produced in each basin for all possible combinations of HN within
the pre-specified ranges. The only rule for HN combinations was that a higher order stream’s HN couldn’t be smaller
than a lower order stream’s HN (HN-1 ≤ HN). The number of different HN combinations (or flood maps) tested varied
between each basin and was dependent on how many Strahler stream orders were present in the basin. The total
combinations tested for each basin are listed in Table S3. The Jucar river basin (ID 7) had the fewest combinations
(758) while the Mississippi basin (ID 10) had the most (868,915). Scores were calculated to capture the level of fit
between each flood map iteration and the reference flood map. CSI was the main score used for determining the
best level of fit between the model and the reference map. Because only one HN combination can be used to define
the flood map in each climate zone, the optimal HN combination across all calibration basins within the same climate
zones were determined by iteratively applying CSI thresholds to each basin. From the small selection of HN
combinations remaining after this iterative process, the final combination chosen was the one that resulted in the
highest average CSI across the basins. Final HN values for each climate zone are presented in Table S4.

 4
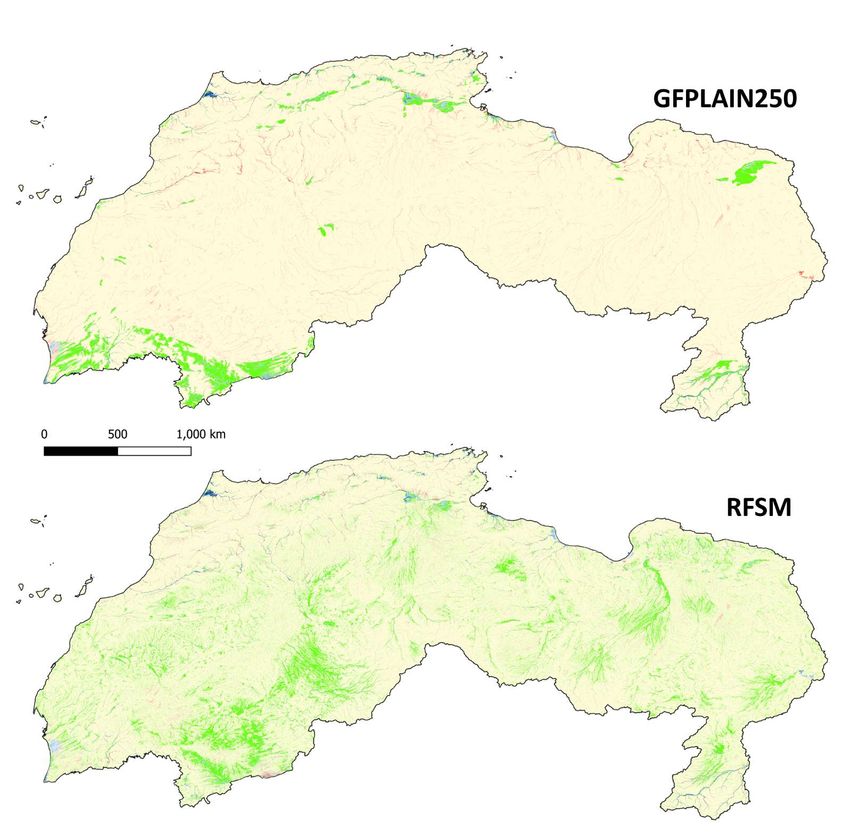
Table S3. HN ranges for Calibration Stage 2 for each basin in each climate zone. Basin IDs correspond with Figure S1

 Basin ID
Order 1 2 3 4 5 6 7 8 9 10
1 0-4 m 0-4 m 0-4 m 0-2 m
2 0-5 m 0-4 m 0-4 m 0-3 m
3 0-5 m 0-4 m 0-4 m 0-6 m
4 3-8 m 0-5 m 0-5 m 0-5 m 0-9 m
5 2-13 m 2-13 m 0-7 m 0-7 m 0-7 m 2-11 m
6 3-13 m 3-13 m 3-13 m 1-8 m 1-8 m 1-8 m 1-8 m 1-8 m 3-12 m
7 3-13 m 3-13 m 3-13 m 2-10 m 2-10 m 2-10 m 2-10 m 5-13 m
8 3-13 m 3-13 m 3-13 m 2-10 m 2-10 m 7-13 m
9 7-17 m 7-17 m 2-14 m 2-14 m 2-14 m 7-13 m
10 7-17 m 7-17 m 5-15 m 5-15 m 9-14 m
11 7-17 m 9-15 m
Combinations 2220 1890 38756 9426 84504 7726 758 7899 7088 868915
 Basin ID
Order 11 12 13 14 15 16 17 18 19
1 0-2 m 0-2 m 0-2 m 0-2 m 0-2 m
2 0-3 m 0-3 m 0-2 m 0-2 m 0-2 m
3 0-6 m 0-6 m 0-5 m 0-5 m 0-5 m
4 0-9 m 0-9 m 0-9 m 0-9 m 2-7 m 2-7 m 2-7 m 2-7 m
5 2-11 m 2-11 m 2-11 m 2-11 m 2-10 m 2-10 m 2-10 m 2-10 m
6 3-12 m 3-12 m 3-12 m 3-12 m 4-13 m 4-13 m 4-13 m 4-13 m 4-13 m
7 5-13 m 5-13 m 5-13 m 5-14 m 5-14 m 5-14 m 5-14 m 5-14 m
8 7-13 m 7-13 m 6-16 m 6-16 m
9 7-13 m 7-16 m
10 8-16 m
11 8-16 m
Combinations 33576 7733 17172 6283 26728 26728 148340 29443 1280

 Table S4. Final HN Values for RFSM

 Maximum Height Above Nearest Drainage (HN)
 Order Tropical Arid Temperate Continental
 1 1m 0m 0m 0m
 2 2m 0m 1m 0m
 3 4m 0m 2m 2m
 4 6m 1m 4m 4m
 5 8m 3m 5m 5m
 6 8m 3m 7m 6m
 7 9m 5m 9m 8m
 8 10 m 5m 10 m 9m
 9 10 m 12 m 10 m 10 m
 10 10 m 13 m 13 m 11 m
 11 13 m 14 m - 12 m

 5
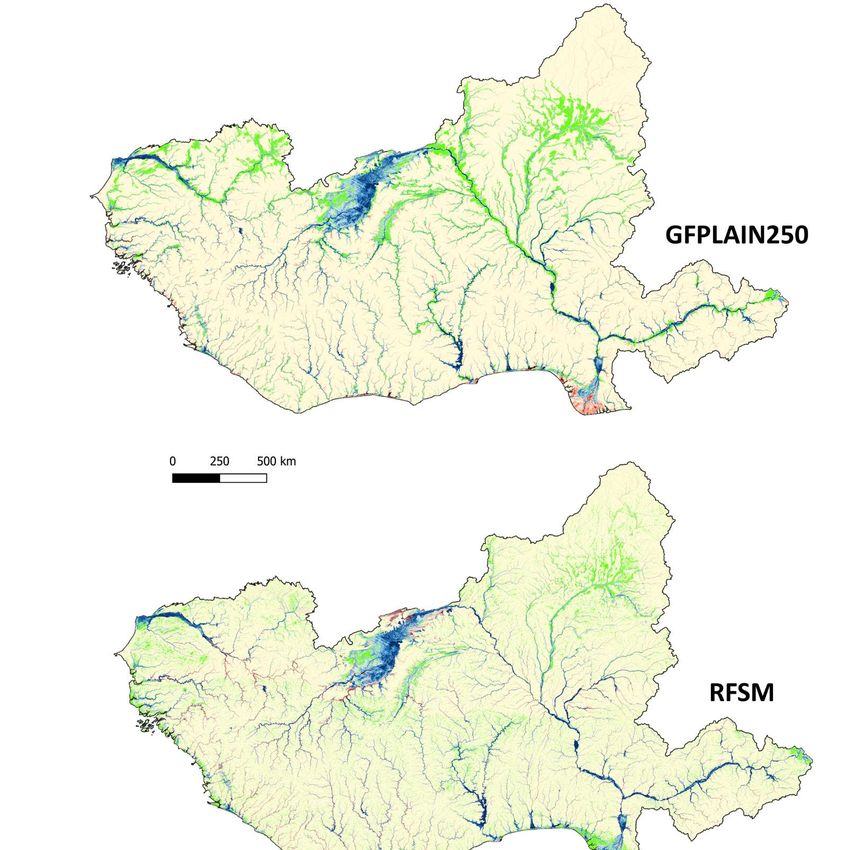
S2 Model Validation
Validation of the RFSM was split into two stages. The first stage compared the RFSM to existing global flood model
(GFM) outputs in Africa. The performance of the RFSM with respect to these existing GFMs was compared with the
performance of another global geomorphological floodplain map: GFPLAIN250 (Nardi et al., 2019). The second stage
involved validating the RFSM output against historical observed flood events. The performance of the RFSM at
capturing these historical events was compared with the performance of existing GFMs.

S2.1 Validation Against Existing Models
The output of 6 GFMs was compared in Africa by Trigg et al. (2016b) in the first GFM intercomparison study. One of
the outputs of the study was an aggregated map (Trigg et al., 2016a) of flood hazard for Africa that showed the
number of models (1-6) that agreed it would flood in a given location (see Figure S3). We use this aggregated map to
validate our RFSM. We also validate another geomorphological flood map, GFPLAIN250 (Nardi et al., 2019), against
the aggregated GFM map. We then compare the results to see how our approach compares to geomorphological
approaches. We use the 100-year return period aggregated GFM map for our validation.

Figure S3. Datasets used in the validation. (From left to right) 100-year return period aggregated global flood model
output for Africa (Trigg et al., 2016a). GFPLAIN250 geomorphological floodplain map for Africa (Nardi et al., 2019).
RFSM map with rivers split by their Strahler stream orders.

Comparison of the RFSM map with the aggregated GFM map is split into three parts. In the first part, we split the
RFSM map into Strahler stream orders. We then overlay the entire aggregated GFM map (any level of agreement)
with the RFSM map and calculated the percentage of each Strahler stream order’s extent that is overpredicting
flooding with respect to the aggregated GFM map:
 − ( ∩ )
 % = 100
 (S4)

where ∩ is the intersection of the RFSM map (of a given order) and the aggregated GFM map, and
 is the total extent of the RFSM map at that order.

In the second part of the analysis, we split the aggregated GFM map into its different levels of agreement, ranging
from 1-6. We then calculate, for each level of agreement, the percentage of the aggregated GFM map that is
captured by both the RFSM map and the GFPLAIN250 map:

 6

 ∩
 % = 100
 (S5)

where ∩ is the intersection of the aggregated GFM map (at the specified agreement level) and the
flood map (either RFSM or GFPLAIN250) and is the total aggregated GFM extent for the specified
agreement level.

In the third part of the analysis, the RFSM map and GFPLAIN250 maps were scored using the performance scores
outlined in the calibration section (equations S1-S3). To make the comparison between the RFSM map and the
GFPLAIN250 as fair as possible an upstream drainage area (UDA) threshold of 1000 km2 was applied to the RFSM

 Figure S4. The level 2 HydroBasins used for validation. Basin names listed alongside HydroBasin specific numeric codes.

map. This is because GFPLAIN250 does not map rivers below this threshold (Nardi et al., 2019). Performance scores
were calculated by intersecting the GFPLAIN250 and RFSM maps with the aggregated GFM map, with 6 different
thresholds of agreement applied to the aggregated GFM map. These thresholds of agreement ranged from ≥1 model
(where any model predicting flooding) to 6 models (where all 6 models agree it will flood).

The African continent was split into major drainage basins for this first stage of validation. We use the HydroBasins
dataset (Lehner and Grill, 2013) at the level 2 categorization as our validation basins. The basin split for the continent
of Africa can be seen in Figure S4, alongside basin names and HydroBasin specific numeric codes. For the continent
of Africa there are a total of 8 level 2 basins. The three parts of the validation analysis outlined above were carried
out in each of the 8 basins. Results for validation parts 1-3 are recorded in Tables S5 - S9. Figures S5-S12 visualize the
overlap between both the RFSM and GFPLAIN250 maps and the aggregated GFM map for each of the 8 level 2
basins.

 7
` Table S5 - Validation Part 1 Results - RFSM Percentage Oveprediction per Stream Order

 Strahler Stream Order
 Basin 1 2 3 4 5 6 7 8 9 10 11
 East Africa - 1020000010 83 80 69 49 31 14 11 5 4 14 X
 South Africa - 1020011530 86 83 74 55 37 19 13 6 2 16 X
 Congo - 1020018810 91 91 74 49 32 16 11 9 4 4 7
 Niger - 1020021940 81 91 77 64 32 14 23 16 10 2 X
 North Africa - 1020027430 94 96 93 88 77 65 62 61 68 X X
 Nile - 1020034170 84 80 71 55 40 29 20 13 2 5 X
 Madagascar - 1020035180 83 85 68 45 22 6 3 1 X X X
 Chad - 1020040190 86 82 77 61 48 34 31 19 33 1 X

Throughout Africa, the RFSM follows the general trend that as the Strahler stream order of the river increases, the
degree of overprediction decreases (Table S5). Low orders (1, 2 and 3) have high degrees of overprediction. This is
because the RFSM has a smaller minimum UDA threshold (10 km2) than any of the other GFMs (between 50-5000
km2) and a lot of the rivers in these categories fall below the minimum upstream drainage area threshold of any
GFM. Intermediate orders (4-6) still show some levels of overprediction as a lot of these rivers will be modelled by
some, but not all, of the GFMs. The levels of overprediction decrease for higher order rivers (>7) for which there is
complete coverage across the GFMs.

 Table S6 - Validation Part 2 Results - Percentage Flooding Captured per GFM Agreement Level

 GFM Agreement Level
 Basin Flood Map 1 2 3 4 5 6
 RFSM 34 52 67 78 87 94
 East Africa - 1020000010
 GFPLAIN250 25 51 66 76 79 73
 RFSM 43 59 73 83 93 98
 South Africa - 1020011530
 GFPLAIN250 20 43 58 71 74 63
 RFSM 50 58 73 84 93 98
 Congo - 1020018110
 GFPLAIN250 33 58 72 79 77 68
 RFSM 52 69 83 91 96 98
 Niger - 1020021940
 GFPLAIN250 44 69 85 93 97 97
 RFSM 46 62 74 82 90 93
 North Africa - 1020027430
 GFPLAIN250 16 27 46 62 80 92
 RFSM 61 78 88 94 98 99
 Nile - 1020034170
 GFPLAIN250 49 73 84 83 65 55
 RFSM 38 42 63 80 91 96
 Madagascar - 1020035180
 GFPLAIN250 12 31 48 60 74 80
 RFSM 56 73 84 89 92 95
 Chad - 1020040190
 GFPLAIN250 60 76 86 93 97 99

In Part 2 of the validation, we look at the different levels of GFM agreement in the aggregated GFM map and
examine the percentage of each agreement level that is captured by the RFSM and GFPLAIN250 maps (Table S6). The
higher the GFM agreement level, the greater the confidence that it will flood in a given location. As such, it is
especially important that the models being tested correctly capture these areas of high agreement. For the two
highest GFM agreement levels (5 models agree, and 6 models agree) the RFSM has a % captured value of above 90%
in each basin in Africa. This shows that the RFSM map is correctly capturing these areas of high confidence of
flooding. Comparing the % captured results of the RFSM with the GFPLAIN250 map, the RFSM has higher % captured
results in each basin except the Chad basin (where both maps still score highly). This shows that the RFSM captures
more of aggregated GFM extent than the GFPLAIN250 map.

 8
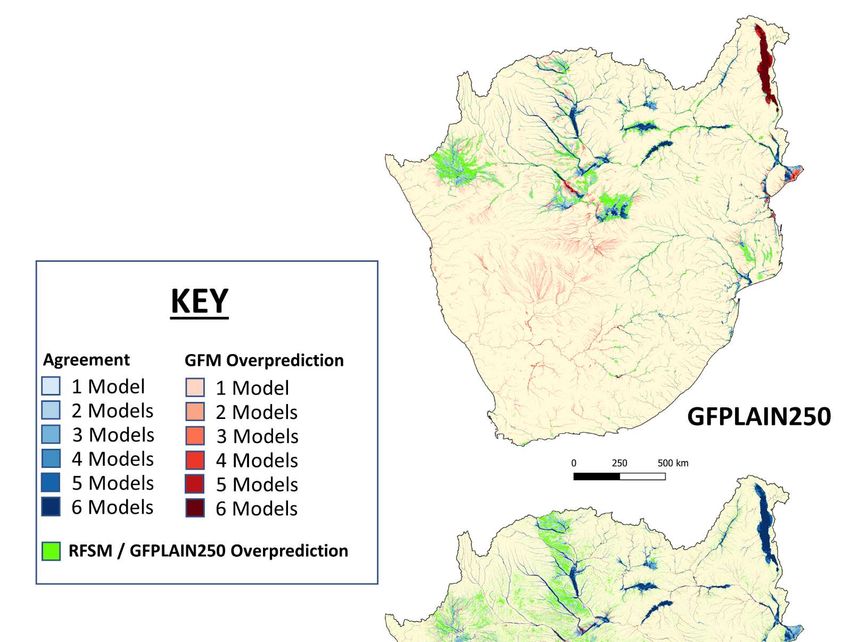
Table S7 - Validation Part 3 Results - Critical Success Index Scores for each GFM Agreement Threshold

 GFM Agreement Threshold
 Basin Flood Map ≥1 ≥2 ≥3 ≥4 ≥5 6
 RFSM 0.31 0.46 0.47 0.41 0.31 0.14
 East Africa - 1020000010
 GFPLAIN250 0.35 0.36 0.29 0.21 0.14 0.07
 RFSM 0.35 0.5 0.49 0.43 0.34 0.22
 South Africa - 1020011530
 GFPLAIN250 0.33 0.36 0.31 0.24 0.17 0.1
 RFSM 0.44 0.56 0.56 0.49 0.38 0.22
 Congo - 1020018110
 GFPLAIN250 0.45 0.44 0.36 0.28 0.19 0.1
 RFSM 0.47 0.54 0.5 0.39 0.27 0.14
 Niger - 1020021940
 GFPLAIN250 0.48 0.43 0.33 0.24 0.15 0.08
 RFSM 0.21 0.13 0.06 0.03 0.01 0.003
 North Africa - 1020027430
 GFPLAIN250 0.15 0.12 0.07 0.04 0.02 0.01
 RFSM 0.59 0.61 0.54 0.44 0.31 0.13
 Nile - 1020034170
 GFPLAIN250 0.52 0.45 0.35 0.24 0.15 0.06
 RFSM 0.27 0.42 0.51 0.5 0.37 0.19
 Madagascar - 1020035180
 GFPLAIN250 0.32 0.42 0.41 0.34 0.24 0.12
 RFSM 0.4 0.39 0.31 0.21 0.13 0.06
 Chad - 1020040190
 GFPLAIN250 0.41 0.29 0.19 0.12 0.07 0.03

 Table S8 - Validation Part 3 Results - Hit Rate Scores for each GFM Agreement Threshold

 GFM Agreement Threshold
 Basin Flood Map ≥1 ≥2 ≥3 ≥4 ≥5 6
 RFSM 0.32 0.54 0.68 0.78 0.85 0.9
 East Africa - 1020000010
 GFPLAIN250 0.45 0.65 0.73 0.76 0.76 0.73
 South Africa - RFSM 0.37 0.62 0.76 0.87 0.93 0.97
 1020011530 GFPLAIN250 0.39 0.58 0.65 0.69 0.67 0.63
 RFSM 0.47 0.67 0.79 0.88 0.94 0.97
 Congo - 1020018110
 GFPLAIN250 0.55 0.69 0.73 0.74 0.72 0.68
 RFSM 0.51 0.71 0.83 0.9 0.95 0.97
 Niger - 1020021940
 GFPLAIN250 0.68 0.84 0.92 0.96 0.97 0.97
 North Africa - RFSM 0.36 0.53 0.67 0.76 0.82 0.85
 1020027430 GFPLAIN250 0.22 0.37 0.56 0.7 0.83 0.92
 RFSM 0.65 0.8 0.89 0.94 0.97 0.98
 Nile - 1020034170
 GFPLAIN250 0.65 0.73 0.72 0.68 061 0.55
 Madagascar - RFSM 0.28 0.45 0.61 0.74 0.85 0.91
 1020035180 GFPLAIN250 0.34 0.51 0.62 0.7 0.77 0.8
 RFSM 0.49 0.64 0.73 0.79 0.83 0.86
 Chad - 1020040190
 GFPLAIN250 0.74 0.85 0.92 0.95 0.98 0.99

 Table S9 - Validation Part 3 Results - Bias Scores for each GFM Agreement Threshold

 GFM Agreement Threshold
 Basin Flood Map ≥1 ≥2 ≥3 ≥4 ≥5 6
 East Africa -
 RFSM 0.36 0.72 1.1 1.66 2.65 5.35
 1020000010 GFPLAIN250 0.73 1.46 2.24 3.34 5.36 10.94
 South Africa -
 RFSM 0.42 0.86 1.29 1.87 2.68 4.4
 1020011530 GFPLAIN250 0.58 1.19 1.78 2.58 3.69 6.06
 RFSM 0.52 0.86 1.2 1.66 2.42 4.32
 Congo - 1020018110
 GFPLAIN250 0.76 1.25 1.75 2.42 3.53 6.3
 Niger - 1020021940 RFSM 0.6 1.1 1.5 2.21 3.46 7.06
 9
GFPLAIN250 1.09 1.83 2.71 4 6.27 12.79
 North Africa - RFSM 1.03 3.51 10.03 25.6 69.3 266.4
 1020027430 GFPLAIN250 0.71 2.45 7 17.87 48.36 185.89
 RFSM 0.75 1.13 1.53 2.09 3.08 3.63
 Nile - 1020034170
 GFPLAIN250 0.89 1.33 1.81 2.47 7.66 9.05
 Madagascar - RFSM 0.29 0.52 0.81 1.24 2.13 2.96
 1020035180 GFPLAIN250 0.41 0.72 1.13 1.73 4.82 6.71
 RFSM 0.71 1.3 2.14 3.54 6.24 14.2
 Chad - 1020040190
 GFPLAIN250 1.55 2.83 4.66 7.73 13.63 31

In the Part 3 of the validation the same UDA threshold as the GFPLAIN250 map (1000 km2) was applied to the RFSM
map. Three different performance scores were then calculated for both of these maps in each basin in Africa. In
terms of CSI (Table S7), the RFSM map outperformed the GFPLAIN250 map in almost all the basins in Africa. The bias
scores (Table S9) for the GFPLAIN250 map were also higher than the RFSM map’s bias scores, suggesting that
GFPLAIN250 overpredicts the 100-year flood to a greater degree than the RFSM map.

It should be noted that the GFPLAIN250 map was not intended to map the ‘100-year’ flood, but rather to identify
floodplain boundaries (Nardi et al., 2019). Additionally, in the North Africa basin, which contains the majority of the
Sahara desert, GFPLAIN250 and a few of the global flood models apply masks that exclude these areas from the
analysis. This explains the low validation scores in this basin with respect to the other basins in Africa. We chose not
to apply any mask in these areas for two reasons. Firstly, there is little to no population in these areas, so applying /
not applying a mask would have little impact on the final results. Secondly, applying a mask could mistakenly remove
areas that do contain rivers. This is evident in the Nile Basin in Figure S10. The mask applied to the GFPLAIN250
removes a portion of the Nile River in Northern Sudan.

We have shown, in our validation of the RFSM against the aggregated output of six GFMs, that the RFSM does a
good job at capturing areas where there is high agreement between the GFMs. It also does a better job at predicting
the 100-year flood extent than existing global geomorphological floodplain datasets.

 10
Figure S5. Overlap of the RFSM and GFPLAIN250 maps with the 100-year return period aggregated global flood model map (Trigg et al., 2016a)
in the East Africa Basin (1020000010).
 11
Figure S6. Overlap of the RFSM and GFPLAIN250 maps with the 100-year return period aggregated global flood model map (Trigg
et al., 2016a) in the South Africa Basin (1020011530).

 12
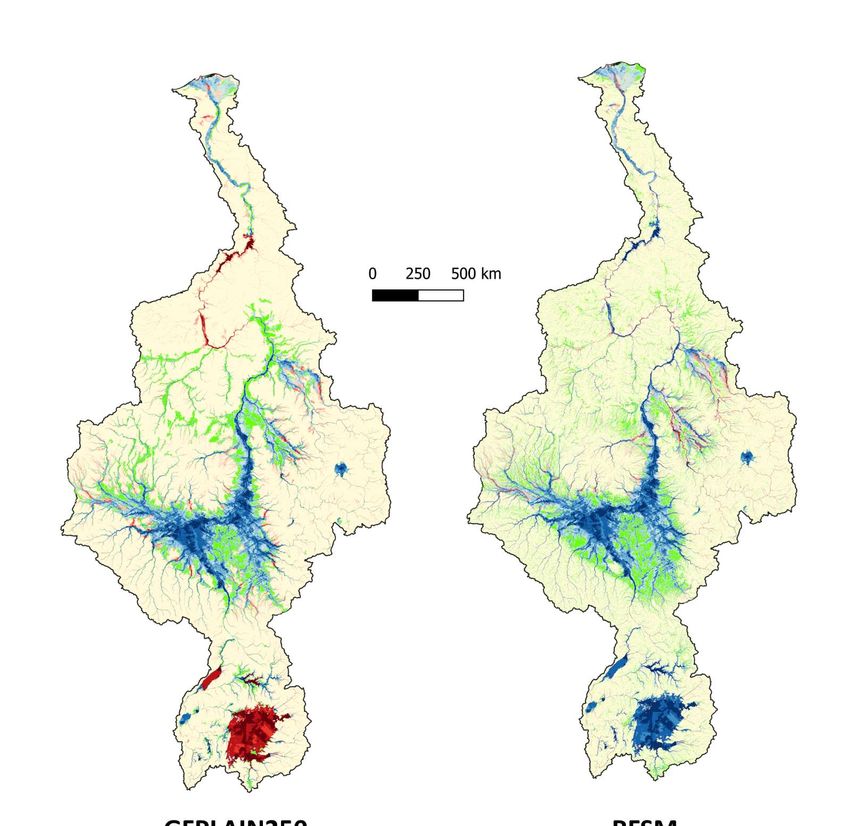
Figure S7. Overlap of the RFSM and GFPLAIN250 maps with the 100-year return period aggregated global flood model map
(Trigg et al., 2016a) in the Congo Basin (1020018110).

 13
Figure S8. Overlap of the RFSM and GFPLAIN250 maps with the 100-year return period aggregated global flood model map
(Trigg et al., 2016a) in the Niger Basin (1020021940).

 14
Figure S9. Overlap of the RFSM and GFPLAIN250 maps with the 100-year return period aggregated global flood model map
(Trigg et al., 2016a) in the North Africa Basin (1020027430).

 15
Figure S10. Overlap of the RFSM and GFPLAIN250 maps with the 100-year return period aggregated global flood model map
(Trigg et al., 2016a) in the Nile Basin (1020034170).

 16
Figure S11. Overlap of the RFSM and GFPLAIN250 maps with the 100-year return period aggregated global flood model map
(Trigg et al., 2016a) in the Madagascar Basin (1020035180).

 17
Figure S12. Overlap of the RFSM and GFPLAIN250 maps with the 100-year return period aggregated global flood model map
(Trigg et al., 2016a) in the Chad Basin (1020040190).

 18
S2.2 Validation Against Observed Events
 In a follow up study to the Trigg et al. (2016b) GFM intercomparison study, Bernhofen et al. (2018b) did a
 comparative validation of 6 GFMs against observed flood events in Nigeria and Mozambique. The two flood events
 used for validation were the 2012 floods in Nigeria and the 2007 floods in Mozambique. Validation was split into
 three hydraulically diverse analysis regions: two in Nigeria and one in Mozambique. The analysis areas in Nigeria
 were Lokoja, which is a narrow, confined floodplain that sits at the confluence of the Niger and Benue rivers; and
 Idah, which sits downstream of Lokoja and is a flat extensive floodplain. The analysis area in Mozambique is Chemba,
 which is a multichannel portion of the lower Zambezi river. Six global flood models were tested in total, GLOFRIS
 (Winsemius et al., 2013), JRC (Dottori et al., 2016c), U-Tokyo (Winsemius et al., 2013), ECMWF (Pappenberger et al.,
 2012), CIMA-UNEP (Rudari et al., 2015), and Fathom (Sampson et al., 2015). The study found varied performance
 between the GFMs, with some models scoring very well and others not very well (Bernhofen et al., 2018b).

Figure S13. (a) Overlap of modelled 100-year flood extent and observed flood events in the three validation regions for 6 global
flood models and the RFSM. (b) Performance scores for 6 global flood models and the RFSM in the three validation regions.
Figure adjusted from Bernhofen et al. (2018b).

 19
Here, we use the validation outputs from Bernhofen et al. (2018a) to see how the RFSM map compares when
validated against the same observed flood events as six other GFMs. We use the three performance scores outlined
in the Calibration section (equations S1-S3). These are the same scores used in the Bernhofen et al. (2018b) study.
We use the 100-year return period extents for each of the six GFMs for our validation. The overlap between the
models and the observed events can be visualized in Figure S13a and the performance scores for each of the models
can be visualized graphically in Figure S13b.

Across the three study regions, the RFSM consistently scores amongst the best GFMs in terms of CSI. In Chemba, the
RFSM CSI score is the higher than any of the GFMs. In both basins in Nigeria, the RFSM has the second highest Bias
score. The low river initiation threshold of the RFSM map (10 km2 UDA) contributes to this overprediction. You can
see in Figure S13a that a number of tributaries are included in Lokoja on which there is no flooding. Similarly, in Idah
several floodplain channels not modelled by the other GFMs are represented in the RFSM, resulting in a larger flood
extent and higher overprediction within the floodplain.

We’ve shown that the RFSM map performs similarly to the best performing GFMs when validated against historical
flood events in three regions in Nigeria and Mozambique. This indicates that the RFSM does a good job of mapping
the flood susceptibility of rivers and is appropriate for use in this study.

 20
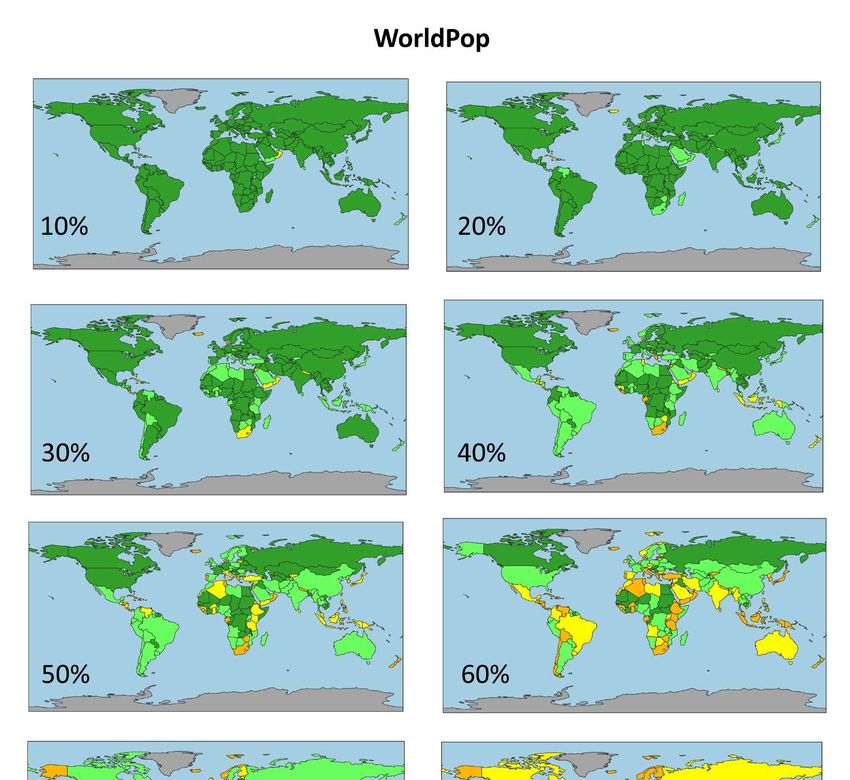
S3 Top 50 Countries Exposure

Figure S14. WorldPop calculated flood exposure. (a) Top 50 most exposed countries in terms of total flood exposure. (b) Top 50 most
exposed countries in terms of normalized flood exposure (normalized to country’s total population)

 21
Figure S15. HRSL calculated flood exposure. (a) Top 50 most exposed countries in terms of total flood exposure. (b) Top 50 most
exposed countries in terms of normalized flood exposure (normalized to country’s total population). Note: flood exposure is
calculated only for the 168 countries where HRSL is available. For countries missing from this analysis see Table S7. 22
S4 HRSL Missing Countries

Table S10. Countries not mapped by HRSL (at time of writing). These countries were not represented in any of the results
calculated using the HRSL dataset.

 Aaland Islands Gibraltar Pakistan
 Afghanistan Guernsey Palestine
 Antarctica Iran Russia
 Andorra Isle of Man Saint Pierre and Miquelon
 Armenia Israel Saint-Barthelemy
 Azerbaijan Jersey Saint-Martin (French)
 Bhutan Kosovo Sint Maarten (Dutch)
 Brunei Kuwait Somalia
 Canada Laos South Sudan
 China Lebanon Sudan
 Cuba Luxembourg Sweden
 Curacao Martinique Sweden
 Cyprus Montserrat Syria
 Denmark Morocco Turkey
 Falkland Islands Myanmar Ukraine
 Faroe Islands Norfolk Island Vatican City
 Finland North Korea Venezuela
 Georgia Norway Yemen

 23
S5 GFM Coverage Maps

 Figure S16. What size GFM river initiation threshold is required to capture _% of a country’s total GFM flood (>50 km2) exposure.
 Each map is a different target percentage. This map is intended to inform users of GFMs about the appropriate GFM to use in a
 given country. Results were calculated using WorldPop population data.

 24
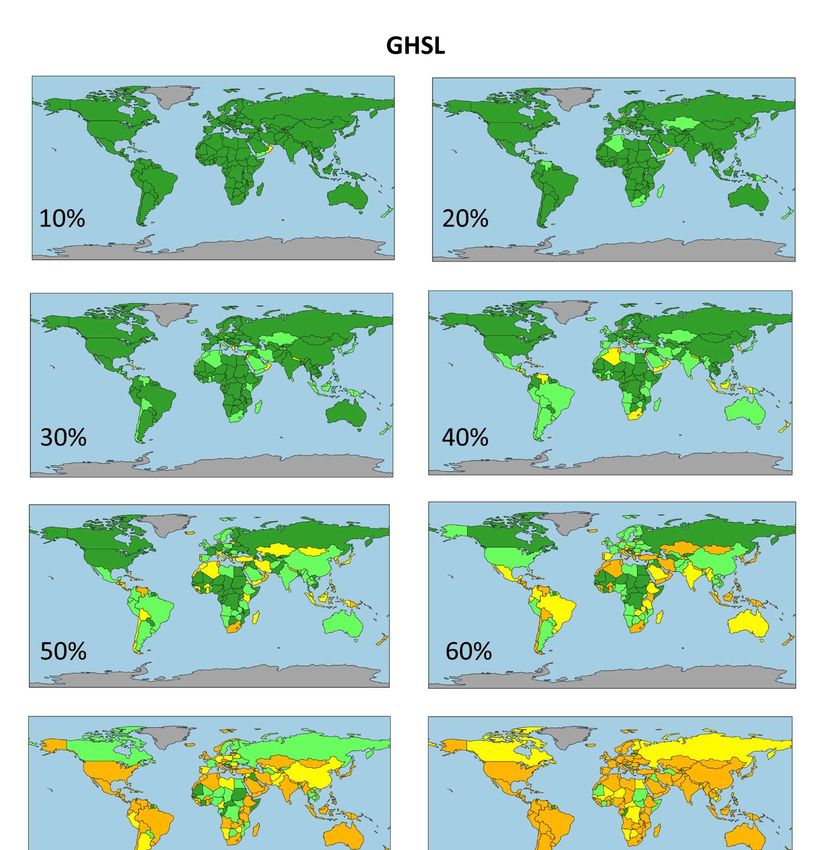
-
Figure S17. What size GFM river initiation threshold is required to capture _% of a country’s total GFM flood (>50 km2) exposure.
Each map is a different target percentage. This map is intended to inform users of GFMs about the appropriate GFM to use in a
given country. Results were calculated using GHSL population data. 25
Figure S18. What size GFM river initiation threshold is required to capture _% of a country’s total GFM flood (>50 km2) exposure.
Each map is a different target percentage. This map is intended to inform users of GFMs about the appropriate GFM to use in a
given country. Results were calculated using HRSL population data. 26
S6 References
BECK, H. E., ZIMMERMANN, N. E., MCVICAR, T. R., VERGOPOLAN, N., BERG, A. & WOOD, E. F. 2018. Present and
 future Köppen-Geiger climate classification maps at 1-km resolution. Scientific Data, 5, 180214.
BERNHOFEN, M. V., WHYMAN, C., TRIGG, M. A., SLEIGH, P. A., SMITH, A., SAMPSON, C., YAMAZAKI, D., WARD, P.,
 RUDARI, R., PAPPENBERGER, F., DOTTORI, F., SALAMON, P. & WINSEMIUS, H. C. 2018a. Analysis inputs for
 validation of six global flood models against observed flood events in Nigeria and Mozambique. Research
 Data Leeds Repository.
BERNHOFEN, M. V., WHYMAN, C., TRIGG, M. A., SLEIGH, P. A., SMITH, A. M., SAMPSON, C. C., YAMAZAKI, D., WARD,
 P. J., RUDARI, R., PAPPENBERGER, F., DOTTORI, F., SALAMON, P. & WINSEMIUS, H. C. 2018b. A first collective
 validation of global fluvial flood models for major floods in Nigeria and Mozambique. Environmental
 Research Letters, 13.
DOTTORI, F., ALFIERI, L., SALAMON, P., BIANCHI, A., FEYEN, L. & HIRPA, F. A. 2016a. Flood hazard map of the World -
 100-year return period. In: EUROPEAN COMMISSION, J. R. C. J. (ed.).
DOTTORI, F., ALFIERI, L., SALAMON, P., BIANCHI, A., FEYEN, L. & LORINI, V. 2016b. Flood hazard map for Europe, 100-
 year return period. In: EUROPEAN COMMISSION, J. R. C. J. (ed.).
DOTTORI, F., SALAMON, P., BIANCHI, A., ALFIERI, L., HIRPA, F. A. & FEYEN, L. 2016c. Development and evaluation of a
 framework for global flood hazard mapping. Advances in Water Resources, 94, 87-102.
LEHNER, B. & GRILL, G. 2013. Global river hydrography and network routing: baseline data and new approaches to
 study the world's large river systems. Hydrological Processes.
NARDI, F., ANNIS, A., DI BALDASSARRE, G., VIVONI, E. R. & GRIMALDI, S. 2019. GFPLAIN250m, a global high-
 resolution dataset of Earth’s floodplains. Scientific Data, 6, 180309.
PAPPENBERGER, F., DUTRA, E., WETTERHALL, F. & CLOKE, H. L. 2012. Deriving global flood hazard maps of fluvial
 floods through a physical model cascade. Hydrology and Earth System Sciences, 16, 4143-4156.
RUDARI, R., SILVESTRO, F., CAMPO, L., REBORA, N., BONI, G. & HEROLD, C. 2015. IMPROVEMENT OF THE GLOBAL
 FLOOD MODEL FOR THE GAR 2015.
SAMPSON, C. C., SMITH, A. M., BATES, P. B., NEAL, J. C., ALFIERI, L. & FREER, J. E. 2015. A high-resolution global flood
 hazard model. Water Resources Research, 51, 7358-7381.
TRIGG, M. A., BIRCH, C. E., NEAL, J., BATES, P., SMITH, A., SAMPSON, C., YAMAZAKI, D., HIRABAYASHI, Y.,
 PAPPENBERGER, F., DUTRA, E., WARD, P. J., WINSEMIUS, H. C., SALAMON, P., DOTTORI, F., RUDARI, R.,
 KAPPES, M. S., SIMPSON, A., HADZILACOS, G. & FEWTRELL, T. 2016a. Aggregated fluvial flood hazard output
 for six Global Flood Models for the African Continent. Research Data Leeds Repository.
TRIGG, M. A., BIRCH, C. E., NEAL, J. C., BATES, P. D., SMITH, A., SAMPSON, C. C., YAMAZAKI, D., HIRABAYASHI, Y.,
 PAPPENBERGER, F., DUTRA, E., WARD, P. J., WINSEMIUS, H. C., SALAMON, P., DOTTORI, F., RUDARI, R.,
 KAPPES, M. S., SIMPSON, A. L., HADZILACOS, G. & FEWTRELL, T. J. 2016b. The credibility challenge for global
 fluvial flood risk analysis. Environmental Research Letters, 11, 10.
WINSEMIUS, H. C., VAN BEEK, L. P. H., JONGMAN, B., WARD, P. J. & BOUWMAN, A. 2013. A framework for global
 river flood risk assessments. Hydrology and Earth System Sciences, 17, 1871-1892.

 27
You can also read