Safe Systems Synthesis: An International Scan for Domestic Application - Collaborative Sciences Center for ...
←
→
Page content transcription
If your browser does not render page correctly, please read the page content below
Safe Systems Synthesis: An
        International Scan for Domestic
                  Application
                                  Final Report

Prepared by:
Kari Signor
Wes Kumfer
Seth LaJeunesse
Daniel Carter
UNC Highway Safety Research Center
Prepared for:
Warren Smith, Mark Scaringelli, and Stacey Deans
Highway Safety Specialists
North Carolina Governor’s Highway Safety Program
June 28, 2018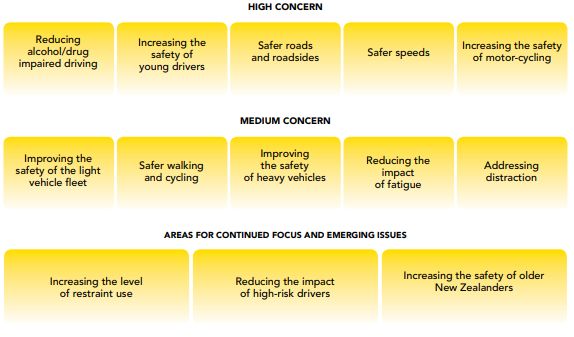
SAFE SYSTEMS SYNTHESIS

                                     INTRODUCTION
This report transmits the results of a wide-ranging literature and policy scan of international
practices that fall under the scope of Safe Systems. Safe Systems, though difficult to define, is
generally regarded as a framing philosophy of roadway transportation that entails the needs and
efforts of all involved stakeholders in promoting a safe and healthy transportation system.
Although the focus of Safe Systems is generally a reduction-to-zero of fatal and injury crashes, a
more general reduction of total crashes and an overall improvement of health are in view. In this
report, we document how we arrived at this general understanding of Safe Systems, and the
practices that inform such an approach to road safety. It is our hope that this report contributes a
much-needed meta-analysis to the transportation safety field and informs future policy decisions
at all levels of government.
Nature of the Problem
According to the World Health Organization, road traffic crashes claim the lives of more than
1.25 million people around the world annually and are the leading cause of death in young
people between the ages of 15 and 29 years old [1]. In addition, the economic and societal costs
from these incidents are tremendous. In the United States in 2016, The National Safety Council
estimated that the costs of road trauma (deaths, injuries, and property damage) were $432.5
billion [2]. Great improvements in road safety have been achieved over the last few decades from
advancements in vehicle safety, road design, and safety education; however, the number of
traffic-related fatalities and injuries is still significant. In recent years, these numbers have
increased in countries of all economic backgrounds, including the U.S. [3].
This global epidemic has prompted local and national governments and road safety practitioners
to seek out new strategies to address the increasing risks on our roadways. In 2010, The United
Nations General Assembly proclaimed 2011 to 2020 the “Decade for Action for Road Safety.”
Co-sponsored by 100 countries and endorsed by leading institutions, including the World Bank
and the World Health Organization, this declaration aims to “stabilize and then reduce the
forecast level of road traffic fatalities around the world by increasing activities conducted at the
national, regional and global levels” [4]. The overall goal is to prevent five million road traffic
deaths and 50 million injuries worldwide by focusing on road safety management, road
infrastructure, vehicle safety, road user behavior, road safety education, and crash response [5].
During the 1970s, the United States had the safest roads in the world; however, we now lag far
behind when it comes to improving road safety outcomes. Leonard Evans, the president of
Science Serving Society, compared traffic fatality trends in the U.S. to those of 25 other
countries - that we once surpassed in safety - and found that all countries outperformed the U.S.
in reducing fatalities since reaching their all-time highest death toll [6]. As an example, fatalities
in Sweden and the U.S. both peaked in 1972, but by 2011 Sweden had reduced traffic fatalities
by 81%, while road fatalities in the U.S. only declined 41%. Compared to the average traffic
fatality reduction across three other similar countries, the difference in progress is equally

                                                  1
SAFE SYSTEMS SYNTHESIS
dramatic. Between 1979 and 2002, the average reduction across Great Britain, Canada, and
Australia was 49%. In the U.S., our reduction was 16%, resulting in 200,000 more traffic deaths
[6]. If the U.S. had kept pace with even the average rate of decline of all 25 comparison countries
(1972-2011), over 16,330 deaths may have been prevented [6].
More recent data show that circumstances are worsening. The road toll in the U.S. increased
more than 8% between 2014 and 2015 (2,741 additional deaths) and another 5.5% in 2016.
Compared to five years ago, the increase is nearly 10% [7]. In 2015, crashes were the leading
cause of death for those between the ages of 17 and 23 [8]. According to official data released by
the U.S. Department of Transportation, deaths related to drunk driving, speed, and failing to use
a restraint all increased in 2016, as did pedestrian and bicyclist deaths. Official data for 2017
have not yet been released, but early estimates from the first nine months of 2017 suggest
fatalities will be similar to 2016 [9].
North Carolina data are equally alarming. Traffic fatalities have risen every year over the last
five years and follow the national trends in 2015 and 2016, with fatalities being the fifth highest
among all states in 2016 [10]. Injuries and crashes have also increased. According to an analysis
using National Highway Safety Traffic Administration fatality data in five different categories,
North Carolina tied Delaware as the eighth worst in driving failures resulting in traffic death and
injury last year [11]. One possible explanation for this high rate may be a boom in population.
The U.S. Census Bureau reports growth of almost 8% in North Carolina since 2010 [12]. With
increased population comes increased exposure, and, statistically, more cars lead to more
conflicts on the road.
What are the primary driving behaviors associated with these fatalities? Over a 10-year period,
speeding was a factor in 31% of all traffic deaths nationwide [13] and nearly half of all
occupants who were killed were not wearing seatbelts [14]. About 28% of fatal accidents
involved drivers with a blood alcohol content (BAC) greater than 0.08 g/100ml [15]. Speeding,
alcohol, and failure to use a restraint were factors in a similar portion of North Carolina fatalities
during 2016, with lane departure also reported as a contributing factor in over half of all fatalities
[16].
A Potential Solution
Despite these major concerns regarding traffic safety in the United States, significant progress in
highway safety has been made over the last few decades. In 1965, 40,000 people were killed in
motor vehicle accidents at a time when many fewer cars were on the road and no governing road
safety body existed [17]. However, in 1966 a new era of road safety emerged when the National
Traffic and Motor Vehicle Safety Act and Highway Safety Act were passed.
According to then-President Lyndon B. Johnson, almost three times the number of Americans
had died since the turn of the century as a result of road crashes than had died in all previous
wars. This was seen as a crisis that called for immediate government action, and new laws put a
number of provisions in place to address occupant protection, vehicle safety, and roadway design
[18]. Since this time, numerous actions have contributed greatly to reducing the road toll. Some
2SAFE SYSTEMS SYNTHESIS
notable measures included airbags, integrated seat belt and shoulder harnesses, child restraint
systems, advanced vehicle crashworthiness and vehicle ratings (5-Star Safety Ratings Program),
and various regulations limiting driver behavior such as the graduated driver licensing and Zero
Tolerance Laws for drivers under the age of 21.
Although the road toll in the U.S. has declined, overall, since its peak in the 1970s, our progress
has slowed dramatically and may even be reversing. Public safety experts agree that preventing
road deaths and serious injuries can be achieved, but this requires a fundamental shift in how we
think about and manage our road transportation systems; it is no longer sufficient to merely
address driver behavior [19] [20]. Other developed countries have demonstrated that significant
progress can be made with strong leadership and system-wide accountability [21]. Clearly much
more can and must be done in the U.S. to reduce our increasing road toll, and trends indicate that
actions must be directed toward every aspect of the transportation system [20].
Traditionally, mobility within the transport system has been prioritized over safety, and road
users have been viewed as the “problem” [19]. Efforts to improve road safety have generally
focused on crash reduction and adapting drivers to the road transport system [22] [23]. By
definition, the cost-benefit framework suggests that there is an optimum number of fatalities and
that safety is an inherent trade-off in the transportation system [23]. However, experts and the
public view this as an antiquated and unproductive way of thinking about road safety.
A number of countries that have experienced the greatest improvements in road safety have
incorporated a Safe Systems approach into their strategies [24]. A Safe Systems approach
challenges traditional ideas by asserting that no one should be killed or seriously injured from
using the road network. This assertion is a moral imperative; transportation systems must be
healthy and accommodating to all road users [19]. Safe Systems is a holistic, long-term vision
that deaths and injuries are preventable, not inevitable. This concept was first adopted by Sweden
and the Netherlands as part of their innovative road safety strategies, Vision Zero and
Sustainable Safety.
The Safe System focuses attention on specific elements of the road transportation system - safe
roads and roadsides, safe speeds, safe vehicles, and safe road use. More recently, the United
Nations has expanded this to include post-crash response [25]. The Safe System is also defined
by four core principles [25]:
Humans are fallible, but no reasonable mistake should lead to death or serious injury.
The road system should be designed around the capacity of the human body to tolerate
external forces.
The responsibility for road safety should be shared by all parties, including road users
and system designers.
All parts of the system must be strengthened to multiply their effects.
As stated in the first core principal of Vision Zero, human beings make mistakes, and even small
mistakes within the road transport system can lead to disastrous consequences. Instead of
3SAFE SYSTEMS SYNTHESIS
conforming human behavior to the design of the road system, engineers and road safety
practitioners should adapt the system to road-user behavior. Second, crashes should be expected,
but the kinetic energy of collisions should be managed such that crash energy does not exceed
the human tolerances to those forces [26]. Third, maintaining a safe transport system should not
be the sole responsibility of drivers [21]. Finally, all components of the road transport system
must be enhanced to ensure that road users are protected in the event one part of the system fails.
Sweden demonstrated that incorporating the fundamental principles of the Safe System can have
a profound positive impact on road safety outcomes. Other countries - including Australia, New
Zealand, and the Netherlands - have recognized the need to explore more effective ways to
mitigate the road safety crisis and have modeled their road safety programs after Vison Zero.
In the U.S., a number of cities and states have also begun to adopt the Safe Systems principles,
including New York City, San Francisco, Chicago, Portland, and Minnesota. Since launching
Vision Zero in 2014, New York City has achieved four straight years of traffic fatality decline
and now reports 2017 as the safest year on record [27]. Last year, San Francisco also recorded
the fewest traffic deaths in over 100 years [28]. Road traffic fatalities in Minnesota dropped by
40% over 10 years after implementing Safe Systems [29].
Report Overview
In this Synthesis, we examine four countries that have the most well-established Safe Systems
programs: Sweden, the Netherlands, Australia, and New Zealand. Each of these countries have
structured their approaches to road safety around the Safe Systems core principles and
implemented innovative measures to address their specific priorities. We framed our examination
by answering five questions for each of the representative nations:
1. What was the motivation for implementing a Safe Systems program?
2. What exactly was implemented to improve road safety?
3. What challenges did the nation face in its implementation?
4. How effective was the implementation?
5. What recommendations, if any, does this nation have for others seeking road safety
improvements?
This report is not an exhaustive review of every action undertaken under these strategies but an
overview of what led to each Safe Systems approach, the general areas of concern in each
country, and a summary of proposed actions and measures implemented to address these road
safety concerns. Information about their effects on improving road safety is limited, but findings
are included where possible. We also briefly document three other nations with Safe Systems-
adjacent programs that advocate many of the same principles. Some traffic safety measures, such
as speed reduction, traffic calming, and stronger enforcement, have already been shown to be
successful here in the U.S. Other countermeasures show great promise but may need to be
assessed further to be effective in the physical and cultural context of the U.S.
4SAFE SYSTEMS SYNTHESIS
INTERNATIONAL STUDY
Sweden
Motivation and Trends
Sweden is generally credited, along with the Netherlands, with initiating the Safe Systems
approach to roadway safety [30] through its careful and rigorous approach to reorganizing the
top-down structures responsible for transportation safety management [25]. Sweden has a
reputation for excellence in road traffic safety and has been praised for its leadership and success
in managing road safety issues for decades. Overall, road deaths in Sweden have declined
sharply since the 1970s, despite a growing population and a steady increase in traffic volume. In
2016, Sweden had the fewest number of road fatalities on record (254) and still maintains the
lowest road traffic fatality rate worldwide with approximately 2.9 deaths per 100,000 people
[31].
This was not always the case. Annual road deaths in Sweden peaked at
Sweden has the close to 1,300 in the late 1970s then steadily declined in the years that
lowest road followed until the late-1980s, when numbers plateaued, hovering at
fatality rate in the about 500 deaths per year [32]. The road transport system carried a
world with considerably higher risk level than other modes of transport [22]. This
approximately reality was completely unacceptable to road safety practitioners.
2.9 deaths per Around this same time (1994) the lives of over 500 Swedish citizens
100,000 people. were lost in one of the worst maritime disasters in modern times when
a ferry carrying over 800 passengers sank in the Baltic Sea. This
tragedy, along with diminishing gains in the road toll, strengthened
interest in improving public transport safety and set the stage for Sweden’s comprehensive road
safety strategy, Vision Zero [33].
Developed by the Director of the Swedish National Road Administration, Claes Tingvall, and the
Minister of Transport, Ines Usmann, Vision Zero aimed to address this road safety problem using
a comprehensive Safe Systems approach. With strong support across all party lines, the concept
was written into law by Swedish Parliament in 1997 and proposed that “no-one shall be killed or
seriously injured as a consequence of the transportation system” [22] [33].
Based on Safe Systems principles, Vision Zero emphasized that the responsibility for road safety
should be shared by both designers and road users [33]:
1. The designers of the system are always ultimately responsible for the design, operations
and use of the road transport system, and are thereby responsible for the level of safety
within the entire system.
2. Road users are responsible for following the rules for using the road transport system set
by the system designers.
5SAFE SYSTEMS SYNTHESIS
3. If road users fail to obey these rules due to a lack of knowledge, acceptance or ability, or
if injuries occur, the system designers are required to take the necessary steps to
counteract potential death or serious injury.
Policies and Implementation
Following the Vision Zero legislation, the Swedish Government launched a short-term action
plan that proposed 11 priority areas. These priorities included focusing on the most dangerous
roads, improving traffic safety in built-up areas, and placing more emphasis on the
responsibilities of road users and transport system designers (Figure 1).
1. A focus on the most dangerous roads (e.g. priority for installing centre-guardrails for eliminating
head-on collisions, removing obstacles next to roads, etc.)
2. Safer traffic in build-up areas (e.g. a safety analysis of street networks in 102 municipalities led to
reconstruction of streets; the efforts are continuing.)
3. Emphasis on the responsibilities of road users (e.g. creating more respect of traffic rules in
particular with regard to speed limits, seat belt use, and intoxicated driving.)
4. Safe bicycle traffic (e.g. campaign for using bicycle helmets, a voluntary bicycle safety standard.)
5. Quality assurance in transport work (e.g. public agencies with large transportation needs will
receive traffic safety [and environmental impact] instructions on how to assure the quality of their
own transportation services and those procured from outside firms.)
6. Winter tyre replacement (e.g. a new law mandating specific tyres under winter road conditions.)
7. Making better use of Swedish technology (e.g. promoting the introduction of technology—available
or to be developed—the relatively soon can be applied, such as seat belt reminders, in-car speed
adaptation systems [ISA], alcohol ignition interlocks for preventing drinking and driving, and
electronic driver licenses.)
8. Responsibilities of road transport system designers (e.g. establishment of an independent
organization for road traffic inspection is proposed by a commission of inquiry on the
responsibilities of the public sector and the business community for safe road traffic.)
9. Public responses to traffic violations (e.g. a commission of inquiry is reviewing existing traffic
violation rules in the light of the Vision Zero principles and of ensuring due process of the law.)
10. The role of voluntary organizations (e.g. the government is evaluating the road safety work of the
“Nationalföreningen för trafiksäkerhetens främjande” [National Society for Road Safety or NTF]
and its use of state funds.)
11. Alternative forms of financing new roads (e.g. possibilities are studied for other forms of
supplementing public financing of major road projects.)
Figure 1: Priority Areas for Vision Zero [33]
6SAFE SYSTEMS SYNTHESIS
A number of key transportation experts also outlined specific ways to mitigate Sweden’s road
safety problem. Tingvall and Monash University Accident Research Centre’s Narelle Haworth
proposed several strategies that they believed could easily be adopted independent of any
political sphere [34]:
gradually aligning vehicle speed to the inherent safety of the system by rating roadways
according to their infrastructure;
improving vehicles to address driver behavior issues by incorporating seat belt interlocks,
alcohol interlocks, and intelligent speed limiters; and
motivating the community to use the system in a safer way.
They also emphasized that societal benefits, such as mobility within
Mobility cannot the transportation system, should never be prioritized at the expense of
exist at the life and health, and when a death or serious injury occurs, steps must
expense of life be taken to prevent a similar event [34].
and health. Roger Johansson of the Swedish Road Administration also
summarized how incompatible traffic elements should be separated,
including diverse road users, based on human tolerances to physical violence, as shown in Figure
2 [35]. He emphasized that when separation of road users was warranted, this separation should
always be by physical means, such as a barrier. This approach to design places a greater
emphasis on more rigid stratification of functional use for roadways; roadways with high
mobility demands should not create situations through open access that expose road users to
excess risk.
7SAFE SYSTEMS SYNTHESIS
1. Vulnerable road users should not be exposed to motorised vehicles at speeds
exceeding 30 km/h.
2. If 1. cannot be satisfied then separate or reduce the vehicle speed to 30 km/h.
3. Car occupants should not be exposed to other motorised vehicles at speeds
exceeding 50 km/h in 90 crossings.
4. If 3. cannot be satisfied then separate, or reduce the angle, or reduce the speed to
50 km/h.
5. Car occupants should not be exposed to oncoming traffic (other vehicles of
approximately same weight) at speeds exceeding 70 km/h or 50 km/h if oncoming
vehicles are of considerably different weight (Fig. 3).
6. If 5. cannot be satisfied then separate, homogenize weights or reduce speeds to 70
(50) km/h.
7. Car occupants should not be exposed to the road side at speeds exceeding 70 km/h,
or 50 km/h if the road side contains trees or other narrow objects (Fig. 4).
8. If 7. cannot be satisfied separate or reduce speed to 70 (50) km/ h.
Figure 2: Human tolerance to speed exposure [35]
Drawing upon these guiding principles of road user separation and speed reduction, Sweden
implemented multiple roadway measures to improve safety for all users. In application, Vision
Zero primarily focused on speed limit reductions, road design improvements, and extensive data
analysis and monitoring [36].
Transportation agencies implemented Large-scale speed limit reduction to 30 km/h (19 mph) in
many urban areas which previously had default speeds of 50 km/h (31 mph) [37] [38]. Beginning
in 2008, they also implemented speed limit reductions of 10-20 km/h (6-12 mph) on several rural
road types with pre-existing speed limits of between 90-110 km/h (56-68 mph), shown in Table 1
[36]. These reductions purportedly reduced deaths from 41% to 14%, although no significant
change in serious injuries was observed [39]. A large-scale road safety camera program was also
implemented in 2006 to encourage drivers to comply with posted speed limits. Adherence to
speed limits improved from 50% in the 1990s to more than 80% across Sweden and 95% at
camera sites as of 2014 [40].
8SAFE SYSTEMS SYNTHESIS
Table 1: Speed limit changes in Sweden [36]
Type of Road Description
Motorways where the speed limit increased from 110 to 120
1. Motorways, 110 → 120 km/h
km/h
A continuous three-lane road with alternating passing lanes
2. 2+1 roads, 90 → 100 km/h
and the two directions of travel separated by a median barrier
A continuous three-lane road with alternating passing lanes
3. 2+1 roads, 110 → 100 km/h
and the two directions of travel separated by a median barrier
4. Rural roads, 110 → 100 km/h Two-lane rural roads
5. Rural roads, 70 → 80 km/h Two-lane rural roads
6. Rural roads, 90 → 80 km/h Two-lane rural roads
7. Rural roads, 90 → 70 km/h Two-lane rural roads
Transportation agencies also made Structural improvements to roads and roadsides. Efforts
included constructing center median wire rope barriers and roadside barriers to roadways as well
as removing dangerous objects from roadsides [36]. Another effort was the conversion of three-
lane undivided roads to a “2+1” road configuration. In a “2+1” design, a continuous flexible
center barrier separates opposing lanes of traffic, but the presence of a second lane alternates
from one direction of travel to the other as the location of the barrier shifts toward or away from
the single lane. It is estimated that fatalities on these roadways have been reduced by up to 90%
[41].
Multiple actions pertaining to vehicle safety were also implemented. The use of winter tires
became mandatory in 1999. Beginning in 2005, laws required 70% of new cars to have seat-belt
reminders [35]. Following this policy, the seat-belt wearing rate increased from 92% to 99%.
Cycle helmets became mandatory for those aged 15 years and younger [42].
To assess these gains in safety and to ensure that countermeasures were properly evaluated,
Swedish authorities also established a rigorous data collection and safety measurement program.
Since 1997, Sweden has conducted individual investigations of every fatal car crash to separate
which factors contributed to the crash and which contributed to the fatality. Based on these
factors and what aspect of road safety failed, crashes fall into one of three groups: “excessive
force,” “excessive risk,” and “beyond system recommendations” [33].
Road safety professionals in Sweden also monitor numerous other metrics related to roadway
safety, including drunk driving, speeding, seatbelt use, cyclist helmet use, emergency services
rescue times, and motor vehicle crashworthiness [36]. Analysts combine hospital data with
9SAFE SYSTEMS SYNTHESIS
police reports and regularly review and share injury reports at national conferences each year. In
addition, agencies routinely identify locations on roadways that share similar attributes to
problematic locations on roadways to apply safety measures before road safety issues develop.
Efficacy of the Solutions
Given the number of factors that can influence a system, it can be
Sweden reports difficult to attribute road safety trends to any one specific cause.
95% compliance However, several positive trends have been observed in Sweden since
with red-light Vision Zero was implemented. Fatalities declined by 50% between
cameras. 2000 and 2014, and pedestrian fatalities, specifically, declined by 50%
between 2009 and 2014 [43]. Fatalities of children seven years of age
and younger also plummeted, from 58 in 1970 to one in 2012 [44].
Other road safety improvements, as mentioned, include:
Reduction of 90% of fatal crashes on three-lane undivided roads [41]
Seat-belt compliance at 99% [42]
95% compliance with red-light cameras at enforcement sites [40]
Sweden had 254 road fatalities in 2017, a slight decline from 2016 and its lowest number ever
recorded. Despite this achievement, significant drops in fatalities have stagnated over the last
several years (Figure 3). The majority of these deaths were motorists and motorcyclists (67%)
while approximately one-fourth of deaths were of pedestrians and cyclists (17). These
stagnations are not themselves indications of failure but highlight many of the difficulties and
challenges still faced by countries that have adopted Safe Systems approaches. These challenges,
and the potential opportunities for improvement they invite, are discussed in the next subsection
[31].
10SAFE SYSTEMS SYNTHESIS
Figure 3: Road traffic fatalities in Sweden 2006-2017
Challenges and Opportunities
Despite widespread support of Sweden’s Vision Zero, there was some early opposition from
industry experts. Matts-Åke Belin, a Vision Zero architect and road safety strategist with the
Swedish Transport Administration, has said that the one of the main challenges of implementing
the strategy was shifting system stakeholders’ mindsets from “cost-benefit” to “Safe Systems,”
i.e., placing a greater emphasis on health and autonomy [37]. In addition, since traditional
approaches focused on changing human behavior, road engineers were reluctant to accept shared
responsibility for roadway safety. However, in an interview with the ITE Transportation Podcast,
Belin emphasized how critical a role traffic engineers play in enhancing safety by comparing the
consequences of a crash at a 4-lane intersection with a traffic light to a crash at an intersection
controlled by a roundabout [23].
For example, Belin illustrated that at an intersection controlled with a traffic light, the total
number of conflicts will be reduced, but any crashes that occur will likely be severe due to the
high speed and high-energy transfer of those impacts. At a roundabout, traveling speeds are
reduced by design and crashes will inherently be much less severe. These aspects could literally
mean the difference between life and death. Since road engineers make these determinations of
roadway design, they ultimately bear the responsibility for the safety of the road user. For this
reason, Belin believes it is essential for road engineers to understand the Vision Zero philosophy
and to shift their mindsets dramatically to implement new road safety solutions [23].
11SAFE SYSTEMS SYNTHESIS
Although it may be initially difficult to encourage transportation engineers to adopt Safe Systems
principles, especially at the cost of mobility, reframing the argument beyond a simple cost-
benefit analysis and instilling a moral imperative for promoting safety and health may encourage
buy-in from these key stakeholders. An approach Sweden took early on to shift the paradigm was
to reorganize their road safety management structure from the ground up, so as to not promote
the idea that road safety is a process isolated from society, rather one that integrates stakeholders
from a wide variety of disciplines, including engineering [25].
Matts-Åke Belin believes that an approach like Vision Zero is transferable to road systems
around the world, but he emphasizes that strong political support is essential [23]. He also
emphasized that it is important to understand that the mechanical, scientific basis of Vision Zero
remains constant and is relevant in any system. Critics often cite a lack of accountability for risk
in Safe Systems approaches [45], but the data management and evaluation process implemented
by Sweden highlights a dedicated approach to measuring safety improvements and scientifically
responding to risks in the system. Human tolerances to violence and crash energies remain the
same. The approaches to resolving these problems, however, will be different because traffic
dynamics and aggregations of road users will vary from one locality to the next.
Belin also suggested that road safety practitioners focus on unprotected
The motivation road users when designing transportation systems, as they will set the
for Safe Systems standard for safety. Since North American society is more dependent
must be an upon motor vehicles, adapting the U.S. system to vulnerable road users
ethical like pedestrians and cyclists will pose a greater challenge than for
imperative to those regions with more diverse transportation systems [22].
mitigate death Most importantly, Belin believes that the motivation must come from
and serious the ethical imperative that fatalities and serious injuries in the transport
injury. system are unacceptable.
New Zealand
Motivation and Trends
Like Sweden, New Zealand traffic safety has improved dramatically over the last several
decades. Despite an increase in traffic volume, road deaths have declined by 50% since 1970
[46]. Between 1990 and 2000, road deaths and serious injuries attributed to drug and alcohol use
also declined significantly.
However, this progress was beginning to stabilize, and in 2007 New Zealand still had one of the
highest rates of road fatalities per capita in the developed world (about 10 per 100,000 residents)
[47]. New Zealand acknowledged that it would not meet 2010 targets to reduce deaths and
serious injuries under the status quo of road safety management. Other factors that had great
potential to influence the safety of road users were also emerging, including a growing and aging
12SAFE SYSTEMS SYNTHESIS
population, an increase in motorcycle use and overall traffic volume, and novel illegal drugs. To
address these road safety challenges, new strategies were needed.
In 2009, the New Zealand National Road Safety Committee (NRSC) proposed The Safer
Journeys Strategy, which was based on Safe Systems and envisioned “A safe road system that is
increasingly free of road deaths and serious injuries.” NRSC members included the Ministry of
Transport, the New Zealand Transport Agency, the New Zealand Police, the Accident
Compensation Corporation, and Local Government New Zealand, but many other supporting
members also played important roles [46] [47].
As part of this strategy, The New Zealand Minister of Transport, Hon Steven Joyce, released a
discussion document to the general public. The document outlined New Zealand’s achievements
in road safety, the proposed Safer Journeys vision and approach, and proposed over 60 possible
road safety initiatives under consideration. Many more initiatives were proposed than the
government expected to fund; however, this was intentional and provided a platform for public
discussion [46] [47].
These initiatives were placed into 13 priority areas broken into three groups: areas of high
concern, areas of medium concern, and areas for continued focus and emerging issues (Figure 4).
It was explained that high concern areas were those most likely to result in the greatest road
safety improvement. The five areas of highest concern included reducing alcohol/drug impaired
driving, increasing the safety of young drivers, safer roads and roadsides, safer speeds, and
increasing the safety of motorcycling. Some specific initiatives proposed to address high
priorities included reducing the legal adult blood alcohol limit from 0.08 to 0.05 g/100mL,
raising the driving age to 16 or 17, adopting lower speed limits in urban areas, and improving
motorcycle riding training [46] [47].
13SAFE SYSTEMS SYNTHESIS
Figure 4: New Zealand 'Safer Journeys Strategy Discussion Document' priority areas [47]
The document explained the relevance and scientific merit of each priority area, presented
relevant trends and statistics, and discussed various aspects of the proposed initiatives, including
benefits and limitations. During a two-month public consultation period, citizens were asked to
submit their choices for the top 10 or 20 initiatives and share general thoughts about how to
improve outcomes in each priority area [46] [47].
Overall, New Zealanders responded favorably to the Discussion Document and provided over
1,500 submissions to the Ministry of Transport. The public strongly supported most priority
areas but expressed interest in improving a few specific areas, shown in Table 2 [46] [47].
Table 2: Public support of “The Safer Journeys Strategy Discussion Document” priority areas
[46] [47]
Initiatives with strong public support Public desired more focus on
Lowering legal BAC limits Enforcement and compliance in all
areas
Raising driving age
Drivers and road users
Changing ‘give-way’ rules
Stronger penalties for repeat
Improving walking/cycling drug/alcohol offenses
infrastructure
14SAFE SYSTEMS SYNTHESIS
Citizens felt that the most emphasis should be placed on initiatives aimed at road users (one of
the four elements of a Safe System). Since submissions were disproportionately focused on this
one element, with less focus on safe speeds, roads, and vehicles, the Ministry of Transport
questioned whether the public fully understood the overall premise of the Safe Systems
approach. Not all issues that received strong support from the public were actually backed by
evidence, i.e., mandatory third party insurance was a popular proposed policy, but given that the
rate of insurance was already high, this policy would not have significantly improved road safety
[46] [47].
Using input received from the public, as well as research and experience from other countries
that implemented Safe Systems approaches, New Zealand developed the Safer Journeys Strategy
2010-2020. The strategy was led by the NRSC, but other partners included the New Zealand
Police, the New Zealand Transport Agency, the Accident Compensation Corporation (ACC), and
Local Government New Zealand [46] [47].
Over the long-term, the goal of the strategy was to, “Improve the safety of our roads and
roadsides to significantly reduce the likelihood of crashes occurring and to minimize the
consequences of those crashes that do occur,” but it was designed to be implemented through a
series of smaller Action Plans (2011-2012, 2013-2015, and 2016-2020) and tailored to address
individual community needs [46] [47].
Policies and Implementation
The first Action Plan 2011-2012 focused on advancing the Safe Systems approach, addressing
the areas of high and medium concern with initiatives that could most greatly reduce the road
toll. Some specific goals included [46] [47]:
targeting high-risk rural roads and high-risk urban intersections;
improving speed management through public campaigns, safer speeds, and expanding the
use of safety cameras;
generating consumer demand for safe vehicles and improving child restraint use;
increasing the safety of motorcycling through training, road treatments, and enforcement;
reducing alcohol/drug impaired driving through regulations, education, and enforcement;
increasing the safety of young drivers through regulations, education, and enforcement;
reducing the impact of high-risk drivers through rehabilitation, regulations, and
enforcement;
improving pedestrian and cyclist safety through education and safer infrastructure; and
reducing the impact of distraction and fatigue through education and road infrastructure.
15SAFE SYSTEMS SYNTHESIS
The second Action Plan 2013-2015 consolidated efforts from 2011-
Road safety 2012 but laid out specific goals for each element of the Safe System.
stakeholders Some of these goals included identifying the 100 highest-risk
should generate intersections and implementing improvements for a subset of 20,
consumer developing a consistent and effective national speed management
demand for safe program, accelerating the removal of less safe vehicles from the roads,
vehicles. and strengthening drug-driving enforcement. The plan also focused on
demonstrating the effectiveness of the Safe Systems approach by
launching two new initiatives, the Safe System Signature Programme
and the Safe System Partnership Programme [48] [49].
The Safe System Signature Programme sought to identify specific projects that had the potential
to collectively reduce the road toll for all road users by using innovative approaches. Specific
projects included: the Future Streets Project to improve pedestrian and cyclist safety on urban
streets; Behind the Wheel, which supported young learning drivers in the community of
Mangere; and the Visiting Drivers Project, aimed at improving road safety for visiting tourists
[48]. The Safe System Partnership Programme created new initiatives with partners to
demonstrate the effectiveness of collaboration in reducing road trauma [49].
The third and final Action Plan 2016-2020 focuses on the use of current and emerging
technologies and on areas of road safety that relate to disproportionate road toll. The plan aims to
[46] [47]:
Enable smart and safe choices on the road by using technology to provide real-time safety
information to road users.
Make motorcycling safer by increasing rider awareness and training, encouraging use of
motorcycle technologies, and improving protective clothing.
Ensure safer roads and roadsides on urban arterial routes and increase low-cost safety
improvements on high-risk rural routes.
Encourage safe vehicles through the uptake of vehicle safety technologies into the vehicle
fleet.
Efficacy of the Solutions
In the few years immediately following the introduction of the strategy, three-fourths of actions
proposed in the first action plan were completed, and various road safety outcomes were
drastically improved. Between 2009 and 2012, road deaths declined 20%, and 284 fatalities in
2011 marked the lowest road toll since 1952. Deaths of young drivers (ages 15-24) decreased
38%. Alcohol-related crashes with fatal and serious injuries also declined significantly [50].
The New Zealand Ministry of Transport also implemented several other actions to promote safe
and healthy use of the roadway in each of the priority areas. Some of these actions included [50]:
Raising the minimum driver age from 15 to 16;
Implementing stricter child restraint regulations and BAC limits; and
16SAFE SYSTEMS SYNTHESIS
Enhancing speed management with red light and speed cameras.
A more comprehensive list of actions implemented in Safer Journeys is presented in Table 3.
More recently, 5-star vehicle ratings for new light cars entering New Zealand roads increased
from 51% (2009) to 95% (2016). There are also ongoing efforts to install rumble strips and
safety barriers, widen shoulders, improve signage, and implement more appropriate speed limits
[46] [47].
Challenges and Opportunities
Despite achieving great improvements in road safety since implementing Safer Journeys, some
areas still need improvement. Motorcycle deaths and serious injuries have risen since 2013 [49],
and road fatalities overall have risen over the last several years (Figure 5). Fatalities from failing
to use seatbelts doubled between 2014 and 2016, which also correlates with drunk driving among
male drivers. During this same time, the number of high-risk drivers (e.g., repeat offenders and
disqualified and unlicensed drivers) involved in fatal or serious injury crashes increased
dramatically, from 183 in 2014 to 346 in 2016. Crash deaths per 100,000 among 15- to 24-year-
olds has increased slightly since 2012. Alcohol or drug-related fatalities or serious injuries per
100,000 also increased slightly during 2014-2016, as did motorcycling entitlement claims.
Overall, since 2013, the fatality rate has steadily increased, and 2017 may have reached the
highest total since 2010 [46]. Although New Zealand still faces a number of challenges,
particularly those that require enforcement of traffic laws, researchers like Bambach and
Mitchell believe a holistic approach that integrates design, enforcement, and education, may
provide substantial reductions to road tolls, particularly for vulnerable road users, in countries
with Safe Systems programs [51].
Figure 5: New Zealand road traffic fatalities [49]
17SAFE SYSTEMS SYNTHESIS
Table 3: Actions implemented in “Safer Journeys 2010-2020” [46] [47]
Priority Area Action Implemented
Young Drivers Raised minimum driving age from 15 to 16
Implemented zero BAC for driversSAFE SYSTEMS SYNTHESIS
Australia
Motivation and Trends
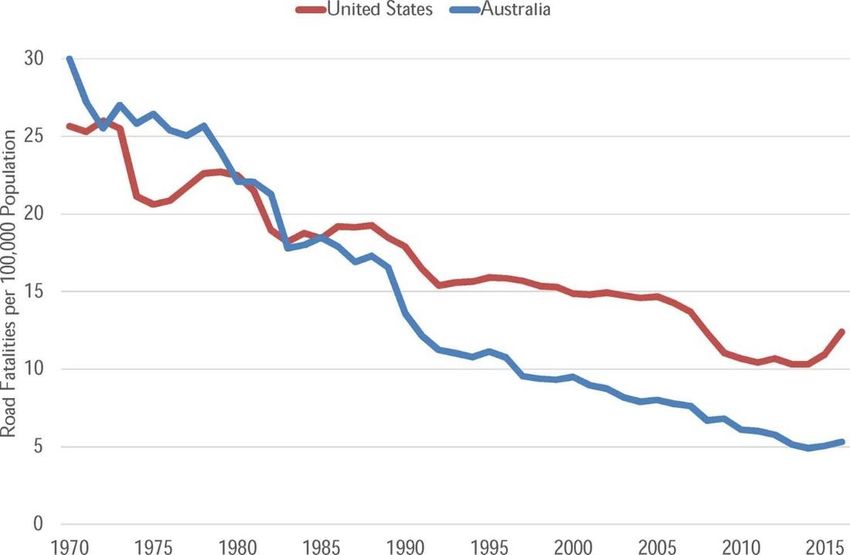
As in the U.S. and Sweden, Australia has halved the death toll from road traffic crashes since the
1970s when road fatalities were at their peak (Figure 6). Much of this decline can be attributed to
a road safety countermeasure program that was progressively implemented over the years [52].
Some measures put in place included graduated driver licensing, roundabouts, mandatory seat
belt laws (1973) and bicycle helmet use (1990), random breathalyzer testing (1976 in Victoria),
and speed camera programs [53].
Figure 6: Comparison of road fatalities per 10,000 people between the United States and
Australia [54]
Additionally, the Motor Vehicles Standards Act of 1989 introduced strict safety standards for all
vehicles entering the Australian market. In 1990, the Australian Government implemented a
Black Spot Program to target specific road segments and locations with a proven crash history or
significant crash potential [55]. The National Road Safety Strategy of 1992-2001 marked
Australia’s first collaborative effort to improve road safety. Significant reductions in the road toll
were achieved but the rate of improvement gradually slowed and remained relatively constant.
Tingvall and Haworth together advocated for a Vision Zero Safe Systems approach in Australia,
starting with the state of Victoria [34]. Their recommendations focused on infrastructure
improvements and speed management, citing that the most important aspect of Vision Zero
centered around the human body’s biomechanical tolerance to an external force. Specifically,
they proposed that speed limits be reduced to levels more appropriate for the road infrastructure
and significant separation should exist between road users on roads where speed exceeded 60-70
km/h (37-43 mph). Further, where conflicts between vehicles and pedestrians occurred, speed
19SAFE SYSTEMS SYNTHESIS
limits should be no more than 30 km/h (19 mph). Otherwise, vehicles and pedestrians should be
physically separated [34]. These recommendations are highlighted in Table 4.
Table 4: Long-term travel speeds based on best-practice vehicle design [34]
Policies and Implementation
Recognizing the need for stronger measures, the Australian Transport Council formally adopted
Safe Systems principles in the subsequent National Road Safety Strategy 2001-2010 [56]. This
effort aimed to reduce the rate of road fatalities by 40% by 2010 (equivalent to a 30% reduction
in the number of fatalities). The Strategy proposed a number of Strategic Objectives to be
implemented through a series of two-year Action Plans. Proposed initiatives included improving
road user behavior, occupant protection, emergency response, and reducing human error through
the use of technology. Some Strategic Objectives for the National Road Safety Strategy are
summarized in Table 5.
The National Road Safety Strategy 2011-2020, still in progress, expanded this vision by setting a
goal for reducing serious roadway injuries as well as fatalities. The Strategy aimed to reduce
both the number of deaths and serious injuries by at least 30% by 2020 using evidence-based
safety countermeasures [57].
At the time that this strategy was launched (the 2011-2020 Strategy), several trends were
apparent. Speeding accounted for the greatest proportion of deaths and serious injuries on the
country’s roadways, followed by drunk driving and fatigue (in fatalities only). The majority of
fatalities and serious injuries occurred in regional areas (65% and 59%, respectively), and
fatalities per capita (per 100,000 residents) increase dramatically the more remote and further a
region was from a major city. Traffic-related deaths were three times higher for indigenous
people than non-indigenous people. Three crash types also dominated Australian roadways:
intersection, single vehicle run-off-the-road, and head-on crashes [57].
To address these challenges, interventions were proposed around four “cornerstone areas” that
aligned with the Safe Systems approach: safe roads, safe speeds, safe vehicles, and safe people.
Specific actions that were to be implemented in the first three years of the strategy are outlined
below [57].
The primary safe road objective was to design all new roads and upgrades to reflect Safe
Systems principles. Other steps included ensuring that roads were “self-explanatory” to reduce
the risk of crashes and injury, and designing infrastructure treatments to target intersection, run-
off-road, and head-on casualty crashes, and addressing the safety of vulnerable road users [57].
20SAFE SYSTEMS SYNTHESIS
Speed limits should be adapted to the risks of the road environment
The Australian
such that crash impact forces do not exceed human tolerance. Several
Safe Systems studies demonstrated that 10 km/h (6 mph) speed reductions on 110
Approach is km/h (68 mph) roadways in Victoria, South Australia, and New South
centered on four Wales all resulted in 20% or more reductions in fatal crashes. The
cornerstone National Road Strategy managers also pointed out that point-to-point
areas: safe roads, camera systems have also been proven to be effective in reducing
safe speeds, safe driver speeds in the UK and Europe. These systems track speed over a
vehicles, and safe longer distance, rather than clocking speed momentarily at one
people. location. In justifying their use, the Australian Transport Council
highlighted that Northamptonshire, England experienced a 78% -85%
reduction in fatal and serious injuries on two different routes within
five years using this point-to-point speed camera system. In the 2011-2020 Strategy. The Council
proposed to develop national speed limit guidelines and to improve speed compliance by
implementing tougher penalties and using the illustrated speed camera technologies [57].
The Australian Transport Council proposed numerous vehicle safety countermeasures, including
improving new vehicle safety standards, reducing the average vehicle fleet age, and using
intelligent technology systems, such as advanced seatbelt reminders, lane departure warning
systems, and brake assist systems [57].
The overall objective within this area is to encourage people to maintain consistent and
compliant behavior within the road system. Specific measures include improving the graduated
driver and motorcycle rider licensing programs and introducing programs that focus on the road
safety of the indigenous community and disadvantaged groups. Additional measures focus on
irresponsible road users and include lowering BAC limits, expanding the use of alcohol
interlocks, and increasing penalties for repeat drink and drug-driving offenders [57].
Interventions are also designed with the expectation that they be customized to local and regional
differences across Australia. A diverse National Road Safety Strategy Panel provided guidance
on all aspects of the Strategy implementation, and strategies are assessed through systematic
reporting on the progress of Targets, Strategic Objectives, and Action Plans at annual meetings
[57].
Efficacy of the Solutions
During the first National Road Safety Strategy, a number of measures were implemented, many
of which demonstrably reduced the road toll. The introduction of a 50 km/h (31 mph) urban
default speed limit was linked to a greater than 20% reduction in serious injury and fatality
crashes. Safety outcomes were also improved by implementing 40 km/h (25 mph) and lower
speed limits in school zones and high-risk pedestrian areas. When the state of Victoria adopted
School Speed Zones, pedestrian and bicycle crashes decreased by 24% [57].
Australia introduced alcohol-interlock programs for repeat drink-driving offenders and roadside
drug testing programs were implemented in most states, producing high detection rates. While no
21SAFE SYSTEMS SYNTHESIS
specific safety assessment has been conducted on these programs, they have the potential to
contribute to road safety efforts by increasing overall awareness of drug-driving [57].
A number of actions pertaining to vehicle safety were implemented. Three-point seatbelts
mandated for all new passenger car models, new standards for front and side impact protection
for new vehicles were put in place, and consumer ratings programs including the Australasian
New Car Assessment Program (ANCAP) were developed to promote vehicle safety [57].
Table 5: Strategic Objectives outlined in Australia’s National Road Safety Strategy 2001-2010.
Objective Proposed Strategies and Focus Areas
Improve Road User Educate young road users responsible road safety behavior
Behavior Driver Training & Licensing – Improve competence and attitudes
Enhance police enforcement using targeted campaigns
Improve the safety of Improve crash cost estimates
roads Conduct widespread road safety audits of improvement projects
Conduct safety investigations on existing road network (prioritize
sites with a crash history)
Create safer environments for pedestrians, cyclist, and motorcyclists
through road design and traffic engineering
Improve vehicle
Improve vehicle safety standards and vehicle design
compatibility and
Provide consumers with information on relative safety of vehicles
occupant protection
Use new technology to
Incorporate Intelligent Transport Systems into vehicles and roads
reduce human error
Improve equity among
Implement programs that target vulnerable road users
road users
Systematically link crash types with injury and treatment outcomes
Improve trauma, medical
and retrieval services Improve all components of trauma management systems
reduce deaths and serious injuries for all crashes
Improve road safety
Collect and analyze evidence from road safety outcomes
programs and policy
through research of safety Improve learning and communication processes across local and
outcomes international governments
Land-use planning and transport planning
Encourage alternatives to
motor vehicle use Expansion of telecommuting
Promoting benefits of public transport, walking and cycling
22SAFE SYSTEMS SYNTHESIS
While the National Road Safety Strategies have been implemented on a national scale, individual
states also developed their own Safe Systems strategies, including Victoria, New South Wales,
and Western Australia [58]. In 2000, Victoria implemented a speed camera program that
included strengthening speed enforcement and extensive public campaigns about speeding. After
four years, fatal crashes declined by 27% and injury crashes declined by 10%, clearly
demonstrating that comprehensive speed management programs can improve road user safety.
The 2001-2010 strategy resulted in a 34% reduction in the rate of road
Outcomes may fatalities nationally but fell short of the 40% target. In general,
vary from state to however, programs targeting high-risk behaviors such as driver
state. impairment, seatbelt wearing, and speeding made substantial
improvements. Outcomes varied across states and territories, with the
greatest 10-year reduction in road fatalities (per 100,000) occurring in
Tasmania (47.5%) while the Northern Territory experienced the least overall reduction (16.1%)
[57].
Challenges and Opportunities
According to annual road trauma summary reports, total road deaths in Australia have declined
by 20% overall and an average of 3% each year over the last decade. However, in 2015 and
2016, the death toll increased by approximately 6%. Researchers have projected that at the
current rate, Australia will not reach its 2020 goal of reducing annual numbers of deaths and
serious injuries by 30% [59].
In response, the government has launched a comprehensive review of the National Road Safety
Strategy. Leading road safety expert and chair of the Royal Australasian College of Surgeons’
Trauma Committee, Dr. John Crozier, and the director of the Centre for Automotive Safety
Research at the University of Adelaide, Jeremy Woolley, have been appointed to conduct the
review [59].
Dr. Crozier strongly criticized Australia’s Black Spot Program in early 2018. He suggested that
proactively improving entire road corridors, rather than high crash-prone areas, would be much
more effective at addressing road safety issues. He also recommended coordinating road safety
legislation across all states and strengthening Australia’s speed camera program [59].
It is difficult to predict road trauma levels due to the range of factors that influence road safety
outcomes. Since Australia has enacted policies similar to Safe Systems measures for decades, it
is difficult to parse out which specific gains can be attributed to Australia’s broad Safe Systems
approach [54]. However, by monitoring strategy implementation, evaluating safety outcomes,
and periodically reviewing and revising safety-oriented actions, municipalities can adjust their
road safety strategies as needed.
23SAFE SYSTEMS SYNTHESIS
The Netherlands
Motivation and Trends
While Sweden may be better-known for being the first nation to adopt the Safe Systems
approach, the Netherlands was the first country to construct quantitative road safety targets [60].
In the 1980s, the Dutch Government introduced several road safety plans that set long-term road
safety policy goals. The Meerjarenplannen Verkeersveiligheid (MPV-I) set a goal of a 25%
reduction in the number of injury crashes from 1985 to 2000. To meet this goal, the Dutch
Government aimed to reclassify roadways and set focus areas targeting alcohol, speed, hazardous
locations, children, elderly, and safety devices [61]. An updated road safety plan, the MPV-II,
was adopted in 1989 and highlighted the importance of incorporating road authorities and
stakeholders into the policy process.
The second Structure Plan for Traffic and Transport (SVV-II) of 1990 set a goal for a 50%
reduction in fatalities and a 40% reduction in injury crashes by 2010 [61]. Doubt arose as to
whether these goals could be met because, while the focus areas were well documented, they did
not address the root of the manifested safety problems. There were reductions in the number of
injury crashes, but there were also large discrepancies between different road classes that were
unaddressed, specifically with arterials. The high crash rates occurring on arterials ultimately led
to the Sustainable Safety Program.
Policies and Implementation
The Sustainable Safety Program was a proactive approach that aimed to prevent serious crashes
and to eliminate the risk of severe roadway injury [62]. The program was built around the idea
that the majority of road accidents can be attributed to the limitations and the unpredictable
nature of humans. Recognizing that behavior modification was unsustainable over the long term,
Sustainable Safety was based on the interactions between all elements of the transportation
system (driver, vehicle, road design, regulations, usage, intended function) [61] and included five
guiding principles: the functionality of roads, the homogeneity of traffic, a predictable road
design, a forgiving environment, and road user awareness (Table 6).
24You can also read