San Diego's First-Time Homebuyer Program - Urban Institute
←
→
Page content transcription
If your browser does not render page correctly, please read the page content below
HOUSING FINANCE POLICY CENTER

RE S E AR CH RE P O R T

San Diego’s First-Time Homebuyer
Program
Exploring the Feasibility of Increasing Opportunities for Middle-Income
and Black Homebuyers

Jung Hyun Choi            Liam Reynolds        John Walsh    Janneke Ratcliffe
Laurie Goodman
July 2022 (corrected July 14, 2022)

AB O U T T HE U R BA N I NS T I T U TE
The nonprofit Urban Institute is a leading research organization dedicated to developing evidence-based insights
that improve people’s lives and strengthen communities. For 50 years, Urban has been the trusted source for
rigorous analysis of complex social and economic issues; strategic advice to policymakers, philanthropists, and
practitioners; and new, promising ideas that expand opportunities for all. Our work inspires effective decisions that
advance fairness and enhance the well-being of people and places.

Copyright © July 2022. Urban Institute. Permission is granted for reproduction of this file, with attribution to the
Urban Institute. Cover image by Tim Meko.

Contents
Acknowledgments                                                                  iv

Executive Summary                                                                 v

Errata                                                                           xv

San Diego’s First-Time Homebuyer Program                                         1

Obtaining Homeownership Has Become More Challenging in San Diego                 6

Market Analysis I: Exploring the Number of Potential Black Homebuyers            12

Market Analysis II: Exploring the Number of Potential Middle-Income Homebuyers   33

DPA Programs in Other Cities and Localities                                      44

Recommendations for SDHC                                                         52

Appendix                                                                         56

Notes                                                                            57

References                                                                       58

About the Authors                                                                59

Statement of Independence                                                        61
Acknowledgments
This report was funded by the San Diego Housing Commission. We are grateful to them and to all our
funders, who make it possible for Urban to advance its mission.

    The views expressed are those of the authors and should not be attributed to the Urban Institute,
its trustees, or its funders. Funders do not determine research findings or the insights and
recommendations of Urban experts. Further information on the Urban Institute’s funding principles is
available at urban.org/fundingprinciples.

    We also thank Down Payment Resource for sharing its internal data and providing us with advice
on the interview candidates.

     iv                                                                          ACKNOWLEDGMENTS
Executive Summary
High home prices and limited housing supply make achieving homeownership in the city of San Diego a
significant challenge for individuals and families across all income groups. In addition, among all racial
and ethnic groups, Black households are the least likely to be homeowners.
The San Diego Housing Commission (SDHC) engaged the Urban Institute’s Housing Finance Policy
Center (HFPC) to analyze the San Diego homebuying market and explore ways to support homebuying
among middle-income households and Black households through more targeted down payment
assistance (DPA) via SDHC’s First-Time Homebuyer (FTHB) Program.
To help address these issues, HFPC researchers explored two possible strategies. The first is to
create a program for middle-income households with incomes between 80 and 150 percent of the area
median income (AMI). Because the federal and state funding SDHC leverages for its existing FTHB
Program limits eligibility to low-income households with incomes below 80 percent of the AMI, SDHC
would need to secure additional funding to serve middle-income households. The second strategy is to
explore how the current FTHB Program, which currently serves a high percentage of Latino households,
could attract and serve more Black homebuyers.
This report analyzes the San Diego housing market and borrowers’ financial characteristics and
estimates the number of potential middle-income and Black households SDHC could serve. Informed by
interviews with seven comparable organizations that provide DPA in other cities, the report also
provides four recommendations to SDHC to increase homeownership among these two groups.
Homeownership Has Become Less Affordable
in San Diego
A recent study shows that the San Diego metropolitan statistical area (MSA) is the most unaffordable
MSA in the nation.1 According to Zillow, home values in the city of San Diego rose 27.9 percent between
March 2021 and March 2022, and the number of active listings per sale fell 61 percent. In April and May
2022, the median number of days that a home was on the market was less than 20 days, reflecting high
competition between homebuyers for a low inventory of available homes.
High home prices have translated to a low homeownership rate in San Diego. In 2019, the city’s
homeownership rate was 46.5 percent, 18 percentage points below the nationwide rate and 6
EXECUTIVE SUMMARY vpercentage points below California’s homeownership rate. A shortage of existing housing supply and
delays in new construction during the COVID-19 pandemic prevented many San Diegans from
accessing homeownership and benefiting from 2021’s record-low interest rates; interest rates quickly
rose during early 2022, exceeding prepandemic levels.
Despite averaging higher credit scores and incomes, the share of mortgage applicants relative to
renter households was lower in San Diego than in both California and the nation. This pattern was
consistent across all income groups, suggesting that even households with high incomes are facing
greater challenges finding homes they can afford with their current financial resources.
The extraordinarily high home prices have also affected SDHC’s FTHB Program. Fewer households
are applying for the program, resulting in underused program funds. SDHC started the FTHB Program
in 1988 and has served more than 5,900 households. The program offers deferred loans and closing
cost grants to households earning up to 80 percent of the AMI. But the program has assisted fewer
households in the past two years, as eligible households are struggling to find affordable homes and to
compete against buyers with greater resources.
Less Than 30 Percent of Black Households in San Diego
Are Homeowners
Black households have the lowest homeownership rate of all racial and ethnic groups in San Diego
(figure ES.1). According to 2015–19 American Community Survey data, Black households had a 29.1
percent homeownership rate, and Latino households had a 35.2 percent homeownership rate. For Asian
and white households, these rates were 54.5 percent and 54.8 percent, respectively. Although Black
households have lower incomes, on average, the Black homeownership rate is still low even after
controlling for income, suggesting that Black households face additional challenges.
vi EXECUTIVE SUMMARYFIGURE ES.1
Homeownership Rates, by Race or Ethnicity, in San Diego
54.5% 54.8%
35.2%
29.1%
Asian Black Latino White
URBAN INSTITUTE
Source: 2015–19 American Community Survey data.
Because of the difference in the racial homeownership rate, Black and Latino households are
underrepresented in their share of homeownership while white and Asian households are
overrepresented (figure ES.2). White households make up 62.0 percent of homeowners, which is almost
15 percent greater than their share of total households. Asian households are overrepresented among
homeowners by 11.3 percent. Conversely, Black and Latino households are underrepresented by 69
percent and 40 percent, respectively.
FIGURE ES.2
Households and Homeowners, by Race or Ethnicity, in San Diego
Asian Black Latino Other White
Households, by race or ethnicity 14.2% 6.1% 19.1% 3.1% 54.0%
Homeowners, by race or ethnicity 15.8% 3.6% 13.6% 2.4% 62.0%
0% 20% 40% 60% 80% 100%
URBAN INSTITUTE
Source: 2015–19 American Community Survey data.
EXECUTIVE SUMMARY viiBecause of the city’s military presence, there is a high share of veterans and active-duty
servicemembers, especially among Black households. About 30 percent of Black heads of household are
either veterans or active-duty servicemembers. This affects the types of mortgages Black households
use to purchase homes. Between 2018 and 2020, more than 51 percent of Black homebuyers in San
Diego purchased homes using a US Department of Veterans Affairs (VA) loan, which is a zero down
payment program, compared with 14.8 percent of all homebuyers. The disproportionately high share of
Black households who used VA loans to purchase homes indicates that Black households who do not
have access to VA loans find it more difficult to buy homes.
In San Diego, the most common reason for mortgage denial was exceeding debt-to-income (DTI)
ratio limits, reflecting high mortgage costs. About 35.3 percent of home purchase loans were denied
because of DTI ratios, and this share was the highest among Black applicants (38.6 percent). Although
credit history was the most common reason for mortgage denial in the nation (31.3 percent), only 11.9
percent of denied loans in the city were denied because of credit history, showing that even with decent
credit, it is challenging to purchase a home in San Diego.
A Small Number of Black Households Potentially Would
Qualify and Benefit from SDHC’s FTHB Program
HFPC researchers estimated the number of Black potential first-time homebuyer households that
SDHC’s current FTHB Program could serve. Because households earning less than 50 percent of the
AMI likely cannot afford a house and make mortgage payments, the analysis focuses on those who earn
50 to 80 percent of the AMI. It also excludes veterans and those who currently serve in the military, as
they can use VA loans, which do not require down payments. The analysis determined that 3,800 Black
households citywide could qualify and benefit from SDHC’s FTHB Program. Additionally, if an age cap
of 45 is imposed, to better capture first-time homebuyers, the number of households decreases to
about 2,000. Although the number of Black potential first-time households with incomes from 50 to 80
percent of the AMI is not large, many households in this group are rent burdened—paying more than 30
percent of their gross income for housing costs—making it even more important to find solutions to
increase their homeownership opportunities.
viii EXECUTIVE SUMMARYMiddle-Income Households Also Struggle to Become
Homeowners in San Diego
Middle-income households in San Diego (earning between 80 and 150 percent of the AMI) have a
substantially lower homeownership rate compared with middle-income households statewide and
nationwide (figure ES.3). For households earning between 80 and 120 percent of the AMI in San Diego,
the homeownership rate is 42.8 percent (versus 54.1 percent for California and 64.5 percent for the
US). Households earning between 120 and 150 percent of the AMI have a homeownership rate of 52.5
percent (versus 62.5 percent for California and 72.0 percent for the US). For these middle-income
households, the share of applications and originations relative to renter households was substantially
lower than in the US, indicating that high prices and competition are discouraging many middle-income
San Diegans from applying for a mortgage.
FIGURE ES.3
Homeownership Rates, by Income
San Diego California US
82%
72% 74%
70%
64% 63%
56% 54% 53%
46%
42% 43%
34% 35%
27%
< 50% 50–80% 80–120% 120–150% ≥ 150%
Income as a share of the area median income
URBAN INSTITUTE
Source: 2015–19 American Community Survey data.
The disparities in homeownership rates by income make high-income households significantly
overrepresented in the share of total homeowners (figure ES.4). Compared with their share of total
households, the highest-income homeowners are overrepresented by 52.6 percent, and homeowners
making between 120 and 150 percent of the AMI are overrepresented by 15.2 percent. In contrast, the
EXECUTIVE SUMMARY ixlowest-income households are underrepresented as a share of total homeowners by 41.5 percent. The
two middle groups, making between 50 and 80 percent and 80 and 120 percent of the AMI, are
underrepresented by 23.3 and 6.7 percent, respectively.
FIGURE ES.4
Households and Homeowners, by Income, in San Diego
Income as a share of the area median income
< 50% 50–80% 80–120% 120–150% ≥ 150%
Households, by income 26.8% 17.2% 17.8% 9.9% 28.3%
Homeowners, by income 15.7% 13.2% 16.6% 11.4% 43.2%
0% 20% 40% 60% 80% 100%
URBAN INSTITUTE
Source: 2015–19 American Community Survey data.
More than a quarter of households earning 80 to 120 percent of the AMI and more than 20 percent
of those earning 120 to 150 percent of the AMI used VA loans to purchase a home. These two income
groups had the highest share of homebuyers using VA loans and the lowest median down payment
percentage.
For middle-income households earning 80 to 150 percent of the AMI, the DTI ratio was the most
frequently listed reason for mortgage denial. More than one-third of the applicants were denied
because of the DTI ratio, roughly 10 percentage points higher than the national number. New funding to
serve middle-income households could greatly benefit this group.
x EXECUTIVE SUMMARYApproximately 65,000 Middle-Income Households
Potentially Would Qualify and Benefit from SDHC’s
FTHB Program
HFPC researchers find that about 65,000 middle-income households in San Diego could benefit from
DPA. Excluding veterans and active-duty military members, 43,792 renter households earn between 80
and 120 percent of the AMI, and 30,762 of them are headed by someone younger than 45. For
households with incomes between 120 and 150 percent of the AMI, these numbers were 21,142 in total
and 14,909 for households headed by someone younger than 45.
Recommendations for SDHC
HFPC researchers developed four recommendations for SDHC based on an analysis of the San Diego
housing market and interviews with seven organizations that provide DPA to households with incomes
above 80 percent of the AMI or focus on Black households:
◼ HomeSight (Seattle, Washington)
◼ DC Department of Housing and Community Development
◼ San Francisco Mayor’s Office of Housing and Community Development
◼ HomesFund (Durango, Colorado)
◼ City of Austin, Texas
◼ Solita’s House (Tampa, Florida)
◼ Los Angeles County Development Authority
The recommendations are as follows:
Diversify Funding Sources
SDHC will need to diversify its funding sources to help households earning above 80 percent of the
AMI, as its current funding does not allow the commission to serve these households. The interviews
revealed that organizations that help middle-income households receive state or local funding, private
funding, or issued bonds. State or local funding was often initiated by strong local leaders who saw the
EXECUTIVE SUMMARY xineed to provide additional assistance for households with incomes above 80 percent of the AMI in
highly unaffordable competitive markets.
For example, realizing that rising home prices and heated competition are creating challenges for
high-income households in San Francisco, the Mayor’s Office of Housing and Community Development
(MOHCD) increased its program’s income limit to 200 percent of the AMI. Because MOHCD’s housing
trust fund imposed a limit at 120 percent of the AMI, it issued general obligation bonds and allocated
discretionary general funds to provide additional funding to serve high-income households.
Similarly, the Department of Housing and Community Development (DHCD) DPA program in
Washington, DC, serves residents making up to 110 percent of the AMI, above the federal funding
income limits. For homebuyers earning 80 to 110 percent of the AMI, the assistance comes in the form
of a zero-interest loan, which is deferred for 5 years and has a 40-year repayment period. DC’s DPA
funding doubled five years ago when the city’s mayor increased the program’s maximum assistance and
injected nonfederal funds. These local funds come from the city general fund, repayment by prior
borrowers, and the Unified Fund, which is funded by fees collected for various real estate transactions
such as condominium conversions and applications for registration. City general funds have accounted
for at least 67 percent of local funding since 2015. Local funding has accounted for between 27 and 47
percent of total DPA funds in DC, with total local funding levels between $3.8 and $7.8 million. DHCD
uses federal funds first to serve borrowers earning below 80 percent of the AMI because their eligibility
requirements are the strictest and incorporate additional funding sources if necessary.
Even in more affordable housing markets such as Durango, Colorado, income limits have increased.
In 2019, the Colorado state legislature passed two affordable housing bills that enabled the program to
increase its eligibility to 100 percent of the AMI. More recently, the HomesFund in Durango received
funding from the state via the Affordable Housing Investment Fund. Homebuyers earning up to 120
percent of the AMI are eligible for these funds.
To combat rising home prices, there have been recent efforts in California and San Diego to obtain
additional funding for FTHB DPA programs. California state senate president pro tempore Toni Atkins
(D-San Diego) has proposed a 2022–23 budget allocation of $500 million for the California Dream for
All program and an additional $500 million each year for nine years. This program would help low- and
middle-income first-time homebuyers achieve homeownership by providing significant DPA to
qualifying households. The program could also reduce some of the barriers to homeownership that have
disproportionately prevented families of color from owning homes.
xii EXECUTIVE SUMMARYIn San Diego, SDHC led a collaborative that obtained a $7.5 million Wells Fargo grant to support
the Wealth Opportunities Restored through Homeownership program. This initiative aims to increase
homeownership for Black people, Indigenous people, and other people of color in the region. Some of
this grant could become a flexible funding source for the SDHC FTHB Program.
Reexamine Eligibility Criteria and Program Design
Several organizations have altered their eligibility criteria (e.g., maximum DTI ratio and maximum home
value) or increased the amount of assistance to reach more homebuyers. For example, to keep pace
with rising housing costs, the mayor of Washington, DC, Muriel Bowser, has proposed increasing the
maximum assistance level to $202,000, and the DC Council is considering raising the minimum to
$70,000. A larger down payment means a smaller loan amount and a lower DTI ratio. Many Black
households and middle-income households lack sufficient funds to make a large enough down payment
to make a big difference in the DTI ratio, which is the most cited reason for mortgage denial in San
Diego. San Francisco’s MOHCD has also reduced the minimum borrower contribution from 5 percent to
1 percent and provides an additional grant of up to $30,000 that can be used toward a down payment,
closing costs, or prepaid items. The program provides up to $500,000 in DPA.
For programs to increase Black homeownership, SDHC could consider directly reaching Black
borrowers through special purpose credit programs—which offer credit on favorable terms to
borrowers of a protected class who have experienced economic disadvantages—and providing
additional funding for down payments or renovations. For example, Local Initiatives Support
Corporation and Urban League San Diego have announced the San Diego Black Homebuyers Program,
which provides $40,000 grants to Black borrowers earning less than 120 percent of the AMI to be used
toward a down payment and closing costs. The grant is funded by the San Diego Foundation and has no
repayment requirement. HomeSight in Seattle has partnered with Windermere, US Bank, and the
National Association of Real Estate Brokers to create a “Hi Neighbor” Homeownership Fund that
focuses on Black borrowers with incomes between 80 and 120 percent of the AMI. It designed the
program realizing that many Black renter households earn just above 80 percent of the AMI but do not
have enough wealth for a down payment. Fannie Mae and Freddie Mac have also announced their plan
to launch special purpose credit programs in their 2022 Equitable Housing Finance Plans. 2
EXECUTIVE SUMMARY xiiiFacilitate the Lending Process
In many markets, a lack of housing supply and an increasing presence of cash buyers has made it difficult
for low- and middle-income households to buy homes, partially because cash buyers can close on
properties rapidly. Offering borrowers in the FTHB Program assistance during the purchase process
can help them compete with other offers. For example, HomeSight said it was considering providing
sellers credit to help their clients be more competitive. San Francisco MOHCD is working with lenders
to reduce processing time, but it is still challenging, as it depends on lenders’ capacity. SDHC could also
provide incentives to sellers and real estate agents to encourage them to sell homes to low-income
buyers. This is especially critical when homes for sale receive offers from multiple potential buyers.
Implement Outreach and Marketing Efforts
Our analysis found that no more than 5,000 potential Black homebuyers with incomes below 80
percent of the AMI in San Diego could benefit from SDHC FTHB programs, but SDHC can still make
additional efforts to reach out to potential Black homebuyers. Many organizations said they are using
their websites, owned and earned media, and social networking services to get information to their
clients. Because lenders have played a key role in outreach, SDHC could work with them to develop a
strategy to reach out to Black households. Because these programs are also spread through word of
mouth, SDHC could partner with reliable local organizations, including faith-based and community-
based organizations, to increase awareness of the program for potential customers. SDHC can also
work with organizations such as Local Initiatives Support Corporation that have started special purpose
credit programs that allow for race-based outreach. If the program is used in conjunction with lender
programs emphasizing Black borrowers, it can lead to greater focus and impact on homebuyer
assistance.
xiv EXECUTIVE SUMMARYErrata This report was corrected July 14, 2022. In two sections of a previous version of the executive summary (on pages viii and xi), we produced numbers of households using calculations that excluded households with active-duty military servicemembers from total households. We have corrected some of those numbers to reflect updated calculations that exclude households with active-duty military servicemembers as well as households with veterans. ERRATA xv
San Diego’s First-Time Homebuyer
Program
With close to 1.4 million people and more than half a million households in a coastal area with a thriving
international border community, San Diego is the eighth-most-populous city in the United States and
the second-most-populous city in California, following Los Angeles. 3 According to 2015–19 American
Community Survey data, the city has a relatively high share of Latino and Asian households and a lower
share of white households compared with the nation (figure 1). Compared with California, San Diego
has a lower share of Latino households, while the Asian and Black share of households is similar
between the two regions.

FIGURE 1
Household Racial and Ethnic Composition

    Asian          Black      Latino        White         Other

 San Diego           14.2%         6.1%           19.1%                        54.0%                       6.6%

 California         14.0%          6.1%              29.2%                             47.7%           3.0%

        US 4.8%            12.1%          13.2%                            67.5%                        2.4%

              0%           10%       20%          30%        40%   50%   60%       70%         80%   90%       100%
                                                                                                     URBAN INSTITUTE

Source: 2015–19 American Community Survey data.

    The city has the second-largest surface ship base of the US Navy, which is a large employer in the
area. About 10.4 percent of heads of household in the city are veterans, and 5.2 percent are active-duty
military members. The shares of active-duty members and veterans are especially high for Black heads
of household, 19.5 percent and 10.5 percent of whom are veterans and active-duty members,
respectively.
Mild weather and beautiful beaches make San Diego one of the most desirable places to live in the
US, but high housing costs have impeded its residents’ ability to become homeowners. According to
OJO Labs, San Diego became the most unaffordable city in the US, as home price growth substantially
outpaced household income growth.4 Zillow data show that between March 2021 and March 2022,
home prices in San Diego increased by 27.9 percent. 5
The Homeownership Rate in San Diego Is Low, Especially
for Black Households
High home prices have translated to a lower homeownership rate. The 2019 homeownership rate in San
Diego was 46.5 percent, 18 percentage points below the nation. 6 Additionally, the city has stark racial
homeownership disparities. According to 2015–19 American Community Survey data, 54.5 percent of
Asian households and 54.8 percent of white households owned their homes, compared with 29.1
percent of Black households and 35.2 percent of Latino households. Homeownership is critical to
building wealth, but many Black and Latino households in San Diego have had fewer resources and
opportunities to access and sustain homeownership.
For households who remain renters, a significantly higher share of Black and Latino renters are cost
burdened—67.5 and 55.5 percent, respectively—when compared with white and Asian renters (figure
2). Overall, 51 percent of rental households in San Diego are cost burdened (spend more than 30
percent of their annual income on housing). High rental costs add to the challenge for first-time buyers,
detracting from savings that could have been put toward an eventual down payment.
2 SAN DIEGO’S FIRST-TIME HOMEBUYER PROGRAMFIGURE 2
Rent-Burdened Share of Households, by Race or Ethnicity, in the City of San Diego
67.5%
55.5%
50.9%
47.8%
43.6%
All Asian Black Latino White
URBAN INSTITUTE
Source: 2015–19 American Community Survey data.
The lack of homeownership opportunities for Black homeowners is also related to the history of
systemic discrimination, including the former practice known as redlining. San Diego was one of
approximately 150 cities to have the Home Owners’ Loan Corporation (HOLC) “Residential Security”
rankings, which discouraged capital flows into neighborhoods of color and effectively barred people of
color from homeownership.7 This segregation continues today, though there have been improvements.
The dissimilarity index calculates the degree of symmetry between two groups by measuring whether
one group is located across census tracts within the city in the same way as a comparison group. The
value ranges from 0 to 100, with a high value indicating that the two groups tend to live in different
census tracts.
For example, in 1980, 63.6 percent of Black San Diegans would have needed to move to a different
neighborhood for each neighborhood to have an equal share of Black population and white population
in San Diego (figure 3). This share decreased continuously to 48.2 percent by 2020. Currently, the
dissimilarity index is highest between Latino and white populations. Though this number has declined
since 2000, it is still higher than it was in 1980.
SAN DIEGO’S FIRST -TIME HOMEBUYER PROGRAM 3FIGURE 3
Dissimilarity Index in San Diego
1980 1990 2000 2010 2020
63.6 62.2 60.7 60.1
55.9 57.8
54.6
52.1
48.2 49.9 49.5 47.6
44.5 44.6
41.5
Black-white Latino-white Asian-white
URBAN INSTITUTE
Source: Brown University Diversity and Disparities Project calculation using decennial census data.
Middle-Income Households Also Struggle
to Become Homeowners
The homeownership rate in San Diego is also lower than the national rate, even after controlling for
income. For example, the homeownership rate of households with incomes below 80 percent of the AMI
was 30 percent, 13.5 percentage points lower than for the nation. For households with incomes
between 80 and 120 percent of the AMI, the homeownership rate was 42.8 percent in San Diego
compared with 66.8 percent in the nation. For households with incomes between 120 and 150 percent
of the AMI, San Diego’s 52.5 percent homeownership rate is far below the national rate of 77.0
percent.8 This suggests that even for households who earn middle incomes and above, it is more
challenging to become a homeowner in San Diego because of high housing prices. Even households
earning at least 150 percent of the AMI in San Diego had a lower homeownership rate than the nation
(70.0 percent versus 82.3 percent).
4 SAN DIEGO’S FIRST-TIME HOMEBUYER PROGRAMDown Payment Assistance Can Help Many Households
Become First-Time Homeowners
In a 2018 study of barriers to homeownership (Goodman et al. 2018), the most cited barrier to
accessing homeownership was insufficient funds for a down payment. About 68 percent of the survey
participants said a down payment was the major barrier to owning a home, and 66 percent said they
face difficulty saving for a down payment. Additionally, research shows that individuals whose parents
are homeowners are more likely to receive financial resources that help them become homeowners
(Choi, Zhu, and Goodman 2018). Black and Latino young adults who are less likely to have parents who
own a home struggle more to save for a down payment.
In places where the housing supply is restricted, as in San Diego, designing a well-targeted DPA
program is especially critical. SDHC’s FTHB Program has served many households earning less than 80
percent of the AMI over the past three decades. But middle-income families (earning 80 to 150 percent
of the AMI) are also struggling to become homeowners because of high home prices. Additionally, the
current program that serves households with incomes below 80 percent of the AMI has mostly served
Latino households, and the assistance has not reached many Black households, who have the lowest
homeownership rate in the area.
This research explores the potential market size of middle-income first-time homeowners and
investigates funding sources for a new DPA program that could serve these homebuyers. The study also
examines whether and how the current program could better reach Black households. By examining
existing data and best practices, this research will not only inform San Diego’s future program but be
useful to other local, state, and national efforts to advance DPA programs and close homeownership
gaps.
SAN DIEGO’S FIRST -TIME HOMEBUYER PROGRAM 5Obtaining Homeownership Has
Become More Challenging in San
Diego
California is facing a severe housing supply crisis, with the currently available housing stock falling far
short of growing demand (Reid et al. 2017). One of the results of this crisis is intense competition
between homebuyers, putting upward pressure on home prices and reducing homeownership
opportunities for average first-time homebuyers. These market conditions have increased the
importance of subsidies and assistance in giving prospective new homeowners a path to ownership.
San Diego Is Facing an Acute Lack of Housing Supply
and Increased Competition
San Diego has experienced the impact of California’s housing crisis most acutely. Although there are
seasonal fluctuations, the stock of for-sale homes in San Diego has continuously declined since 2018,
dropping to below 500 in February 2022 (figure 4).
FIGURE 4
For-Sale Inventory in San Diego
3,000
2,500
2,000
1,500
1,000
500
0
2018 2019 2020 2021 2022
URBAN INSTITUTE
Source: Realtor.com.
Note: Data as of May 1, 2022.
6 SAN DIEGO’S FIRST-TIME HOMEBUYER PROGRAMIn 2022, the median days a property is on the market, the time between when the property is listed
on the market and when the sale is closed, fell below 20 days. San Diego properties were sold much
faster than they were nationwide and were sold slightly faster than they were statewide, highlighting
market competitiveness (figure 5).
FIGURE 5
Median Days Pending (Historical Time Series)
USA
San
San Diego,
Diego City
(city)
California
100
90
80
70
60
50
40
30
20
10
0
2018 2019 2020 2021 2022
URBAN INSTITUTE
Source: Realtor.com.
Figure 6 shows the investor share of home purchases. Those data are not available for the city of
San Diego. Adding to the competition among homebuyers, the share of homes being purchased by
investors has trended up over the past two years in the San Diego MSA, increasing from 8.7 percent in
2020 to 9.9 percent in 2021. Investors make up a greater share of buyers in the San Diego MSA and in
California than in the rest of the nation. Though the investor share of purchases remains far below
where it was in the immediate aftermath of the 2008 recession, this recent uptick creates additional
competition for the average prospective homebuyer.
SAN DIEGO’S FIRST -TIME HOMEBUYER PROGRAM 7FIGURE 6
Investor Share of Home Purchases (Historical Time Series)
San Diego,
Diego MSA
MSA
California
US
20%
18%
16%
14%
12%
10%
8%
6%
4%
2%
0%
2000 2002 2004 2006 2008 2010 2012 2014 2016 2018 2020
URBAN INSTITUTE
Source: CoreLogic.
Note: MSA = metropolitan statistical area.
Cash offers, for which the data are also available only for the San Diego MSA, can edge out the
average buyer in a hot market, as they are more attractive than debt-financed offers, giving institutional
investors an advantage over households.9 In 2020, an estimated 19 percent of home sales in the San
Diego MSA were done in cash, lower than in the rest of California and in line with the total US market
(figure 7). Higher home prices in the San Diego MSA compared with California explain the lower cash
buyer share. But in the San Diego MSA, the cash buyer share has increased during the pandemic from 12
percent in April 2020 to 18 percent in April 2021 and 19 percent in April 2022, according to
Realtor.com.
8 SAN DIEGO’S FIRST-TIME HOMEBUYER PROGRAMFIGURE 7
Cash and Mortgage Shares of Home Sales, 2020
Mortgage share Cash share
US 81.0% 19.0%
California 75.8% 24.2%
San Diego MSA 80.6% 19.4%
0% 20% 40% 60% 80% 100%
URBAN INSTITUTE
Sources: CoreLogic, National Association of Realtors, and 2020 Home Mortgage Disclosure Act data.
Note: MSA = metropolitan statistical area.
Condominiums Are Substantially More Affordable
in San Diego
Although property prices have increased significantly during the pandemic, condominiums in San Diego
are relatively more affordable than single-family homes (table 1). In 2020, 60 percent of single-family
homes sold for $1 million or more while more than 80 percent of condominiums were sold for less than
$1 million. In 2020, almost all properties sold in San Diego were either single-family homes or
condominiums. Single-family homes accounted for 53 percent of all transactions, and condominiums
accounted for 46 percent.
SAN DIEGO’S FIRST -TIME HOMEBUYER PROGRAM 9TABLE 1
Price Distribution of Single-Family Homes and Condominiums Sold in 2020
Single-Family Homes Condominiums
Price Number Share of total Number Share of total
< $500,000 158 2.1% 1,365 20.8%
$500,000–600,000 224 3.0% 1,109 16.9%
$600,000–700,000 412 5.5% 986 15.0%
$700,000–800,000 723 9.6% 827 12.6%
$800,000–900,000 695 9.2% 575 8.8%
$900,000–1 million 800 10.6% 479 7.3%
$1.0 million–1.2 million 1,478 19.6% 616 9.4%
$1.2 million–1.5 million 1,154 15.3% 344 5.2%
$1.5 million–2.0 million 1,024 13.6% 152 2.3%
≥ $2.0 million 862 11.5% 120 1.8%
Source: 2020 property records data.
SDHC started its FTHB Program in 1988 and has helped many low-income households obtain
homeownership. The program provides a silent, deferred-payment, second trust-deed loan to help
households purchase homes. The loan initially had a shared equity provision, but the program was
subsequently changed to a 3 percent simple-interest, deferred-payment loan in 2011 when home values
had steeply declined. A simple 3 percent loan was also easier for buyers to comprehend.
In January 2022, reflecting significant home price increases and to help low-income homebuyers,
the maximum down payment loan amount was increased from 17 percent of the purchase price to 22
percent. SDHC also offers a closing cost assistant grant, where low-income households can receive
grants up to 4 percent of the purchase price or appraised value, whichever is less. The minimum grant
amount is $1,000, and the maximum is $10,000. Borrowers must have an acceptable credit history with
a minimum middle credit score of 640 or above. Borrowers with no or thin credit must provide at least a
12-month history of three alternative tradelines, one of which must be rental payment history. DTI ratio
must be below 45 percent. The housing DTI ratio cannot be less than 30 percent. The maximum liquid
asset reserve is $10,000 for the first household member and $500 for each additional member. The
homebuyer must complete prepurchase counseling and homebuyer education. The eligible properties
are single-family detached homes, condominiums, and townhouses.
Since the program’s inception, SDHC has assisted more than 5,900 families, providing more than
$190 million in assistance. About 75 percent of the households served have been Latino buyers. The
current portfolio has a 0.01 percent default rate. Until recently, the program had high demand. But
because of extraordinarily high home prices driven by limited supply and low interest rates, low-income
households have faced greater challenges to find an affordable home and to compete with buyers who
10 SAN DIEGO’S FIRST-TIME HOMEBUYER PROGRAMhave greater financial resources (figure 8). Therefore, demand for DPA has dropped substantially in the
past two years, leaving SDHC with funding that remains underused.
FIGURE 8
Number of First-Time Homebuyers SDHC Has Assisted, by Year
110
80
68 70 70
67
56
FY 2015 FY2016 FY 2017 FY 2018 FY 2019 FY 2020 FY 2021
URBAN INSTITUTE
Source: San Diego Housing Commission.
Note: FY = fiscal year.
The current funding of the SDHC FTHB programs comes from federal sources (e.g., HOME
Investment Partnerships Program; the Community Development Block Grant, or CDBG, Program; and
the Moving to Work Demonstration Program), state sources (CalHOME), and local sources
(inclusionary housing). These sources are all restricted to serving households with incomes up to 80
percent of the AMI. Because of this restriction, SDHC cannot assist middle-income households, many of
whom are also struggling to come up with resources for a down payment.
SAN DIEGO’S FIRST -TIME HOMEBUYER PROGRAM 11Market Analysis I: Exploring the
Number of Potential Black
Homebuyers
This section examines homeownership and mortgage application status by race and ethnicity. The
section provides an overview of homeownership rates and lending in San Diego, focusing on differences
across racial and ethnic groups, and estimates the number of potential Black households to which the
SDHC FTHB Program could reach out. To provide context, the report compares San Diego with the US
and with Austin, DC, San Francisco, and Seattle, all of which are high-cost cities with DPA programs.
Because San Diego and Austin are not identifiable in the micro-level US Census Bureau data, HFPC
researchers created a crosswalk that identified the share of households in each Public Use Microdata
Area (PUMA) that are within the city limits. For example, households in a PUMA with all its households
located within the city would be assigned 100 percent, and households in a PUMA with half its
households inside the city limits would be assigned 50 percent. Each household’s observations are
weighted by its assigned percentage. The accuracy of the numbers is validated by comparing some city-
level values (e.g., San Diego’s homeownership rate) that the US Census Bureau provides with the
numbers the researchers generated from the weighted PUMA city boundary.
Homeownership, by Race and Ethnicity
In San Diego, there are noticeable disparities in homeownership across race and ethnicity. From 2015 to
2019, Black households had the lowest homeownership rate (29.1 percent), followed by Latino
households (35.2 percent). The homeownership rates of Asian and white households were 54.5 percent
and 54.8 percent, respectively.
Figure 9 shows that white and Asian households are overrepresented in their share of homeowners,
while Black and Latino households are underrepresented. White households make up 62.0 percent of
homeowners, which is almost 15 percent greater than their share of total households. Asian households
are overrepresented among homeowners by 11.3 percent. Conversely, Black and Latino households are
underrepresented by 69 percent and 40 percent, respectively.
12 SAN DIEGO’S FIRST-TIME HOMEBUYER PROGRAMFIGURE 9
Households and Homeowners, by Race or Ethnicity, in San Diego
Asian Black Latino Other White
Households, by race or ethnicity 14.2% 6.1% 19.1% 3.1% 54.0%
Homeowners, by race or ethnicity 15.8% 3.6% 13.6% 2.4% 62.0%
0% 20% 40% 60% 80% 100%
URBAN INSTITUTE
Source: 2015–19 American Community Survey data.
Other large, expensive cities have racial homeownership profiles similar to San Diego’s. Black
households have the lowest or second-lowest homeownership rate of any racial or ethnic group in all
five cities the researchers compared, and their homeownership rate does not exceed 35 percent in any
city. In DC, Black households have a 35 percent homeownership rate, higher than Latino households but
lower than Asian and white households. Black and Latino households have substantially lower
homeownership rates than Asian and white households in those four cities and San Diego, though the
gaps are smaller
in DC.
SAN DIEGO’S FIRST -TIME HOMEBUYER PROGRAM 13FIGURE 10
Homeownership Rates, by Race or Ethnicity, in Several Cities
San Diego Austin DC San Francisco Seattle
58%
54% 55%
49% 50% 50%
48%
44%
40% 39%
35% 35% 36%
29% 29%
25% 25%
22% 23%
20%
Asian Black Latino White
URBAN INSTITUTE
Source: 2015–19 American Community Survey data.
Income
The AMI in San Diego in 2022 is $106,900, higher than both the US AMI ($90,000) and California’s AMI
($101,600). Despite higher income than the nation, home prices in San Diego are unaffordable to many
households, resulting in a lower homeownership rate. The lower homeownership rate for households of
color within San Diego can be partially explained by income disparities.
According to 2015–19 American Community Survey data, the most recent five-year period for
which reliable data are available, white and Asian households have the highest median incomes, earning
$90,735 and $89,026, respectively. The Latino and Black median incomes are nearly 50 percent lower
($54,233 and $49,786, respectively). Figure 11 shows 64.8 percent of Black households earn below 80
percent of the AMI, compared with 38.7 percent of Asian households, 60.5 percent of Latino
households, and 36.8 percent of white households.
14 SAN DIEGO’S FIRST-TIME HOMEBUYER PROGRAMFIGURE 11
Income Composition, by Race or Ethnicity
Income as a share of the area median income
≥ 150% 120–150% 80–120% 50–80% < 50%
100%
12.9% 13.2%
90%
34.3% 6.2% 8.0% 34.4%
80%
70% 16.0%
18.3%
60% 10.7% 10.8%
22.8%
50% 23.1%
16.2% 18.0%
40%
30% 15.0% 15.0%
20% 42.0% 37.4%
10% 23.7% 21.8%
0%
Asian Black Latino White
URBAN INSTITUTE
Source: 2015–19 American Community Survey data.
But even after controlling for income, Black households are significantly less likely to be
homeowners than white households. Figure 12 shows homeownership rates by race, ethnicity, and
income level. Notably, the Black homeownership rate is lower than the white homeownership rate by at
least 13 percentage points at every income level except for households earning 120 to 150 percent of
the AMI. Black households in this income group have a homeownership rate of 54 percent, roughly
equal to the white homeownership rate of 53 percent. Importantly, the 1,909 Black households at this
income level account for only 3.9 percent of total households earning 120 to 150 percent of the AMI.
For context, Black households account for 10.0 percent of households making below 50 percent of the
AMI and 8.5 percent of households making between 50 and 80 percent of the AMI.
SAN DIEGO’S FIRST -TIME HOMEBUYER PROGRAM 15FIGURE 12
Homeownership Rates, by Race, Ethnicity, and Income
Asian Black Latino White
69.9% 71.6%
65.7%
59.2% 59.0%
54.2% 52.7%
49.5% 49.3%
46.0%
42.0%
39.0% 38.2%
35.4%
28.7% 29.7%
26.9%
23.7%
18.3%
13.2%
< 50% 50–80% 80–120% 120–150% ≥ 150%
Income as a share of the area median income
URBAN INSTITUTE
Source: 2015–19 American Community Survey data.
Age
Increased age is also correlated with homeownership. There is a greater share of the younger
population among people of color, which is another factor contributing to their lower homeownership
rate. Like other large cities, San Diego is younger than both California and the US as a whole. The share
of household heads younger than 35 is 29.1 percent, about 9 percentage points below the share in
California and 10 percentage points below the share in the nation. Within San Diego, heads of
households of color are younger than heads of white households. About a quarter of white households
are headed by someone 65 or older (figure 13).
16 SAN DIEGO’S FIRST-TIME HOMEBUYER PROGRAMFIGURE 13
Age Composition of Household Heads, by Race or Ethnicity
Younger than 35 35–44 45–54 55–64 65 and older
100%
15.4% 12.0%
90% 18.2%
25.1%
80% 13.3%
14.7%
16.6%
70%
20.1% 17.2%
60% 19.6%
17.9%
50% 15.6%
23.0%
40% 20.6% 16.5%
15.7%
30%
20%
29.7% 30.8% 31.6%
26.4%
10%
0%
Asian Black Latino White
URBAN INSTITUTE
Source: 2015–19 American Community Survey data.
Figure 14 shows homeownership rates by race and ethnicity for households with heads younger
than 45 and for households with heads ages 45 and older. Households with younger heads are unlikely
to be homeowners. Even young Asian householders, who have the highest rate of any racial or ethnic
group, have a 32.0 percent homeownership rate. But the homeownership rate for Black households
with younger heads is 8.1 percent, half that of young Latino households, who have the second-lowest
rate. Older Black household heads also have a substantially lower homeownership rate that is more
than 30 percentage points below that of Asian and white households.
SAN DIEGO’S FIRST -TIME HOMEBUYER PROGRAM 17FIGURE 14
Homeownership Rates, by Race, Ethnicity, and Age
Younger than 45 45 and older
66.6% 67.4%
46.9%
35.1%
32.0%
22.8%
16.2%
8.1%
Asian Black Latino White
URBAN INSTITUTE
Source: 2015–19 American Community Survey data.
Military
San Diego has a significantly large military population, especially active-duty members. About 10.4
percent of household heads in the city are veterans compared with 9.4 percent in the nation. Nearly 55
percent of San Diego’s veteran households own their homes, higher than the citywide homeownership
rate. Part of this high homeownership rate is because veterans have access to zero-down-payment VA
loans, making homeownership in expensive cities more accessible. Even though homeownership rates
are higher among veterans than among nonmilitary households for each race and ethnicity, the racial
homeownership gap persists among veterans. Asian and white veterans have homeownership rates of
73.0 and 60.4 percent, respectively, while Latino and Black veterans have respective rates of 38.7 and
31.0 percent (figure 15).
Active-duty military members account for 5.2 percent of San Diego household heads, significantly
higher than the national share of 0.7 percent. The overall homeownership rate for active-duty
households is low because they are younger and, on average, have a higher geographic mobility rate. In
San Diego, 8.1 percent of households headed by active-duty members were homeowners. The Black
active-duty members’ homeownership rate is 3.9 percent, nearly equal to the 4.0 percent Latino active-
duty members’ homeownership rate, and less than half the rate of white active-duty members (9.5
percent). The Asian active-duty members’ 21.7 percent homeownership rate is by far the highest of any
18 SAN DIEGO’S FIRST-TIME HOMEBUYER PROGRAMracial or ethnic group. Figure 15 shows the homeownership rates by race and ethnicity for veteran,
active-duty, and nonmilitary households.
FIGURE 15
Homeownership Rates, by Race, Ethnicity, and Military Status
Asian Black Latino White
73.0%
60.4%
47.8% 49.4%
38.7%
31.0% 30.7%
21.7% 22.7%
9.5%
3.9% 4.0%
Veteran Active-duty military Nonmillitary
URBAN INSTITUTE
Source: 2015–19 American Community Survey data.
Location
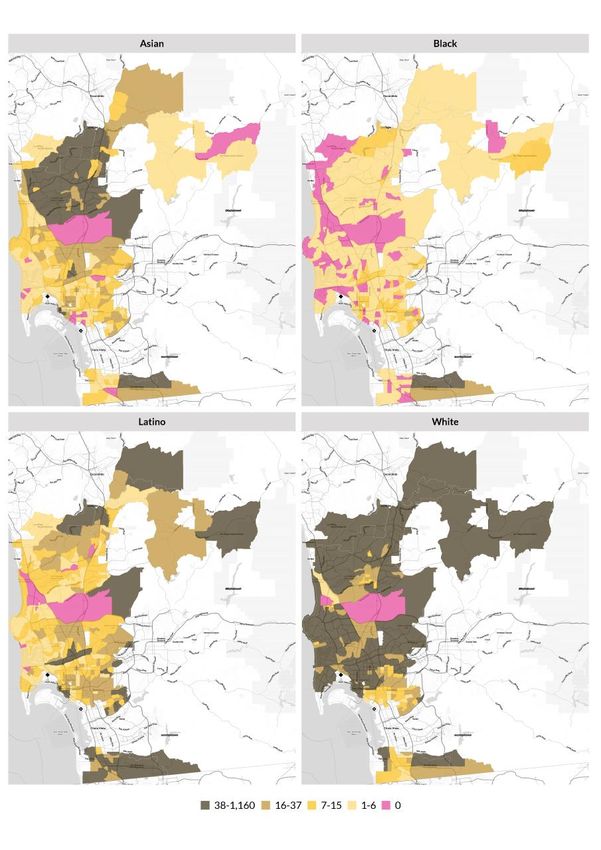
Figure 16 shows the racial and ethnic concentrations of Asian, Black, Latino, and white households by
census tract. White households are most concentrated in the city’s coastal and coastal-adjacent census
tracts, and they are spread relatively evenly across the central and northern census tracts. The
concentration of white households is lower in the Mira Mesa neighborhood, the area with the greatest
concentration of Asian households. Similarly, tracts in the Skyline-Paradise Hills, Encanto, City Heights,
Southeastern, and Otay Mesa neighborhoods compose a large area in the city’s southeast that has a
substantially less concentrated white population and substantially more concentrated Black and Latino
population than the rest of the city. No census tract is majority Black. Black households make up 37
percent of the total in the census tract where they are most concentrated. This suggests that targeting
Black homebuyers through a place-based approach may not be effective in San Diego.
SAN DIEGO’S FIRST -TIME HOMEBUYER PROGRAM 19FIGURE 16A
Neighborhood Racial and Ethnic Composition
Asian Black
URBAN INSTITUTE
Source: 2015–19 American Community Survey data.
20 SAN DIEGO’S FIRST-TIME HOMEBUYER PROGRAMFIGURE 16B
Neighborhood Racial and Ethnic Composition
Latino White
URBAN INSTITUTE
Source: 2015–19 American Community Survey data.
Figure 17 shows each census tract’s homeownership rate overall and by race and ethnicity. Black
households have the lowest homeownership rate of all racial groups in almost all neighborhoods. Except
for the census tracts in the southeast, where the Black homeownership rate is relatively high and Black
households are relatively concentrated, most of the tracts with a high Black homeownership rate have
few total Black households. Excluding all census tracts with less than 300 households for each racial and
ethnic group, the Black homeownership rate by census tract ranges from 0 to 88.5 percent. This range is
nearly identical to that of Latino households (0 to 87.5 percent). There are only two census tracts where
the white homeownership rate is 0 percent, but white households have a homeownership rate of 97.2
percent in the census tract with the highest white homeownership rate, roughly 10 percentage points
greater than the share for Black and Latino households. Asian households are the only group that does
not have a 0 percent homeownership rate in any census tract in which they account for more than 300
households, and their maximum homeownership rate in a tract is 98.0 percent.
SAN DIEGO’S FIRST -TIME HOMEBUYER PROGRAM 21FIGURE 17A
Neighborhood Homeownership Rates, by Race or Ethnicity
Asian Black
URBAN INSTITUTE
Source: 2015–19 American Community Survey data.
22 SAN DIEGO’S FIRST-TIME HOMEBUYER PROGRAMFIGURE 17B
Neighborhood Homeownership Rates, by Race or Ethnicity
Latino White
URBAN INSTITUTE
Source: 2015–19 American Community Survey data.
Mortgage Applications and Originations, by Race
and Ethnicity
Applications and Originations
Information from 2018–20 Home Mortgage Disclosure Act (HMDA) data shows a racial disparity in
mortgage applications and originations in San Diego. Despite Black households accounting for 6.1
percent of households in San Diego, banks originated only 2.8 percent of purchase mortgages to Black
borrowers. Lower application volume and a higher denial rate contribute to Black households’
disproportionately low share of mortgage originations. Only 2.9 percent of applicants were Black, and
their 11.7 percent denial rate is 2.8 percentage points higher than the city’s 8.9 percent denial rate. San
SAN DIEGO’S FIRST -TIME HOMEBUYER PROGRAM 23Diego’s denial rates are low compared with US rates, where 13.3 percent of all mortgage applications
and 24.8 percent of Black applications were denied. These low denial rates, combined with San Diego’s
low homeownership rate, suggest that high home prices deter households that may be able to own
homes elsewhere from applying for mortgages in San Diego.
Similarly, Latino householders remain underrepresented in new mortgage originations, accounting
for only 16.9 percent of them between 2018 and 2020 despite making up 23.3 percent of households.
Like Black households, Latino households’ 17.6 percent share of applications is disproportionately small,
and their 11.9 percent denial rate is the highest of all groups. Conversely, Asian and white households
are overrepresented in mortgage originations, accounting for 20.2 and 60.1 percent, respectively. Both
groups also composed a disproportionately high share of applications: 20.3 percent for Asian
households and 59.2 percent for white households. White households had the lowest denial rate (7.7
percent), while 9.3 percent of Asian households’ applications were denied, 0.4 percentage points above
the city’s overall denial rate (figure 18; table 2). That these two groups already had higher
homeownership rates and continue to be overrepresented in their share of mortgage originations
means that the racial homeownership gap between Asian and white households and Black and Latino
households is widening.
FIGURE 18
Application and Origination Shares for Home Purchase Loans, by Race or Ethnicity
Asian Black Latino White
Applications 20.3% 2.9% 17.6% 59.2%
Originations 20.2% 2.8% 16.9% 60.1%
0% 20% 40% 60% 80% 100%
URBAN INSTITUTE
Source: 2018–20 Home Mortgage Disclosure Act data.
24 SAN DIEGO’S FIRST-TIME HOMEBUYER PROGRAMTABLE 2
Denial Rates on Purchase Loans, by Race or Ethnicity
San Diego California US
Asian 9.3% 9.4% 10.5%
Black 11.7% 14.3% 24.8%
Latino 11.9% 12.3% 18.5%
White 7.7% 8.2% 10.9%
All 8.9% 9.8% 13.3%
Source: 2018–20 Home Mortgage Disclosure Act data.
In total, 807 purchase loans originated to Black borrowers between 2018 and 2020, compared with
the 4,838 loans originated to Latino borrowers and the 5,772 loans originated to Asian borrowers.
White borrowers had 17,180 loans originated. The median property value on mortgage originations for
Black and Latino households is $485,000, which is $200,000 lower than the median value for Asian and
white properties.
Lenders cited high DTI ratios as the leading reason for denial among all racial and ethnic groups in
San Diego during the application period. Black and Latino applicants were more likely to be denied
because of high DTI ratios or insufficient collateral (meaning the home is not worth the value of the
loan) in San Diego than nationally. Credit history was mentioned less frequently. This suggests that the
main reason for mortgage denials in San Diego is related to high home prices, which leads to greater
mortgage debt. Even among households who have sufficient credit, it is difficult to qualify for mortgages
because of the high housing debt payments they would have to make.
TABLE 3
Reasons for Purchase Loan Denials, by Race or Ethnicity
Asian Black Latino White All
San Diego
Debt-to-income ratio 34.9% 38.6% 35.4% 35.2% 35.3%
Credit history 8.4% 14.0% 18.9% 10.0% 11.9%
Insufficient collateral 10.7% 15.8% 12.6% 13.3% 12.7%
Credit application incomplete 14.6% 5.3% 9.2% 13.9% 12.6%
Other 12.9% 10.5% 10.0% 12.1% 11.7%
US
Debt-to-income ratio 37.8% 31.1% 33.3% 28.7% 30.5%
Credit history 11.6% 38.7% 30.1% 31.2% 31.3%
Insufficient collateral 10.1% 6.4% 8.6% 11.0% 9.7%
Credit application incomplete 11.8% 5.6% 6.6% 8.3% 7.7%
Other 9.7% 7.0% 7.4% 7.5% 7.5%
Source: 2018–20 Home Mortgage Disclosure Act data.
SAN DIEGO’S FIRST -TIME HOMEBUYER PROGRAM 25San Diego’s low denial rates fail to tell the complete story for homebuyers in the city. Data show
that compared with California and the US, aggregate applications and originations of purchase loans in
San Diego are low relative to the potential homebuyer population (i.e., renter households). The
implication is that San Diegan renters are less likely to apply for a mortgage and more likely to withdraw
an application after applying (table 4). Figure 19 shows that purchase mortgage originations during the
application period account for a smaller share of potential homebuyers in San Diego than in California
and the US.
FIGURE 19
Purchase Mortgage Originations as a Share of Total Renter Households, by Race or Ethnicity
Asian Black Latino White 10%
9%
7%
6%
5% 5% 5%
3% 3%
2% 2%
1%
San Diego California US
URBAN INSTITUTE
Sources: 2018–20 Home Mortgage Disclosure Act data and 2015–19 American Community Survey data.
The ratio for originations to Black and Latino renter households in San Diego was particularly low,
composing between 1 and 2 percent of potential homebuyers among those respective demographic
groups. This suggests that although households who submit mortgage applications have lower denial
rates, many households in San Diego are discouraged from applying for mortgages because of
unaffordable home prices. Households who apply for mortgages are more likely to withdraw their
applications in San Diego compared with the state and the nation, and this share was higher among
Black and Asian applicants (table 4).
26 SAN DIEGO’S FIRST-TIME HOMEBUYER PROGRAMYou can also read