South Dakota FFY2021 Highway Safety Plan
←
→
Page content transcription
If your browser does not render page correctly, please read the page content below

South Dakota FFY2021 Highway Safety Plan

                                       1
Contents
Highway Safety Plan                                                                                  12
Highway safety planning process                                                                      13
Data Sources and Processes                                                                           13
Processes Participants                                                                               13
Description of Highway Safety Problems                                                               13
Methods for Project Selection                                                                        15
List of Information and Data Sources                                                                 15
Description of Outcomes                                                                              15
Performance report                                                                                   16
  Performance Measure: C-1) Number of traffic fatalities (FARS)                                      17
    Program-Area-Level Report                                                                        17
  Performance Measure: C-2) Number of serious injuries in traffic crashes (State crash data files)   20
    Program-Area-Level Report                                                                        20
  Performance Measure: C-3) Fatalities/VMT (FARS, FHWA)                                              22
    Program-Area-Level Report                                                                        22
  Performance Measure: C-4) Number of unrestrained passenger vehicle occupant fatalities, all seat
  positions (FARS)                                                                                   25
    Program-Area-Level Report                                                                        25
  Performance Measure: C-5) Number of fatalities in crashes involving a driver or motorcycle operator
  with a BAC of .08 and above (FARS)                                                                 28
    Program-Area-Level Report                                                                        28
  Performance Measure: C-6) Number of speeding-related fatalities (FARS)                             31
    Program-Area-Level Report                                                                        31
  Performance Measure: C-7) Number of motorcyclist fatalities (FARS)                                 33
    Program-Area-Level Report                                                                        33
  Performance Measure: C-8) Number of unhelmeted motorcyclist fatalities (FARS)                      34
    Program-Area-Level Report                                                                        34
  Performance Measure: C-9) Number of drivers age 20 or younger involved in fatal crashes (FARS) 36
    Program-Area-Level Report                                                                        36
  Performance Measure: C-10) Number of pedestrian fatalities (FARS)                                  38
    Program-Area-Level Report                                                                        38
  Performance Measure: C-11) Number of bicyclists fatalities (FARS)                                  40
    Program-Area-Level Report                                                                        40

                                                                                                      2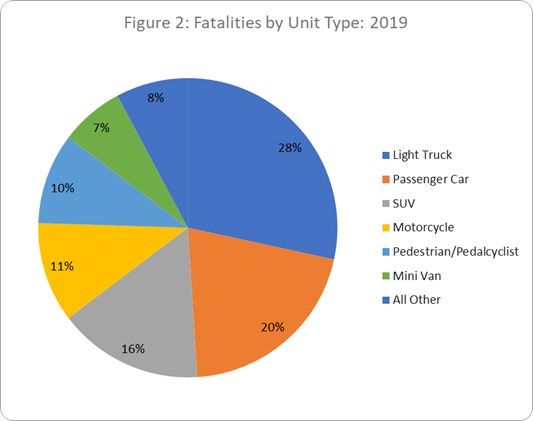
Performance Measure: B-1) Observed seat belt use for passenger vehicles, front seat outboard
  occupants (survey)                                                                                 41
    Program-Area-Level Report                                                                        41
  Performance Measure: Number of distracted driving fatalities (FARS)                                42
    Program-Area-Level Report                                                                        42
Performance Plan                                                                                     43
  Performance Measure: C-1) Number of traffic fatalities (FARS)                                      44
    Performance Target Justification                                                                 44
  Performance Measure: C-2) Number of serious injuries in traffic crashes (State crash data files)   45
    Performance Target Justification                                                                 45
  Performance Measure: C-3) Fatalities/VMT (FARS, FHWA)                                              46
    Performance Target Justification                                                                 46
  Performance Measure: C-4) Number of unrestrained passenger vehicle occupant fatalities, all seat
  positions (FARS)                                                                                   47
    Performance Target Justification                                                                 47
  Performance Measure: C-5) Number of fatalities in crashes involving a driver or motorcycle operator
  with a BAC of .08 and above (FARS)                                                                 48
    Performance Target Justification                                                                 48
  Performance Measure: C-6) Number of speeding-related fatalities (FARS)                             49
    Performance Target Justification                                                                 49
  Performance Measure: C-7) Number of motorcyclist fatalities (FARS)                                 50
    Performance Target Justification                                                                 50
  Performance Measure: C-8) Number of unhelmeted motorcyclist fatalities (FARS)                      51
    Performance Target Justification                                                                 51
  Performance Measure: C-9) Number of drivers age 20 or younger involved in fatal crashes (FARS) 51
    Performance Target Justification                                                                 51
  Performance Measure: C-10) Number of pedestrian fatalities (FARS)                                  52
    Performance Target Justification                                                                 52
  Performance Measure: C-11) Number of bicyclists fatalities (FARS)                                  53
    Performance Target Justification                                                                 53
  Performance Measure: B-1) Observed seat belt use for passenger vehicles, front seat outboard
  occupants (survey)                                                                                 53
    Performance Target Justification                                                                 54
  Performance Measure: Number of distracted driving fatalities (FARS)                                54
    Performance Target Justification                                                                 54
  Performance Measure: Traffic Records Completeness                                                  54

                                                                                                      3
Performance Target Justification 55
Program areas 55
Program Area: Distracted Driving 55
Description of Highway Safety Problems 55
Countermeasure Strategy: Media (Paid and Earned)-DD 56
Project Safety Impacts 56
Linkage Between Program Area 56
Rationale 56
Planned Activity: Media Non-Alcohol 56
Planned Activity Description 56
Intended Subrecipients 57
Countermeasure strategies 57
Funding sources 57
Program Area: Impaired Driving (Drug and Alcohol) 57
Description of Highway Safety Problems 57
Countermeasure Strategy: Community Training, Enforcement and Communication-IMP 58
Project Safety Impacts 58
Linkage Between Program Area 58
Rationale 58
Planned Activity: Alternative Transportation 59
Planned Activity Description 59
Intended Subrecipients 59
Countermeasure strategies 59
Funding sources 59
Planned Activity: Prevention and Interdiction 59
Planned Activity Description 60
Intended Subrecipients 60
Countermeasure strategies 60
Funding sources 60
Countermeasure Strategy: High Visibility Enforcement-IMP 60
Project Safety Impacts 60
Linkage Between Program Area 60
Rationale 60
Planned Activity: Impaired Driving High Visibility Enforcement 61
Planned Activity Description 61
4Intended Subrecipients 61
Countermeasure strategies 61
Funding sources 61
Major purchases and dispositions 61
Countermeasure Strategy: Highway Safety Office Program Management-IMP 62
Project Safety Impacts 62
Linkage Between Program Area 62
Rationale 62
Planned Activity: Personnel Support-IMP 62
Planned Activity Description 62
Intended Subrecipients 63
Countermeasure strategies 63
Funding sources 63
Planned Activity: Administrative and Contractual-IMP 63
Planned Activity Description 63
Intended Subrecipients 63
Countermeasure strategies 63
Funding sources 64
Planned Activity: Impaired Driving Task Force (Regulatory Requirement)-IMP 64
Planned Activity Description 64
Intended Subrecipients 64
Countermeasure strategies 64
Funding sources 64
Countermeasure Strategy: Judicial Related Education or Activity-IMP 64
Project Safety Impacts 65
Linkage Between Program Area 65
Rationale 65
Planned Activity: Judicial Assistance 65
Planned Activity Description 65
Intended Subrecipients 65
Countermeasure strategies 65
Funding sources 66
Countermeasure Strategy: Media (Paid and Earned)-IMP 66
Project Safety Impacts 66
Linkage Between Program Area 66
5Rationale 66
Planned Activity: Media-Alcohol 66
Planned Activity Description 66
Intended Subrecipients 66
Countermeasure strategies 67
Funding sources 67
Program Area: Motorcycle Safety 67
Description of Highway Safety Problems 67
Countermeasure Strategy: High Visibility Enforcement-MC 68
Project Safety Impacts 68
Linkage Between Program Area 68
Rationale 68
Planned Activity: Impaired Driving High Visibility Enforcement 68
Planned Activity Description 68
Intended Subrecipients 69
Countermeasure strategies 69
Funding sources 69
Countermeasure Strategy: Media (Paid and Earned)-MC 69
Project Safety Impacts 69
Linkage Between Program Area 69
Rationale 69
Planned Activity: Media Non-Alcohol 69
Planned Activity Description 70
Intended Subrecipients 70
Countermeasure strategies 70
Funding sources 70
Program Area: Non-motorized (Pedestrians and Bicyclist) 70
Description of Highway Safety Problems 70
Countermeasure Strategy: Community Training, Enforcement and Communication-B&P 71
Project Safety Impacts 71
Linkage Between Program Area 71
Rationale 71
Planned Activity: Communication and Outreach Campaigns-B&P 71
Planned Activity Description 71
Intended Subrecipients 72
6Countermeasure strategies 72
Funding sources 72
Program Area: Occupant Protection (Adult and Child Passenger Safety) 72
Description of Highway Safety Problems 72
Countermeasure Strategy: Community Training, Enforcement and Communication-OP 73
Project Safety Impacts 73
Linkage Between Program Area 73
Rationale 73
Planned Activity: Communication and Outreach Campaigns 73
Planned Activity Description 73
Intended Subrecipients 74
Countermeasure strategies 74
Funding sources 74
Countermeasure Strategy: High Visibility Enforcement-OP 74
Project Safety Impacts 74
Linkage Between Program Area 74
Rationale 74
Planned Activity: Occupant Protection High Visibility Enforcement 74
Planned Activity Description 75
Intended Subrecipients 75
Countermeasure strategies 75
Funding sources 75
Countermeasure Strategy: Highway Safety Office Program Management-OP 75
Project Safety Impacts 75
Linkage Between Program Area 75
Rationale 75
Planned Activity: Seatbelt Survey (Regulatory Requirement) 75
Planned Activity Description 76
Intended Subrecipients 76
Countermeasure strategies 76
Funding sources 76
Countermeasure Strategy: Media (Paid and Earned)-OP 76
Project Safety Impacts 76
Linkage Between Program Area 76
Rationale 76
7Planned Activity: Media Non-Alcohol 77
Planned Activity Description 77
Intended Subrecipients 77
Countermeasure strategies 77
Funding sources 77
Program Area: Planning & Administration 77
Description of Highway Safety Problems 77
Planned Activities 77
Planned Activity: Holding Account 78
Planned Activity Description 78
Intended Subrecipients 78
Funding sources 78
Planned Activity: Planning and Administration 78
Planned Activity Description 78
Intended Subrecipients 79
Funding sources 79
Program Area: Program Admin and Support 79
Description of Highway Safety Problems 79
Countermeasure Strategy: Community Training, Enforcement and Communication-402 79
Project Safety Impacts 79
Linkage Between Program Area 80
Rationale 80
Planned Activity: Law Enforcement Training 80
Planned Activity Description 80
Intended Subrecipients 80
Countermeasure strategies 80
Funding sources 80
Countermeasure Strategy: Highway Safety Office Program Management-402 80
Project Safety Impacts 81
Linkage Between Program Area 81
Rationale 81
Planned Activity: Administrative and Contractual-402 81
Planned Activity Description 81
Intended Subrecipients 81
Countermeasure strategies 81
8Funding sources 82
Planned Activity: Personnel Support-402 82
Planned Activity Description 82
Intended Subrecipients 82
Countermeasure strategies 82
Funding sources 83
Program Area: Speed Management 83
Description of Highway Safety Problems 83
Countermeasure Strategy: High Visibility Enforcement-SP 83
Project Safety Impacts 84
Linkage Between Program Area 84
Rationale 84
Planned Activity: Speeding High Visibility Enforcement 84
Planned Activity Description 84
Intended Subrecipients 84
Countermeasure strategies 84
Funding sources 84
Major purchases and dispositions 85
Countermeasure Strategy: Media (Paid and Earned)-SP 85
Project Safety Impacts 85
Linkage Between Program Area 85
Rationale 85
Planned Activity: Media Non-Alcohol 85
Planned Activity Description 85
Intended Subrecipients 85
Countermeasure strategies 86
Funding sources 86
Program Area: Traffic Records 86
Description of Highway Safety Problems 86
Countermeasure Strategy: Highway Safety Office Program Management-Data 87
Project Safety Impacts 87
Linkage Between Program Area 87
Rationale 87
Planned Activity: TRCC (Regulatory Requirement) 87
Planned Activity Description 87
9Intended Subrecipients 87
Countermeasure strategies 87
Funding sources 87
Countermeasure Strategy: Traffic Records System Improvements 88
Project Safety Impacts 88
Linkage Between Program Area 88
Rationale 88
Planned Activity: Traffic Records Projects 88
Planned Activity Description 88
Intended Subrecipients 89
Countermeasure strategies 89
Funding sources 89
Planned Activity: Data Systems Improvements 89
Planned Activity Description 89
Intended Subrecipients 89
Countermeasure strategies 89
Funding sources 90
Program Area: Young Drivers 90
Description of Highway Safety Problems 90
Countermeasure Strategy: Driver Education 90
Project Safety Impacts 90
Linkage Between Program Area 91
Rationale 91
Planned Activity: Driver Education Coordinator 91
Planned Activity Description 91
Intended Subrecipients 91
Countermeasure strategies 91
Funding sources 91
Planned Activity: Driver Education 91
Planned Activity Description 92
Intended Subrecipients 92
Countermeasure strategies 92
Funding sources 92
Countermeasure Strategy: School Programs 92
Project Safety Impacts 92
10Linkage Between Program Area 92
Rationale 92
Planned Activity: Teen Safety Programs 93
Planned Activity Description 93
Intended Subrecipients 93
Countermeasure strategies 93
Funding sources 93
Major purchases and dispositions 93
Evidence-based traffic safety enforcement program (TSEP) 94
Crash Analysis 94
Deployment of Resources 94
Effectiveness Monitoring 94
High-visibility enforcement (HVE) strategies 95
11Highway Safety Plan
NATIONAL PRIORITY SAFETY PROGRAM INCENTIVE GRANTS - The State applied for the
following incentive grants:
S. 405(b) Occupant Protection: No
S. 405(e) Distracted Driving: No
S. 405(c) State Traffic Safety Information System Improvements: Yes
S. 405(f) Motorcyclist Safety Grants: No
S. 405(d) Impaired Driving Countermeasures: Yes
S. 405(g) State Graduated Driver Licensing Incentive: No
S. 405(d) Alcohol-Ignition Interlock Law: No
S. 405(h) Nonmotorized Safety: No
S. 405(d) 24-7 Sobriety Programs: Yes
S. 1906 Racial Profiling Data Collection: No
12Highway safety planning process
Data Sources and Processes
All of the data presented and analyzed in this report are from the South Dakota Accident Records
System or the Fatality Analysis Reporting System maintained by the National Highway Traffic
Safety Administration. This South Dakota Accident Records System is collected and maintained
by the South Dakota Office of Highway Safety. In addition, citation data is based on reports from
the South Dakota Unified Judicial System and data points related to seatbelt use or drawn from the
annual Statewide Seatbelt Use Report. South Dakota Office of Highway Safety also consults and
coordinates with the South Dakota Department of Transportation in establishing specific
performance measures as they relate to certain problem areas and strategies. Performance targets
for 2017-2021 were established by evaluating long-term trends for each of the course measures to
create goals that were aggressive yet attainable. Countermeasures were chosen to target the
specific problem areas we have identified in the state.
Processes Participants
Due to the COVID-19 pandemic, the South Dakota Office of Highway Safety had to cancel the
four grant training workshops for FFY2021. Law enforcement agencies statewide and past
community subrecipients received email correspondence on how to apply for a FFY2021 Highway
Safety grant.
Description of Highway Safety Problems
Given that its 884,659 residents[1] are distributed over 77,121 square miles of terrain, South Dakota
remains one of the nation’s most sparsely populated states. The markedly rural character of South
Dakota’s landscape presents distinctive challenges to traffic crash prevention and management.
Altogether, rural roads and highways comprise 96.0% of the 81,969 total roadway miles that
crisscross the state, and in 2019, rural travel accounted for 69.9% of all vehicle miles traveled[2].
The difficulties associated with designing and administering effective highway safety programs
across a rural geography amplify the need for well-focused, systematic planning efforts. Further,
it follows that the physical dispersion of South Dakota's drivers brings about a marked need for
motor vehicle transportation.
Through the lens of major traffic crash indicators, observers of highway safety outcomes witnessed
an especially encouraging year of improvements. Of the 20,390 traffic crashes reported through
the South Dakota Accident Reporting System (SDARS) data system in 2019, positive
directionalities were observed across a wide range of outcomes measures.
● In total, 102 traffic crash fatalities were recorded in South Dakota in 2019, a substantial
decrease from the 130 in 2018.
● The number of serious injuries recorded in 2019 represents a decrease of 8.6% from the
analogous 2018 total. Of the 4, 872 non-fatal traffic crash injuries sustained in 2019, only
520 were considered serious or incapacitating.
13● The 2019 statewide fatality rate of 1.03 is 21.3% lower than the rate in 2018.
● A total of 42 unrestrained passenger vehicle occupants were killed in traffic crashes in
2019, a 28.8% decrease from 2018 (59).
● The number of fatalities arising from crashes involving at least one driver or motorcycle
operator with a BAC of .08 or above decreased 46.7% from 2018 to 2019; the total number
of crashes involving intoxicated drivers, however, stayed the same.
● A total of 26 individuals were killed in 2019 as a result of traffic crashes involving at least
one speeding driver, a decrease of 48% since 2018. Three of these fatalities were
pedestrians.
● There were only 11 motorcyclist fatalities in 2019, a 31.2% decrease from 2018. Of those
fatalities, 6 were unhelmeted.
● 17 drivers under the age of 21 were involved in a fatal traffic crash in 2019, the same
number as in 2018. 18 fatalities resulted from these crashes, an 18.2% decrease since 2018
(22).
● The number of annual bicyclist fatalities in South Dakota is consistently very low. There
was only one reported in 2019.
These positive outcomes are in spite of the fact that both population and vehicle miles traveled in
South Dakota continued to increase in 2019. This increase alone ushers in an opportunity for a rise
in traffic crashes in South Dakota. The positive outcomes also occurred in spite of a continued
prevalence of rural over urban travel in South Dakota. It should be noted, however, that there were
two areas in which South Dakota did not see improvements in 2019.
● The number of pedestrian and pedalcyclist fatalities in South Dakota remains quite small
with only 9 pedestrian fatalities in 2019, however five-year averages for this measure are
starting to increase slightly.
● The 2019 estimate for statewide estimated safety restraint usage on all road types was
75.2%, a 3.7% decrease from 2018 (78.9%). It is worth noting that 2018 was 4.1% higher
than the reported usage in 2017, so the higher 2018 value may be a bit of an outlier. The
2019 value is still slightly higher than the 2017 percentage.
These accomplishments point to the overall effectiveness of the Office of Highway Safety in
South Dakota. Through the design, coordination, and monitoring of effective prevention strategies
and countermeasures, and by working in cooperation with an alliance of statewide partners, the
Office of Highway Safety seeks to vigorously pursue its mission to minimize economic and human
loss resulting from traffic crashes.
[1]
US Census Bureau estimate for 2019
[2]
http://www.sddot.com/transportation/highways/traffic/docs/VMTAllvehicles.pdf
14Methods for Project Selection
Typically, the South Dakota Office of Highway Safety provides four grant training workshops
throughout the state every year. Potential applicants attend these workshops in order to understand
the application process and the rules and requirements of the Highway Safety grant program. Due
to the COVID-19 pandemic, the Office of Highway Safety was unable to host the grant training
workshops. All law enforcement and community applications are reviewed by Office of Highway
Safety employees. Applications that are approved to be a part of the Highway Safety Plan
demonstrate a Highway Safety related problem along with proven countermeasures that will be
deployed to prevent injuries and fatalities on South Dakota’s roadways.
List of Information and Data Sources
All of the data presented and analyzed in this report are from the South Dakota Accident Records
System or the Fatality Analysis Reporting System maintained by the National Highway Traffic
Safety Administration. This South Dakota Accident Records System is collected and maintained
by the South Dakota Office of Highway Safety. In addition, citation data is based on reports from
the South Dakota Unified Judicial System and data points related to seatbelt use or drawn from the
annual Statewide Seatbelt Use Report.
Description of Outcomes
The 2021 plan begins with a broad data presentation organized around the core outcome and core
behavior measures required as mandatory reporting items by NHTSA. Interlaced into this section
are the performance goals established by the Office of Highway Safety through collaboration with
external partners. In developing and implementing the strategies and plans of the Highway Safety
Plan and the Strategic Highway Safety Plan, the Office of Highway Safety has worked in
coordination with the South Dakota Department of Transportation (SDDOT). All the data
presented and analyzed in this report are from the Federal Accident Records System or the South
Dakota Accident Records System. The later data is collected and maintained by the South Dakota
Office of Highway Safety. Due to significant improvements in our ability to collect crash reports
(approximately 95% of reports are submitted electronically), there is little to no delay in the
uploading of these reports. This allows the data to be readily available for performance monitoring
throughout the year. Lee Axdahl, the Director of Highway Safety also serves on the steering
committee for the development of the Strategic Highway Safety Plan, which helps to ensure that
the efforts are coordinated. For each of the core outcome measures addressed in the plan,
supporting data is provided to justify the established goals. Goals are made in relation to long-term
projections as well as the most recent year’s data points.
15Performance report
Progress towards meeting State performance targets from the previous fiscal year's HSP
Sort Performance measure name Progress
Order
1 C-1) Number of traffic fatalities (FARS) In
Progress
2 C-2) Number of serious injuries in traffic crashes (State crash data files) In
Progress
3 C-3) Fatalities/VMT (FARS, FHWA) In
Progress
4 C-4) Number of unrestrained passenger vehicle occupant fatalities, all seat In
positions (FARS) Progress
5 C-5) Number of fatalities in crashes involving a driver or motorcycle operator In
with a BAC of .08 and above (FARS) Progress
6 C-6) Number of speeding-related fatalities (FARS) In
Progress
7 C-7) Number of motorcyclist fatalities (FARS) In
Progress
8 C-8) Number of unhelmeted motorcyclist fatalities (FARS) In
Progress
9 C-9) Number of drivers age 20 or younger involved in fatal crashes (FARS) In
Progress
10 C-10) Number of pedestrian fatalities (FARS) In
Progress
11 C-11) Number of bicyclists fatalities (FARS) In
Progress
12 B-1) Observed seat belt use for passenger vehicles, front seat outboard occupants In
(survey) Progress
13 Number of distracted driving fatalities (FARS) In
Progress
16Performance Measure: C-1) Number of traffic fatalities (FARS)
Progress: In Progress
Program-Area-Level Report
2020 Performance Goal
Goal Statement: Decrease the traffic fatalities five-year average to 126.4 or less for 2016-2020.
Current Value (2014-2018): 129
Current Status: In Progress
Key Observations from 2019 Data
● In total, 102 traffic crash fatalities were recorded in South Dakota in 2019, a decrease from
the 130 in 2018.
● Similar to previous years, the vast majority (90.2%) of traffic crash fatalities in South
Dakota in 2019 were motorists, as opposed to pedestrians or pedalcyclists.
Recent Data
Of the 20,390 motor vehicle traffic crashes reported in South Dakota in 2019, 88 (0.43% of total
crashes) resulted in at least one fatality. In total, 102 traffic crash fatalities were recorded in South
Dakota in 2019, a decrease from 130 in 2018. Of these fatalities, 90 (88.2%) were sustained by
residents of South Dakota. As was the case in previous years, the majority of fatalities were the
vehicle operators. In 2019, 70 fatalities (68.6%) of all traffic crash fatalities, were operators of
motor vehicles.
Table 1 presents basic fatality counts and annual percentage changes from 2015 to 2019. Figure 1
provides a visual representation of fatalities in South Dakota over the same period, as expressed
through five-year averages.
Table 1. Annual Traffic Crash Fatalities: 2015-2019
Fatalities % Change
2015 134 -2.3%
2016 116 -13.4%
2017 129 +11.2%
2018 130 +0.01%
2019 102 -21.5%
17Figure 2 presents traffic crash fatalities by unit type for 2019. From this data, it can be seen that
the vast majority of traffic crash fatalities in South Dakota are motorists, as opposed to pedestrians
or pedalcyclists. With regard to the 102 traffic crash fatalities recorded in 2019, 92 (90.2%) were
motor vehicle occupants with the largest percentages coming from light trucks (28.4%), passenger
cars (20.6%), SUVs (15.7%), and motorcycles (10.8%). Of all motor vehicle occupant fatalities,
70.6% (72) were male. Occupants and operators aged 21-30 years accounted for 23.5% (24) of all
occupant fatalities, the highest of any 10-year age span group. 64.7% (66) of fatalities occurred on
roads where the speed limit was 55 or greater. Finally, 79.4% (81) of 2019 traffic crash fatalities
occurred on rural roadways while the remaining 20.6% (21) occurred on urban roadways.
Reporting on core measure C-3 will go further in elaborating on the overwhelmingly rural nature
of South Dakota’s road system and describing the implications of this condition on traffic crash
outcomes.
18Table 2 displays calculated values for a modified per capita measure of traffic crash fatalities: total
fatalities per 100,000 in-state population. This metric provides a relative indicator of fatality
incidence, indexed to dynamic population counts. The figures presented in this table supply
another means by which to examine trending features with respect to traffic crash fatalities in
South Dakota. By this measure, the state fatality rate decreased 21.8% last year and has witnessed
a 52.5% cumulative improvement in fatality outcomes since 2006.
[1]
Table 2. Total Fatalities per 100,000 In-State Population: 2006-2019
Population Per 100,000 Annual %
Total Fatalities
Estimate Population Change
2006 787,380 191 24.26 --
2007 795,689 146 18.35 -24.4%
2008 804,194 121 15.05 -18.0%
2009 812,383 131 16.13 7.2%
192010 814,180 140 17.20 6.6%
2011 824,082 111 13.47 -21.7%
2012 833,354 133 15.96 18.5%
2013 844,877 135 15.98 0.1%
2014 853,175 136 15.94 -0.2%
2015 858,469 134 15.49 -2.8%
2016 865,454 116 13.40 -13.5%
2017 869,666 129 14.83 10.7%
2018 882,235 130 14.74 -0.7%
2019 884,659 102 11.53 -21.8%
[1] That each of the major “per unit denominators” commonly used in traffic crash reporting (such as population counts, registered
vehicle counts, and registered driver counts) are unavoidably mis-specified is a well-worn topic. It is commonly acknowledged
that no single per unit measure is both broadly and consistently inclusive of and only of those indexing units most relevant to the
primary “numerator” measure. Indeed, population figures may be construed as a biased control factor due to the tendency for in-
state fatality counts to include out-of-state motorists. However, in-state population is favored here due to its straightforward
parsimony and its inter-state definitional reliability.
Performance Measure: C-2) Number of serious injuries in traffic crashes (State crash data
files)
Progress: In Progress
Program-Area-Level Report
2020 Performance Goal
Goal Statement: Decrease the serious traffic injuries five-year average to 667.4 or less for the
2016-2020 time period.
Current Value (2014-2018): 789
Current Status: In Progress
20Key Observations from 2019 Data
● 4,872 non-fatal traffic crash injuries were sustained in 2019, 520 of which were serious or
incapacitating. (This total includes 2643 “possible” injuries included in the South Dakota
Crash Data).
● The number of serious injuries recorded in 2019 represents a decrease of 8.61% from the
analogous 2018 total.
Recent Data
A grand total of 4,974 injuries were sustained as a result of traffic crashes in 2019, 102 (2.05%) of
which were ultimately fatal. Of non-fatal injuries, 520 (10.7%) were serious or incapacitating. The
number of serious injuries recorded in 2019 (520) represents an 8.61% decrease from the same
figure in 2018 (569); this is the fourth year in a row in which we have seen a sizable decrease in
the number of serious injuries. The decrease in total non-fatal injuries was 0.12%.
Table 3 displays frequency counts and average annual changes for all non-fatal injuries and serious
injuries from 2015–2019. Figures 4 and 5 present five-year average trend lines for total non-fatal
injuries (Figure 3) and serious injuries (Figure 4). As can be seen in the graphs, the five-year
average for total and serious injuries have both continually decreased since the 2005-2009 time-
period.
Table 3. Annual Traffic Crash Non-Fatal Injuries, Total and Serious: 2015-2019
Total Injuries % Change Serious Injuries % Change
2015 5,525 +8.6% 803 +8.8%
2016 5,166 -6.5% 692 -13.8%
2017 5,448 +5.5% 649 -6.2%
2018 5,008 -8.1% 569 -12.3%
2019 4,974 -0.68% 520 -8.61%
21Performance Measure: C-3) Fatalities/VMT (FARS, FHWA)
Progress: In Progress
Program-Area-Level Report
2020 Performance Goals
Goal Statement (a): Decrease the five-year average fatalities/VMT to an average rate of 1.28 or
less for 2016-2020.
22Current Value (2014-2018): 1.36
Current Status: In progress
Goal Statement (b): Decrease the five-year average rural fatalities/VMT to an average rate of 1.57
or less for 2016-2020.
Current Value (2014-2018): 1.67
Current Status: In progress
Goal Statement (c): Decrease the five-year average urban fatalities/VMT to an average rate of
0.59 or less for 2016-2020.
Current Value (2014-2018): .65
Current Status: In progress
Key Observations from 2019 Data
• Since such a large proportion of South Dakota’s roadways are located in rural areas, overall
fatality rate figures are heavily influenced by traffic crashes occurring on rural roadways.
• The 2019 statewide fatality rate of 1.03 is 21.3% lower than the rate in 2018. The most recent
five-year average fatality rate has decreased 31.0% from the 2005-2009 average.
• Injury-to-fatality ratios suggest that rural crashes remain more likely than urban crashes to
produce fatalities, all else being equal.
Recent Data
South Dakota’s highway system is dominated by vastness. The state’s geographic expansiveness
and sparse population combine to result in a marked reliance on travel by rural roadways. In 2019,
South Dakota’s state and local governments maintained 81,969 miles of roadways, 96.0% of which
(78,669) were designated by the state Department of Transportation as rural. In addition, 69.9% of
all vehicle miles traveled in South Dakota occurred on rural highways and streets. Table 4 exhibits
basic figures for miles of roadways and vehicle miles traveled (VMT) in South Dakota for 2019.
Overall, the 9.9 billion total VMT figure for 2019 represents an increase of 2.1% from the 9.7
billion VMT figure for 2018.
23Table 4. South Dakota Roadways and VMT: 2019
Values % of Total
Rural Miles 78,669.040 95.97%
Urban Miles 3,300.05 4.03%
Total Miles 821,969.09 100%
Rural VMT 6,926,458,375 69.90%
Urban VMT 2,982,768,472 30.10%
Total VMT 9,909,226,847 100%
Since such a large proportion of South Dakota’s roadways are located in rural areas, overall fatality
rate figures are heavily influenced by traffic crashes occurring on rural roadways. Table 5 provides
fatality and injury rate figures for 2015–2019, segmented by location type. (“Fatality rate” is
defined here as the number of fatalities per 100 million vehicle miles traveled. Likewise, “injury
rate” expresses the number of injuries (all severity levels, not including fatalities) per 100 million
vehicle miles traveled.)
Table 5. Fatality and Injury Rates by Location: 2015-2019*
Total Rural Urban
Total Rural Urban
Fatality Fatality Fatality
Injury Rate Injury Rate Injury Rate
Rate Rate Rate
2015 1.42 1.730 0.72 59.16 35.50 114.66
2016 1.23 1.61 0.42 54.58 33.31 104.00
2017 1.34 1.54 0.86 57.03 33.30 111.21
2018 1.34 1.71 0.48 51.62 28.68 104.81
2019 1.03 1.17 0.70 49.17 27.60 99.20
% Change
-21.31% -31.58% 45.83% -4.98% -3.77% -5.35%
('18 to '19)
* Rural + Urban fatalities/injuries may not add to total, because some accident reports include no
rural/urban designation
24In 2019, 23.6 non-fatal injuries were recorded for each fatality in rural areas. By contrast, 141.7
non-fatal injuries per fatality were recorded in urban areas. Like the rural-urban disparities in basic
fatality rates, the above injury-to-fatality ratios suggest that rural crashes are more likely than urban
crashes to produce fatalities, all else being equal. This observation implies that states like South
Dakota, whose distinctively rural composition produces unique geographic contexts, face unique
challenges to effective traffic crash management.
Figure 5 demonstrates a mostly downward trend across five-year averages for total, rural, and
urban fatality rates since the initial 2005-2009 average. As expected, average rural fatality rates
are substantially higher than comparable urban fatality rates for each of the last ten time periods.
The reasons for this tendency are at least partially intuitive, including but not limited to the
characteristically higher allowable rates of speed on rural roadways and the increased transit time
required for emergency responders to arrive at crash sites.
Performance Measure: C-4) Number of unrestrained passenger vehicle occupant
fatalities, all seat positions (FARS)
Progress: In Progress
Program-Area-Level Report
2020 Performance Goal
25Goal Statement: Decrease the unrestrained passenger vehicle occupant fatalities five-year average
to 62.6 or less for 2016- 2020.
Current Value (2014-2018): 62
Current Status: In progress
Key Observations from 2019 Data
• A total of 42 unrestrained passenger vehicle occupants were killed in traffic crashes in 2019,
a 28.8% decrease from 2018 (59).
• In 2019, 57.3% of unrestrained passenger vehicle occupants involved in a traffic crash
sustained an injury, fatal or otherwise. By contrast, only 15.5% of restrained occupants
suffered an injury or fatality.
• 64.3% of all unrestrained driver fatalities in passenger vehicles in 2019 were sustained by
males.
Recent Data
In 2019, 26,356 passenger vehicle occupants were involved in traffic crashes, 1,322 of which were
unrestrained. (Here, “unrestrained” passengers are those not wearing a seatbelt or shoulder harness,
as well as a child occupant not properly secured in a child restraint system. The restraint usage
status was unknown for 1,997 individuals.) Of these unrestrained occupants whose injury status
was known, 42 (3.2%) were killed, 145 (11.0%) sustained a serious injury, and 570 (43.1%)
received other injuries. (“Other” injuries include those recorded as having “possible” injuries.)
Altogether then, 57.3% of these occupants suffered an injury, fatal or otherwise. By contrast, only
15.5% of restrained passenger vehicle occupants involved in a traffic crash sustained an injury or
fatality. Table 6 presents crash outcome figures for all unrestrained passenger vehicle occupants
in South Dakota from 2015–2019. Figure 6 presents five-year averages from 2005 to 2019 of
unrestrained passenger vehicle occupant fatalities.
Table 6. Injury Outcomes of Unrestrained Passenger Vehicle Occupants: 2015-2019*
Serious Other
Fatalities No Injuries Total
Injuries Injuries
2015 60 228 567 544 1399
2016 58 296 752 670 1776
2017 64 163 565 527 1319
2018 59 220 610 555 1444
2019 42 145 570 565 1322
262019 (%) 3.2% 11.0% 43.1% 42.7% 100.0%
All Years (%) 3.9% 14.5% 42.2% 39.4% 100.0%
*Passenger vehicle includes Cargo Van (10,000 pounds or less), light truck, mini-van, passenger
van with seats for 8 or less including driver, passenger car, single unit truck (10,000 pounds or
less) van/bus with seats for 9-15 people including driver and SUVs.
((https://www.fhwa.dot.gov/policy/ohpi/vehclass.htm)
South Dakota Codified Law 32-37-1 requires passenger vehicle operators to secure all occupants
under the age of five in a child restraint system. Given the practical implications of this statute,
discussion of passenger vehicle restraint usage is made more productive by considering two
separate age groups: ages less than five and ages five and over. In 2019, zero children under the
age of five were killed as passenger vehicle occupants. Seven children under the age of five
suffered serious injuries; two of these children were unrestrained.
Of the 77 passenger vehicle occupants 5 or over that sustained fatal injuries, 42 (54.5%) were
unrestrained. (“Unrestrained” includes those who used no restraint or youth restraint system used
improperly.) Within these occupants, males accounted for 64.3% (27) of all unrestrained fatalities
and 69.9% (100) of all unrestrained serious injuries of passenger vehicle occupants 5 or older.
27In 2019, 36.4%% (28) of all passenger vehicle occupants sustaining a fatal injury were either
partially or totally ejected from the vehicle. Of the 96 passenger vehicle occupants who were
partially or totally ejected from the vehicle during a crash, 74.0% (71) suffered a serious injury or
fatality. Finally, among those who were partially ejected, only 20% (2) had been restrained; 80%
(8) were unrestrained. A substantial majority (93.0%) of those who were totally ejected were
unrestrained, though the restraint status is unknown for 4.7% of those ejected. Table 7 presents
2018 data on ejection status by restraint usage for passenger vehicle occupants only (all ages).
Table 7. Ejection Status by Restraint Usage: 2019*
Partially Totally
Not Ejected Total
Ejected Ejected
None 4.2% 80.0% 93.0% 4.5%
Belt/harness 87.6% 20.0% 1.2% 87.3%
Other, Unreported, Unknown 8.0% 0.0% 4.7% 8.0%
Youth restraint used
improperly 0.0% 0.0% 0.0% 0.0%
Youth restraint used properly 0.2% 0.0% 1.2% 0.2%
Grand Total 100.0% 100.0% 100.0% 100.0%
*This table does not include individuals for whom injury data was unknown or missing.
Performance Measure: C-5) Number of fatalities in crashes involving a driver or
motorcycle operator with a BAC of .08 and above (FARS)
Progress: In Progress
Program-Area-Level Report
2020 Performance Goal
Goal Statement: Decrease the five-year average for BAC related fatalities to 41.7 or less for
2016-2020.
Current Value (2014-2018): 35.4
Current Status: In progress
28Key Observations from 2019 Data
• The number of fatalities arising from crashes involving at least one driver or motorcycle
operator with a BAC of .08 or above decreased 46.7% from 2018 to 2019; the total number
of crashes involving intoxicated drivers, however, stayed the same.
• In 2019, 66.7% of fatalities (16) involving at least one driver or motorcycle operator with a
BAC of .08 or above were sustained by intoxicated drivers themselves.
Recent Data
In South Dakota, it is considered a criminal offense for any driver to operate a motor vehicle while
maintaining a blood alcohol content (BAC) level of .08 or higher. (Drivers with a BAC level of
.08 or higher will occasionally be referred to in this report as “intoxicated drivers.”). Altogether,
20,390 traffic crashes were reported in 2019, 512 of which involved at least one driver with a BAC
reading of .08 or above. In other words, 2.5% of all accidents involved at least one driver with a
BAC of .08 or higher. A total of 856 individuals were involved in these crashes.
Table 8 shows annual figures and percentage changes for crashes involving at least one driver or
motorcycle operator with a BAC reading of .08 or higher, compared to figures for total crashes.
Table 8. BAC Crashes and Total Crashes: 2015-2019*
% Total Crashes that % Annual Change
BAC Crashes Total Crashes
were BAC Crashes in BAC Crashes
2015 477 17,789 2.7% 0.0%
2016 477 17,497 2.7% 0.0%
2017 526 18,380 2.9% +10.3%
2018 485 19,045 2.5% -13.8%
2019 512 20,390 2.5% +0.0%
*BAC Crashes refer to those crashes wherein at least one driver was found to have a BAC level
of .08 or higher.
Table 9 presents frequency counts of fatalities and injuries resulting from traffic crashes involving
at least one driver with a BAC reading of .08 or higher. From 2005–2019, 632 fatalities and 1143
serious injuries were sustained in crashes involving at least one operator exceeding the legal BAC
limit. In 2019 alone, 24 fatalities and 49 serious injuries were reported in analogous traffic crashes.
The fatality figure represents a 46.7% decrease from 2018 (45). However, the total number of
accidents involving a driver with a BAC of .08 or above actually increased 6%.
29Of the fatalities resulting from crashes with at least one intoxicated driver, 16 (67.7%) were
themselves drivers with a BAC level of .08 or higher. Among drivers with a BAC of .08 or higher
that were also fatalities, 87.5% (14) carried an in-state driver’s license; 31.3% (5) were operating
without or under a revoked or suspended license; 75% (12) were male; and 25% (4) were 25 years
old or younger.
Table 9. Injury Outcomes for Individuals Involved in BAC Crashes: 2005-2019
Serious Other
Fatalities No Injury Total
Injuries Injuries
2005 70 74 120 143 395
2006 67 83 192 181 511
2007 44 68 152 225 483
2008 35 75 187 328 625
2009 54 81 207 361 703
2010 37 80 199 367 683
2011 33 88 211 401 733
2012 44 104 268 382 798
2013 41 81 250 491 863
2014 44 68 216 452 780
2015 44 74 276 475 869
2016 46 80 296 476 898
2017 36 73 239 411 759
2018 45 65 165 504 779
2019 24 49 220 563 856
2019 (%) 5.78% 8.34% 21.18% 64.70% 100.00%
All Years (%) 6.2% 11.1% 30.2% 52.6% 100.0%
30Figure 7 displays five-year averages for fatalities reported from 2005–2019. Fatalities resulting
from these traffic crashes accounted for 23.5% of all fatalities recorded in 2019.
Performance Measure: C-6) Number of speeding-related fatalities (FARS)
Progress: In Progress
Program-Area-Level Report
2020 Performance Goal
Goal Statement: Decrease the five-year average for speeding related fatalities to 34.7 or less for
2016-2020.
Current Value (2014-2018): 36.2
Current Status: In progress
Key Observations from 2019 Data
• A total of 26 individuals were killed in 2019 as a result of traffic crashes involving at least
one speeding driver. This figure has decreased by 48% since 2018.
31• 88.5% of speeding-related fatalities in 2019 were sustained by motor vehicle occupants;
11.5% of these fatalities were pedestrians.
• 76.9% of speeding-related fatalities in 2019 occurred on rural roadways.
Recent Data
In 2019, 2468 traffic crashes occurred that involved at least one speeding driver (12.1% of all
reported traffic crashes); a total of 3,881 people were involved. Of these individuals, 26 (0.7%)
sustained fatal injuries, 122 (3.1%) suffered serious but non-fatal injuries, and 664 (17.1%)
received non-serious injuries. This means that 25.5% percent of South Dakota's traffic crash
fatalities were sustained in roadway incidents involving at least one speeding driver. 88.5% of
speeding-related fatalities in 2019 were sustained by motor vehicle occupants; 11.5% of these
fatalities were pedestrians. Figure 8 displays the five-year averages for speeding-related fatalities
during the 2005–2019 period.
32Performance Measure: C-7) Number of motorcyclist fatalities (FARS)
Progress: In Progress
Program-Area-Level Report
2020 Performance Goal
Goal Statement: Decrease the five-year average for motorcyclist fatalities to 19.6 or less for 2016-
2020.
Current Value (2014-2018): 20.4
Current Status: In progress
Key Observations from 2019 Data
• Motorcycles were involved in only 1.8% of traffic crashes in 2019, however motorcyclists
accounted for (11) 10.8% of all fatalities.
• Of the 14 fatalities sustained in traffic crashes involving motorcycles in 2016, 11 (78.6%)
were suffered by motorcycle occupants, all of which were the motorcycle operators.
• 9 (81.8%) of the motorcyclist fatalities recorded in 2019 were incurred by males.
Recent Data
In 2019, 362 traffic crashes involving motorcycles were reported, amounting to approximately
1.8% of all traffic crashes. (In sections C7 and C8, references to “motorcycles” and “motorcycle
operators/occupants” also include mopeds and moped operators/occupants. For simplicity, the
term “motorcycle” alone is used.) Of the 571 people involved in these accidents 58.8% (336)
received non-fatal injuries as a result of these crashes, and 14 people (2.5%) were killed. The above
fatality count of 14, represents 13.7% of all fatalities reported in 2019. Of the 14 fatalities, 78.6%
(11) were motorcyclists and 100% (11) of those were motorcycle operators. Thus, despite only
being involved in 1.8% of traffic crashes in 2019, motorcyclists accounted for 10.8% of all
fatalities. Figure 9 displays five-year averages for motorcycle fatalities (motorcycle occupants
only) for 2005-2019.
The average age of motorcyclists suffering fatal injuries was 43.6 years. Of the 11 motorcyclist
fatalities in 2019, 6 (54.5%) were age 40 or older and 9 (81.8%) were males. Just under a third of
the fatalities (27.3%) occurred during the three-week time span including the week prior to, the
week of, and the week after the 2019 Sturgis Motorcycle Rally (August 2-11, 2019). Of the 11
motorcycle operators that were killed, 8 (72.7%) were licensed in South Dakota and one (9.1%) of
the motorcycle operators suffering fatal injuries had a blood alcohol content reading of .08 or
above.
33Performance Measure: C-8) Number of unhelmeted motorcyclist fatalities (FARS)
Progress: In Progress
Program-Area-Level Report
2020 Performance Goal
Goal Statement: Decrease the unhelmeted motorcyclist fatalities five-year average to 14.7 or less
for 2016-2020.
Current Value (2014-2018): 13.8
Current Status: In progress
Key Observations from 2019 Data
• Of the 11 motorcyclist fatalities in 2019, 6 (54.5%) were sustained by unhelmeted
motorcyclists.
• 2 of the 6 unhelmeted motorcyclist fatalities (33.3%) recorded in 2019 were sustained by
out-of-state motorcyclists.
• Males accounted for 83.3% (5) of the unhelmeted motorcyclist fatalities recorded in 2019.
Recent Data
Table 10 presents comparative crash outcomes data for helmeted and unhelmeted motorcyclists
from 2015-2019. The percentage of helmeted fatalities decreased from 3.4% in 2017 to 2.6% in
342018, but the percentage of unhelmeted fatalities increased slightly from 2.8% to 3.3% over the
same period. It should be noted, though, that the low n-values in these categories may be too small
to justify the formation of practical inferences based on these figures alone.
Table 10. Injury Outcomes for Unhelmeted and Helmeted Motorcycle Occupants: 2015-2019*
Unhelmeted Motorcycle Occupants
Serious Other
Fatalities No Injury Total
Injuries Injuries
2015 22 103 226 63 414
2016 15 94 161 101 371
2017 10 72 155 127 364
2018 11 72 111 81 275
2019 6 67 105 79 257
2019 (%) 2.33% 26.07% 40.86% 30.74% 100.00%
All Years (%) 3.81% 24.27% 45.09% 26.83% 100.00%
Helmeted Motorcycle Occupants
Fatalities Serious Other No Injury Total
Injuries Injuries
2015 9 62 122 50 243
2016 6 33 92 25 156
2017 6 52 95 25 178
2018 4 36 84 27 151
2019 3 28 76 22 129
2019 (%) 2.33% 21.71% 58.91% 17.05% 100.00%
All Years (%) 3.27% 24.62% 54.73% 17.39% 100.00%
* There were 23 cases where the helmet status of the motorcyclist was unknown, including one
fatality; they are not included in this table
35The 6 unhelmeted fatalities in 2019 included four motorcyclists (66.7%) carrying a South Dakota
driver’s license. The 40 and older age group constituted 50% (3) of all unhelmeted motorcyclist
fatalities; 83.3% (5) of unhelmeted fatalities were sustained by males.
Performance Measure: C-9) Number of drivers age 20 or younger involved in fatal
crashes (FARS)
Progress: In Progress
Program-Area-Level Report
2020 Performance Goal
Goal Statement: Decrease the drivers age 20 or younger involved in fatal crashes five-year
average to 16.6 or less for 2016-2020.
Current Value (2014-2018): 16.8
Current Status: In progress
Key Observations from 2019 Data
• 17 drivers under the age of 21 were involved in a fatal traffic crash in 2019, the same number
as in 2018.
• 18 fatalities resulted from crashes where drivers under the age of 21 were involved, a
decrease since 2018. This includes 10 of the drivers under 21.
Recent Data
Table 11 provides yearly counts and annual change figures of drivers under 21 involved in traffic
crashes resulting in at least one fatality. As can be seen from the table, the number of drivers under
21 involved in fatal crashes is the same as it was in 2018.
Table 11. Drivers Under 21 Involved in Fatal Crashes: 2015-2019
Drivers Under 21 Annual % Change
2015 14 -39.1%
2016 20 42.9%
2017 10 -50.0%
2018 17 70.0%
2019 17 0%
36Of the 17 drivers under age 21 involved in fatal traffic crashes in 2019, 10 of them (58.8%) were
killed; 16 of them (94.1%) were from South Dakota; 10 (58.8%) were male; and none recorded a
positive blood alcohol content reading. (In the case of these drivers, a positive blood alcohol
content reading is defined as a recorded BAC level of .02 or above.) 5 of the 17 drivers (29.4%)
were operating a passenger car, 7 (41.2%) were operating light trucks, 2 (11.8%) were operating
motorcycles, 2 (11.8%) were operating a SUV, and one driver was operating a tractor/semi-trailer.
Figure 10 provides a slightly different perspective on fatalities involving drivers under the age of
21 through the lens of five-year averages. As is illustrated in this figure, the five-year averages
declined slowly, but steadily over this period.
Table 12 presents fatality rates, expressed as fractions of total in-state population counts, for years
2015-2019. This table indicates that 18 fatalities resulted in 2019 from traffic crashes involving a
driver under 21 years old, down from 22 in 2018. Additionally, the 2019 fatality rate of 2.03
fatalities per 100,000 in population is lower than last year. (It is worth nothing though that this
does not take into account changes in the proportion of the population that are under 21.)
Table 12. Fatalities per 100,000 In-State Population from
Crashes Involving a Driver Under 21: 2015-2019
Fatalities from Crashes Per 100,000
Population Estimate
Involving a Driver Under 21 Population
2015 858,469 14 1.63
372016 865,454 25 2.88
2017 869,666 14 1.61
2018 882,235 22 2.49
2019 884,659 18 2.03
Performance Measure: C-10) Number of pedestrian fatalities (FARS)
Progress: In Progress
Program-Area-Level Report
2020 Performance Goal
Goal Statement: Maintain a pedestrian fatalities five-year average of 7 fatalities or less for 2016-
2020, despite expected increases in population.
Current Value (2014-2018): 8.2
Current Status: In progress
Key Observations from 2019 Data
• Since 2005, the number of annual pedestrian fatalities in South Dakota has fluctuated around an
average of 6-8 fatalities per year; 9 were reported in 2019.
Recent Data
Pedestrian fatalities are highly uncommon in South Dakota. Only 41 pedestrian fatalities were
recorded in the state from 2015 through 2019; this includes 9 such fatalities in 2019, a slight
decrease from 2018. Since 2005, the number of annual pedestrian fatalities has fluctuated around
an average of 6-8 fatalities per year with the current five-year average for 2015-2019 at 8.2
pedestrian fatalities. Figure 11 presents trend data for pedestrian fatalities from 2005–2019, as
expressed by five-year averages.
38In 2019, 281 pedestrians were involved in traffic crashes. These crashes resulted in 9 pedestrian
fatalities, 25 serious injuries, and 113 other injuries. One traffic crash produced two pedestrian
fatalities. None of the pedestrian fatalities had reported blood alcohol contents of higher than .08
at the time of the crash.
Finally, Table 13 displays pedestrian fatality counts indexed to statewide population figures.
Although no linear pattern is apparent for this measure, in the five most recent years, roughly 0-1
pedestrians per 100,000 in-state population have been killed in motor vehicle crashes each year.
The 2019 figure of 1.02 shows a decrease from the 2018 figure of 1.13.
Table 13. Pedestrian Fatalities per 100,000 In-State Population: 2015-2019
Per 100,000
Population Estimate Pedestrian Fatalities
Population
2015 858,469 5 0.58
2016 868,799 4 0.46
2017 869,666 10 1.15
2018 882,235 10 1.13
2019 884,659 9 1.02
39Performance Measure: C-11) Number of bicyclists fatalities (FARS)
Progress: In Progress
Program-Area-Level Report
2020 Performance Goal
Goal Statement: Maintain a bicyclist fatalities five-year average of 1 fatality or less for 2016-
2020, despite expected increases in population.
Current Value (2014-2018): 0.6
Current Status: In progress
Key Observations from 2019 Data
• The number of annual bicyclist fatalities in South Dakota is consistently very low. There
was one reported in 2019.
Recent Data
Bicycle fatalities are highly uncommon in South Dakota. Only 8 bicyclist fatalities were recorded
in the state since 2005. There was one bicyclist fatality in 2019. Since 2005, the five-year average
of bicyclist fatalities has remained at 1 fatality or less per year.
Figure 12 presents trend data for bicyclist fatalities from 2005–2019, as expressed by five-year
averages. Given the very low number of fatalities per year though, the changes in the averages are
a bit misleading. Since most years have zero fatalities, any one year with a fatality can inflate the
averages for the entire time it is included in the average.
40Of the 78 total bicyclists involved in crashes in 2019, 43 (55.1%) were male, 54 (69.2%) were over
the age of 20, and a significant majority, 74 (94.9%) were not wearing a helmet.
Finally, Table 14 displays bicyclist fatality counts indexed to statewide population figures.
Although no linear pattern is apparent for this measure, over the five most recent years no more
than one bicyclist has ever been killed in a year, and, in general, there are very few bicyclist
fatalities.
Table 14. Bicycle Fatalities per 100,000 In-State Population: 2015-2019
Per 100,000
Population Estimate Bicycle Fatalities
Population
2015 858,469 1 0.12
2016 865,454 0 0.00
2017 869,666 0 0.00
2018 882,235 0 0.00
2019 884,659 1 0.11
Performance Measure: B-1) Observed seat belt use for passenger vehicles, front seat
outboard occupants (survey)
Progress: In Progress
Program-Area-Level Report
2020 Performance Goal
Goal Statement: Increase statewide observed seat belt use of front seat outboard occupants in
passenger vehicles to 80.0% by December 31, 2020.
Current Value: 75.2%
Current Status: In Progress
Recent Data
In June of 2019, the South Dakota Office of Highway Safety contracted with the Upper Great
Plains Transportation Institute to conduct a statewide observational survey following
methodological guidelines spelled out in NHTSA’s Uniform Criteria for State Observational
Surveys of Seat Belt Use. The underlying purpose of the annual survey is to observe safety restraint
use of all drivers, right front passengers, and children under the age of five traveling on rural and
urban highways and interstates. The 2019 report, Seatbelt Use in South Dakota, June 2019 serves
as the primary source document for all information presented in this section.
41From the sixteen counties selected from the sampling pool, a total of 30,363 automobile occupants
were observed during the week of June 10-16, 2019. After weighing averages to account for VMT,
the 2019 statewide estimated safety restraint use on all road types was 75.2%. This represents a
decrease of 3.7 percentage points from the 2018 statewide weighted estimate of 78.9%. It is worth
noting, however, that the use percentage is higher than the reported figure for 2017 and the 78.9%
in 2018 was higher than most recent data. Table 15 exhibits the observed restraint use figures for
2015-2019.
Table 15. Observed Restraint Use by Year 2015-2019
2015 73.60%
2016 74.20%
2017 74.80%
2018 78.90%
2019 75.20%
% Change 2018-2019 -3.70%
Performance Measure: Number of distracted driving fatalities (FARS)
Progress: In Progress
Program-Area-Level Report
2020 Performance Goal:
Goal Statement: Maintain the five-year average for distracted driving fatalities to 7.5 or less for
2016-2020.
Current Value (2018): 5
Current Status: In progress
This is our second year to assess and report on distracted driving. According to available FARS
data for 2018, we had 5 fatal crashes in 2019 that were recorded as the result of a distracted driver.
This is a slight decrease from the 7 crashes we had in 2017. Those 5 crashes resulted in 6 fatalities.
Table 16 displays the results for these first two years of data. Caution is advised in interpreting the
percentage changes as the overall numbers are very small. As we have more data on this measure,
we will begin to track and report on five-year averages as well as more nuanced patterns for this
measure.
42You can also read