SAVED BY ZERO? ENERGY INDUSTRY UPDATE - ScottMadden

Page created by Ruben Le
 
CONTINUE READING
SAVED BY ZERO? ENERGY INDUSTRY UPDATE - ScottMadden
ENERGY INDUSTRY UPDATE

SAVED BY
ZERO?

Volume 21 - Issue 1
SAVED BY ZERO? ENERGY INDUSTRY UPDATE - ScottMadden
Executive Summary: Saved by Zero? ............................................................................................................... 3
CONTENTS

           1. Massachusetts' Decarbonization Roadmap ............................................................................................ 4

           2. Energy and Utility Sector Themes .............................................................................................................. 22

           3. Fleet Electrification ........................................................................................................................................... 33

           4. Weather and System Performance: Test Cases .................................................................................... 42

           5. The Critical Role of Transmission in the Net-Zero Transition ......................................................... 50

           6. The Energy Industry in Charts ...................................................................................................................... 62

           Glossary ......................................................................................................................................................................... 63

           Recent Insights ........................................................................................................................................................... 65

           Energy Practice: ScottMadden Knows Energy .............................................................................................. 66
SAVED BY ZERO? ENERGY INDUSTRY UPDATE - ScottMadden
EXECUTIVE SUMMARY
  Saved by Zero?
As The Fixx’s 1980s hit says, “maybe someday, saved by zero.” A growing number of commitments to net-zero targets have been made over the
past several years, and federal policy is increasingly supportive. Before being “saved by zero,” energy industry stakeholders are now shifting their
focus from “whether” to “how” these commitments can be fulfilled. Energy and utility companies are now considering the actions, trade-offs, and
complexities that are emerging in moving toward these goals. Those considerations include required effort and cost to achieve net-zero, potential
strategies, and potential effects of transition.

                                   Some Highlights of This ScottMadden Energy Industry Update

 Required          ƒ Massachusetts achieved its 2020 emissions-reduction targets. Now the state has created a cross-sector roadmap, outlining
 Effort              several potential pathways to reach its long-term emissions-reduction goals. Electric and gas utilities should look closely
 to Zero             at this and other decarbonization roadmaps to understand various alternatives and scrutinize embedded assumptions.

                   ƒ As the power sector has significantly reduced its carbon emissions footprint, the transportation sector remains a
                     meaningful contributor to carbon emissions. Fleet electrification could play an important role in a net-zero strategy.
 Strategies          Electric utilities can be a key partner in this transition and should begin planning now.
 to Zero
                   ƒ Transmission development is being recognized as a critical piece of the net-zero transition, linking large-scale renewable
                     resources with demand centers. Many advocates for aggressive clean energy goals are highlighting the complementary
                     roles played by large-scale clean energy development and power transmission expansion.

                   ƒ Recent weather events in California and Texas have exposed planning, process, and resource gaps in power systems. As
 Potential           the net-zero resource mix continues to change with increasing variable and gas-fired resources, resource planners may
 Effects             need to consider greater tail risk in their planning scenarios.
 of Transition
 to Zero           ƒ Over the past several months, energy and utility companies have been discussing their 2020 performance and
                     expectations for 2021 and beyond. Emerging themes include a refocus on core utility operations and pursuit of investment
                     opportunities in clean energy.

                                                                                                            Executive Summary: Saved by Zero?   3
SAVED BY ZERO? ENERGY INDUSTRY UPDATE - ScottMadden
Massachusetts’ Decarbonization Roadmap
Massachusetts outlines a comprehensive cross-sector carbon-reduction legislation,
as it uses an analytical roadmap to evaluate options.
SAVED BY ZERO? ENERGY INDUSTRY UPDATE - ScottMadden
Decarbonization and Net-Zero Emissions: The Backdrop
 ƒ Certain
   It has been
           U.S.nearly
                states,25
                        municipalities,
                          years since FERC
                                        and utilities—along
                                             issued Order 888,
                                                            withestablishing
                                                                 emerging federal
                                                                             open                                           KEY TAKEAWAYS
    policy—press
    access     to the on
                       bulk with
                              transmission
                                 aspirationsnetwork
                                              for decarbonization
                                                       and just moreofthan
                                                                        the 20
                                                                             energy
                                                                                yearssector
                                                                                        since across
                                                                                              FERC
    promulgated
    all  fuel types. Order 2000, calling for the establishment of regional transmission                                     Recently, several studies
    organizations (RTO).                                                                                                    have scoped out approaches
 ƒ To date, the focus has been on power sector decarbonization. But as a significant                                        to achieve net-zero
 ƒ number
    Over that    oftime,
                    greenhouse
                          large parts
                                   gas of
                                       (GHG)
                                          the United
                                                emissions
                                                       States—as
                                                           reductions
                                                                   well have
                                                                        as Canada—have
                                                                              been achieved in that
                                                                                                                            GHG emissions by 2050.
    established
    sector    in certain
                     bid-based
                           regions,
                                  markets
                                     attention
                                            for energy
                                                is now turning
                                                         and related
                                                                 to other
                                                                      services.
                                                                           sectors
                                                                                These
                                                                                   for (largely)
                                                                                         markets have
                                                                                                                            Massachusetts has taken the
    encouraged technological
    energy-related       GHG emissionsinnovation
                                           reductions.
                                                    and asset turnover in the power generation
    sector and, along with declining fuel prices, helped lower power prices over the                                        next step in its emissions-
 ƒ In
    pastlate
           202020,
                 years.Massachusetts
                        The non-RTO proposed
                                        West has various     pathways
                                                     tested this        thatthrough
                                                                 construct    would transition    the
                                                                                      its competing                         reductions journey, releasing
    Commonwealth
    imbalance markets.     to  economy-wide     net-zero  emissions  by  2050.  This  action  follows                       a multi-sector 2050 roadmap
    on the heels of New York’s well-publicized Climate Leadership and Community                                             for a net-zero emissions state
 ƒ Protection
    Setting aside   Actissues
                         enactedandin
                                    effects
                                      June 2019.
                                             of the pandemic, as we entered 2020 some                                       economy.
    markets were feeling the strains of policy differences and commodity preferences
    among states, federal and state governments, and stakeholders in those markets.
                                                                                                                            The Commonwealth is looking
  Figure    1.1: Statesare:
    Key questions        CleanCanEnergy
                                   marketsand  GHG Emissions
                                             endure              Reduction
                                                      amidst these  frictions,Goals
                                                                               should they evolve,
                                                                                                                            to utilities to articulate the
    and, if so, in what way?
                                                        MT ND
                                                                                                                            ways they are going to meet
                                                                                                                            near-term goals and align
                                     WA                                                                           ME
              AK
                                                          SD                                                                plans with its decarbonization
                                                  WY                                                       VT
                                                                          MN
                                                                                                            NH
                                                                                                                            roadmap.
                                                                     IA        WI
                                     OR ID                NE                           MI          NY      MA
                                                                                IL                                 RI
                             CA     NV       UT                                      IN OH           PA
                                                                                                                 CT
                                                   CO
                                                                                                           NJ               The Commonwealth has
                                                                KS
                                                                                              WV          DE
                                                                                                          MD
                                                                                                                            also issued for comment a
                                                                          MO       KY              VA
               HI                            AZ    NM
                                                            TX
                                                                     OK
                                                                          AR     TN       NC              D.C.              policy outline for its 2030
                                                                               MS AL GA SC                                  interim target (45% below
                                                                          LA                                                1990 levels), consistent with
    Official law
      or order
                    Aspirational or
                    awaiting finalization
                                                                                         FL        MASSACHUSETTS            its longer-term goals and
                                                                                                   Gov. Baker signed into
 Aggressive                                                                                        law March 26
                                                                                                                            approaches.
  Moderate                                                                                         comprehensive climate
     Minor                                                                                         change legislation
                                                                                                   calling for net-zero     While these activities are
    No goal                                                                                        emissions by 2050
                                                                                                                            intended to spur action,
                                                                                                                            stakeholders will need to
 Note: Data as of April, 2021
                                                                                                                            devote more attention to
 Source: S&P Global Platts
                                                                                                                            identifying specific actions and
                                                                                                                            impacts, both intended and
                                                                                                                            unintended.

                                                                                                                            Massachusetts’ Decarbonization Roadmap   5
SAVED BY ZERO? ENERGY INDUSTRY UPDATE - ScottMadden
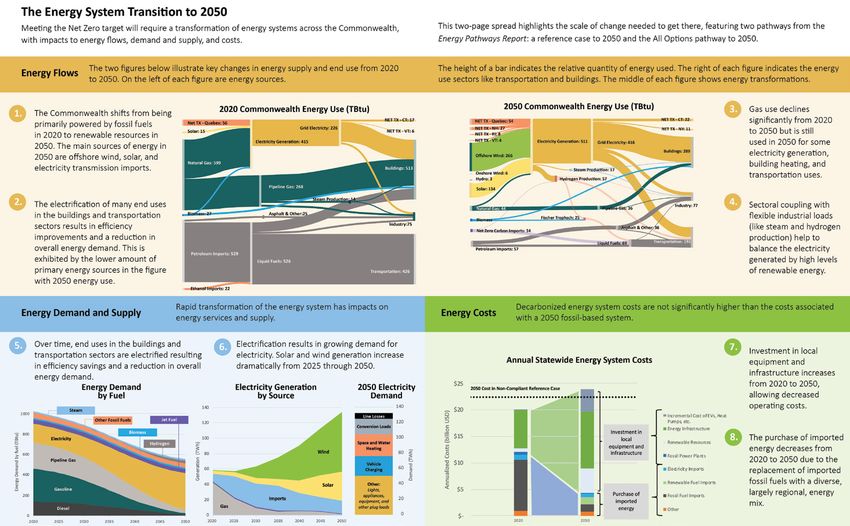
Considering Long-Term Goals:
                                                                                       An Introductory Roadmap Lexicon
The 2050 Decarbonization Roadmap
ƒ Having achieved meaningful GHG reductions through the Global                      ƒ The structure of the Roadmap comprises four
  Warming Solutions Act's first milestone of 2020, the Commonwealth has               key elements: pillars, pathways, sectors, and
  now shifted focus to 2050. The 2050 Decarbonization Roadmap (the                    strategies.
  Roadmap), released in December 2020 by the Executive Office of Energy
  and Environmental Affairs (EEA), is an input in planning Massachusetts’              - Pillars: Four key complementary “pillars
                                                                                         of decarbonization” identified in previous
  go-forward strategy.
                                                                                         deep decarbonization studies—specifically
ƒ The Roadmap envisions a net-zero emissions target and an 85% reduction                 end-use energy (transitioned away
  of state GHG emissions from 1990 levels by 2050. Subject to finalization,              from fossil fuels), energy efficiency and
                                                                                         flexibility, energy supply decarbonization,
  the EEA asserts that the proposed Roadmap “identifies cost-effective and
                                                                                         and carbon sequestration.
  equitable pathways and strategies” to achieve the 2050 target. Analysis in
  the Roadmap includes:                                                                - Pathways: Different emissions-reduction
                                                                                         scenarios/specific technological transitions
   - Integrated, cross-sector energy system analysis exploring eight distinct            to achieve net-zero by 2050; also used to
        net-zero emissions reductions “pathways” to 2050.                                evaluate different technological evolutions,
   - Sector-specific analyses focused on buildings, transportation,                      advancements, and constraints.
        non-energy emissions, and the carbon sequestration potential of                - Sectors: Key parts of the economy for
        Massachusetts’ natural and working lands, as well as a separate                  which emissions reductions are targeted,
        economic and health impact analysis.                                             but with a holistic view, recognizing
                                                                                         current and future physical and
ƒ In tandem with the Roadmap, the Commonwealth has pursued aligned and
                                                                                         technological interdependencies in such
  inter-related policy and regulatory activities for the near term.
                                                                                         areas as transportation, buildings, energy
   - The MA EEA also released in December the interim Clean Energy and                   supply, non-energy, and land use.
        Climate Plan for 2030 (2030 CECP), a policy action plan to achieve
                                                                                       - Strategies: Specific areas where actions
        the 2030 emissions limit while maximizing Massachusetts’ ability to
                                                                                         can be taken to achieve 2050 (and 2030)
        achieve net-zero by 2050.
                                                                                         goals within sectors, including light-duty
   - Separately, Massachusetts’ utility regulator, the Department of Public              transportation, residential and commercial
        Utilities (DPU), initiated an inquiry (D.P.U. 20-80) in late October 2020        buildings, electric and gas system changes,
        to examine the role of local gas distribution companies (LDCs) in                and natural carbon sequestration.
        achieving the 2050 climate goals.
                                                                                    ƒ The Roadmap outlines eight distinct emissions
   - Specifically, the DPU will explore strategies to enable transitioning            reductions pathways (see Fig. 1.6). Key
        to Massachusetts net-zero while safeguarding ratepayer interests;             distinctions between the pathways are the
        ensuring safe, reliable, and cost-effective natural gas service; and          constraints on (or availability of) resource
        potentially recasting the role of LDCs.                                       strategies, including efficiency, offshore wind,
                                                                                      distributed energy resources, low-carbon
   - By early March 2022, an independent consultant’s report will be
                                                                                      piped gas, and thermal power generation.
        submitted along with LDC-specific strategies to support GHG
        reductions, with each of these LDC-specific filings subject to a hearing
        and next steps.

    6      Massachusetts’ Decarbonization Roadmap
SAVED BY ZERO? ENERGY INDUSTRY UPDATE - ScottMadden
Figure 1.2: Selected Massachusetts Decarbonization Policy Activity (2008–2020)

   The Global Warming Solutions Act (GWSA)
   and Green Communities Act are signed into law.
   Masschusetts becomes one of the first states in the
   nation to formally commit to a regulatory program
   requiring GHG emissions reductions (at least 25%      2008
   below 1990 levels in 2020, and at least 80% below
   1990 levels in 2050) and to comprehensively reform
   its energy policy and procurement framework to               Publication of the Clean Energy and Climate Plan
   align with that goal.                                        for 2020. The Commonwealth's first comprehensive
                                                                climate action plan outlined an integrated portfolio
                                                         2010
                                                                of policies designed to ensure the achievement of
                                                                the interim 2020 emissions limit.

  Governor Baker signs Executive Order 569
  establishing an integrated climate strategy for the
  Commonwealth and An Act to Promote Energy              2016
  Diversity authorizing large procurements of offshore
  wind and hydroelectric resources.

                                                                Governor Baker signs into law An Act to Advance
                                                         2018   Clean Energy, setting new targets for offshore wind,
                                                                solar, and storage technologies.

  Publication of the Decarbonization Roadmap to
  2050 and the Clean Energy and Climate Plan for
  2030, outlining the long-term strategies and near-     2020
  term actions for the Commonwealth to achieve net-
  zero emissions.
                                                                In March, Governor Baker signed comprehensive
                                                                climate change legislation that codifies the
                                                                Commonwealth's commitment to achieve net-zero
                                                         2021   emissions in 2050, updating the GWSA. It also
                                                                authorizes the establishment of an emissions limit of
                                                                no less than 50% for 2030 and no less than 75% for
                                                                2040.

Source: Massachusetts EEA                                                      Massachusetts’ Decarbonization Roadmap   7
SAVED BY ZERO? ENERGY INDUSTRY UPDATE - ScottMadden
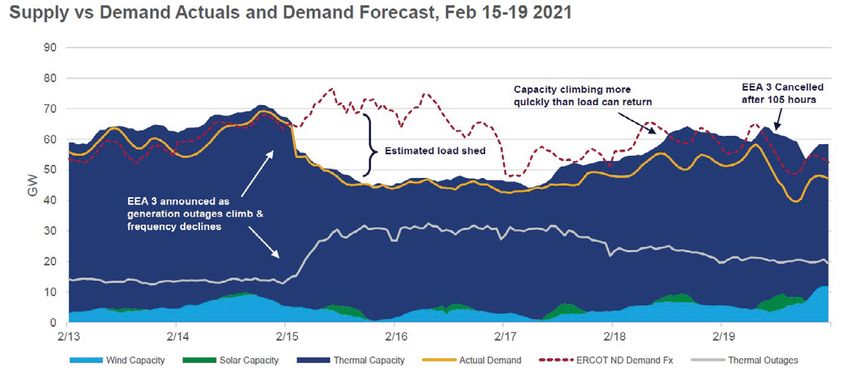
High-Level Findings and Observations of the Massachusetts EEA Roadmap
 ƒ The Roadmap looks across sectors with a view toward highest emissions-reduction gains. It dimensions emissions by sector: electricity (19% of
   GHG emissions), buildings (27%), transportation (42%; light-duty vehicles alone contribute 27%), industrial (5%), and other/non-energy (8%).
   Some common characteristics of net-zero strategies include the following, consistent with the aforementioned pillars:

    - Widespread electrification of vehicles and space heating/building services
    - A balanced portfolio of clean generation technologies—particularly offshore wind—across a New England regional footprint, as well as land-
         based and rooftop solar, significant amounts of imported, low-carbon electricity, energy storage, and new high-voltage transmission

    - Overall reduction in energy supply and demand (i.e., increased energy efficiency)
    - Negative emissions natural “sinks” in the form of the Commonwealth’s forested land, as well as technologies such as direct air capture
   The report identifies some areas (aviation, marine, and rail, for example) that will be harder to decarbonize, certainly by 2050.

 ƒ Key findings of Roadmap investment and benefits include the following:
    - Substantial investment will be required over the coming decades, but the Roadmap assumes that approximately $4.5 billion in health and
         other benefits will more than offset this cost.

    - The analysis assumes shifting toward local non-emitting energy production will come with local economic benefits.
    - It does note that total required investment can be minimized by transitioning as existing capital stock reaches end-of-service life. However,
         as turnover points come infrequently (measured in decades) (see Fig. 1.3), the report notes that the pace of transformation “may feel
         uncomfortably fast.”

                                         Figure 1.3: Assumed Lifetime of Common Energy-Related Infrastructure

                                                     Bulb
                                                      Appliance
                                                       AC & Furnance
                                                            Vehicle
                                                                 Commercial Boiler
                                                                       Power Plant
                                                                           Pipeline
                                               2020                 2030              2040          2050
                                               Source: Roadmap

     8      Massachusetts’ Decarbonization Roadmap
SAVED BY ZERO? ENERGY INDUSTRY UPDATE - ScottMadden
The "All Options" Pathway as a Net-Zero Baseline
 ƒ When developing pathways, the Roadmap looks at a reference case (without net-zero targets); an All Options case, which assumes flexibility
   to employ the most economic decarbonization levers; and alternative cases, which selectively limit or expand those levers to show how
   technology evolutions or constraints could make the transition easier or more difficult.‡ A description of the cases and key characteristics is
   shown at Fig. 1.6.

 ƒ The All Options pathway is presented as a point of comparison rather than an endorsed pathway and may not be the most economical route.
   But the All Options pathway is presented by the EEA as a framework for discussion of sector strategies and additional policy engagement as
   stakeholders, regulators, and policymakers investigate possible actions.

       Figure 1.4: Key Assumptions in the Roadmaps "All Options" Pathway

         Massachusetts behind-the meter solar in 2050        7 GWs

                                                             Medium (load-shedding demand response, but less vehicle-to-grid, flexible
         Flexible end-use loads
                                                             space and water heading demand than DER Breakthrough pathway)

         Building & industry electrification                 High

         Energy efficiency                                   High

         Captured CO2 export                                 No

         Intraregional transmission cost                     $5,600/MW-mile within New England; $9,400/MW-mile to Quebec

         New gas power plants                                None assumed in Massachusetts

                                                             Economic; assumes NREL Annual Technology Baseline "Low" offshore wind
         New offshore wind power plants
                                                             technology cost

         New nuclear power plants                            None assumed

         Existing nuclear                                    Maintain

         Use of fossil fuels                                 Constrained by emissions

                                                                                                       Massachusetts’ Decarbonization Roadmap   9
SAVED BY ZERO? ENERGY INDUSTRY UPDATE - ScottMadden
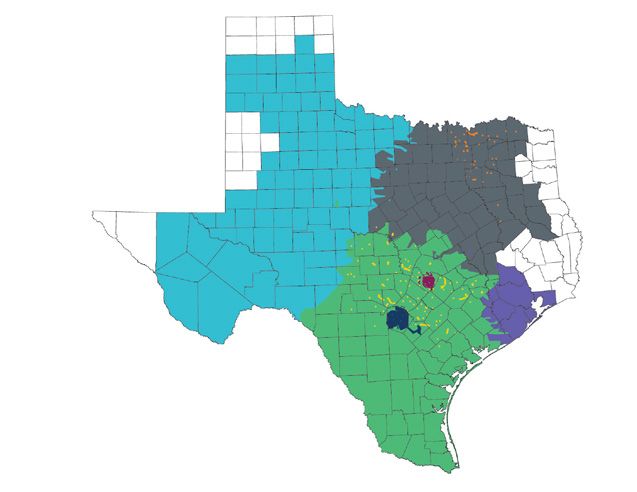
Figure 1.5: Massachusetts Roadmap "All Options" Pathway Energy Projections for 2050

                     The Roadmap's All Options pathway assumes significant reduction in overall energy consumption by 2050,
   Energy Flows*     with a dramatic shift away from fossil fuel sources.

   Energy Demand     Rapid transformation of the energy system has impacts on                                Decarbonized energy system costs are not significantly higher
                                                                                        Energy Costs
   and Supply        energy services and supply.                                                             than the costs associated with a 2050 fossil-based system.

                                                                                       Notes: *The two figures above showing Roadmap energy flows illustrate key changes
 The Roadmap's All Options pathway (an "all of the above" strategy)                           in energy supply and end use from 2020 to 2050. On the left of each figure are
                                                                                              energy sources. The height of a bar indicates the relative quantity of energy
 projects signficant changes in the amount and type of energy supply                          used. The right of each figure indicates the energy use sectors like transportation
 and demand, as well as a modest increase in energy costs.                                    and buildings. The middle of each figure shows energy transformations.
                                                                                      Source: Roadmap

     10   Massachusetts’ Decarbonization Roadmap
Figure 1.6A: Summary of Roadmap Pathways

                                                       Difference from All                                                         Key Finding of
                 Pathway       Key Characteristic                              Research Question       Defining Assumptions
                                                        Options Pathway                                                           Roadmap Analysis

              All Options     Baseline analysis—                               Under the most          “Benchmark                Deep electrification
                              model selecting                                  likely assumptions,     compliant”                and broad
                              greatest number of                               what is the least-      decarbonization           renewable buildout
                              economic resources                               cost deployment         pathway,                  create a reliable
                              to meet emissions                                of energy system        using midpoint            energy system only
                              limits using baseline                            technologies that       assumptions across        marginally more
                              cost assumptions                                 achieves deep           most technical            expensive than
                                                                               decarbonization?        parameters                today’s.

              DER             High deployment of       +10 GWs behind-         What are the             ƒ 17 GWs of              Additional demand
              Breakthrough    behind-the-meter         the-meter solar         impacts of greater         behind-the-meter       flexibility lowers
                              solar and flexible                               deployment of              solar deployed in      local electricity
                              loads                                            behind-the-meter           MA in 2050, as         system upgrade
                                                                               solar and flexible         opposed to             costs; very high
                                                                               end uses?                  7 GWs                  rates of rooftop
                                                                                                        ƒ Higher level           solar reduce—but do
                                                                                                          of flexible end        not eliminate—the
 Least Cost

                                                                                                          uses, especially       need for ground-
                                                                                                          vehicle-to-grid        mounted solar.

              Regional        Lower-cost electric      Intraregional           What can greater         ƒ Lower                  Additional
              Coordination/   transmission +           transmission:           access to regional         transmission           transmission
              Expansion       export of captured                               resources                  costs                  increases access
                              CO2                      ƒ $2,300/MW-            contribute as part of                             to, and the ability
                                                         mile within New                                ƒ Captured carbon
                                                                               decarbonization?           exports allowed        to share, additional
                                                         England                                                                 low-cost clean
                                                                                                          for geological
                                                       ƒ $4,700 (50%                                      sequestration          energy resources
                                                         more) per MW-                                    outside New            across the
                                                         mile to Quebec                                   England                Northeast, lowering
                                                                                                                                 overall costs.

              OSW             Region constrained       30 GWs Northeast        What are the            Northeast offshore        Clean resources,
              Constrained     to 30 GWs of             cap, with mid (vs.      consequences of         wind capacity is          including new
                              offshore wind            low) technology         limited development     capped regionally at      nuclear power, must
                              (near-shore siting       costs; new nuclear is   in offshore wind?       30 GWs.                   be built to serve
                              difficult; high price;   economical                                                                MA. Costs increased
                              approvals delayed;                                                                                 modestly.
                              etc.)

Source: Roadmap

                                                                                                         Massachusetts’ Decarbonization Roadmap   11
Figure 1.6B: Summary of Roadmap Pathways (Cont.)

                                                                Difference from All                             Defining                Key Finding of
                        Pathway         Key Characteristic                            Research Question
                                                                 Options Pathway                              Assumptions              Roadmap Analysis

                     Pipeline Gas        Low                    Low                   What are the          Building             Requires a substantial increase
                                         electrification of     electrification       impacts of            electrification is   in imported low-carbon fuels,
                                         pipeline gas uses      of pipeline gas       continued             mostly limited       possibly above technically
                                         in buildings and       applications          reliance on           to conversion        feasible quantities. Most of this
                                         industry                                     natural gas           from oil in the      fuel goes to high-value sectors
                                                                                      in buildings?         near term, with      to compensate for continued
                                                                                      What role can a       slower rates of      emissions from buildings using
                                                                                      decarbonized gas      gas-to-heat pump     a fossil/clean fuel blend.
                                                                                      product play in a     conversion in the
                                                                                      net-zero MA?          long term.

                     Limited             Envelope               No efficiency         What are the          Efficiency gains     Limiting efficiency gains
                     Energy              efficiency gains       gains across          energy, resource,     are reduced to       results in a higher demand for
                     Efficiency          remain at current      buildings,            and transmission      about one-third      zero-carbon electricity and
                                         levels                 industry, and         and distribution      of those achieved    fuel resources. Costs increase
                                                                transportation        needs that arise      in the All Options   significantly.
                                                                                      from deferring        pathway in
                                                                                      investments in        buildings and
                                                                                      efficiency?           aviation.

                     100%                Fossil fuels           All nuclear           What does a           No fossil            Reliance on zero-carbon fuels
                     Renewable           fully replaced         retired; no fossil    100% renewable        fuels allowed;       needed for grid balancing and
                                         throughout             fuels in 2050         energy strategy       zero-carbon          end uses leads to dramatically
                                         economy with                                 across electricity    combustion           higher costs in 2050; demand
                                         carbon neutral                               and all fuels         fuels allowed        may exceed feasible supply.
                                         fuel; nuclear                                require in terms      for electricity      It would likely require
                                         retired                                      of resources,         generation by        technological breakthroughs,
 Highest Cost

                                                                                      storage, and          thermal power        yet to be identified, to meet
                                                                                      costs?                plants.              resource constraints and
                                                                                                                                 contain costs.

                     No Thermal          Forced retirement      New gas plants        What resources        All thermal          Substantially higher reliance
                                         of all gas and         disallowed            will be needed        capacity retired     on solar power, particularly
                                         oil electricity        everywhere            if thermal            by 2050.             ground-mounted, and new,
                                         generation                                   generation is                              long-duration utility-scale
                                                                                      not available to                           energy storage to provide
                                                                                      provide reliability                        grid balancing, leading to
                                                                                      services?                                  dramatically higher costs.

Source: Roadmap

                12     Massachusetts’ Decarbonization Roadmap
Early Analysis of Massachusetts                 Figure 1.7: Gross Energy System Cost: No Decarbonization vs. All Options (Annual $ Billions)
Roadmap Costs                                                          $30                                                                                                                  Other
                                                                                                            $27.2                                   $27.6                                   Oil Products
 ƒ As momentum toward decarbonization                                                                                                                                     $25.6
                                                                                                                                        $25.1                                               Natural Gas
   activities gathers in Massachusetts                                 $25                       $23.9                   $23.6                                 $24.0               $23.7    Zero Carbon Gas Imports
   and elsewhere, utilities, regulators, and                                  $22.4                                                                                                         Zero Carbon Liquid Imports

                                               Annual Cost in 2018$B
   other stakeholders are increasingly                                                                                                                                                      Hydro Purchases
                                                                       $20
   considering the cost of developing                                                                                                                                                       Offshore Wind
   or converting significant amounts of                                                                                                                                                     Rooftop Solar
   infrastructure to alternative energy                                $15                                                                                                                  Ground-Mounted Solar
                                                                                                                                                                                            Biomass Power Plants
   sources.
                                                                                                                                                                                            In-State Fuels Production
                                                                       $10                                                                                                                  Gas Power Plants
 ƒ The Roadmap does not discuss costs
                                                                                                                                                                                            Gas Pipelines
   except at a societal level and compared
                                                                                                                                                                                            Electricity Transmission
   with projected health benefits. But the                              $5
                                                                                                                                                                                            Electricity Distribution
   Roadmap technical report does identify                                                                                                                                                   Electricity Storage
   costs in three ways:                                                                                                                                                                     Demand-Side Costs
                                                                       $0
    - Gross cost: Annual spending on

                                                                               ce

                                                                                                 ns

                                                                                                            les

                                                                                                                         gh

                                                                                                                                        cy

                                                                                                                                                    al

                                                                                                                                                               ed

                                                                                                                                                                          as

                                                                                                                                                                                      n
                                                                                                                                                                                   tio
                                                                                                                                                   rm

                                                                                                                                                                       eG
                                                                              en

                                                                                                                                    ien
                                                                                                tio

                                                                                                                                                            ain
                                                                                                                        rou
                                                                                                           ab

                                                                                                                                                                                  ina
                                                                                                                                               The
                                                                          fer

                                                                                            Op

                                                                                                       ew

                                                                                                                                 ffic

                                                                                                                                                                     elin
                                                                                                                                                          str
                                                                                                                   kth

                                                                                                                                                                                ord
      energy, particularly comparing the

                                                                         Re

                                                                                                                                                         Con
                                                                                           All

                                                                                                      en

                                                                                                                                dE

                                                                                                                                              No

                                                                                                                                                                    Pip
                                                                                                                  rea

                                                                                                                                                                            l Co
                                                                                                      %R

                                                                                                                              ite

                                                                                                                                                     nd
                                                                                                                 RB
      reference case (no decarbonization)

                                                                                                                         Lim

                                                                                                                                                                            na
                                                                                                 100

                                                                                                                                                    Wi
                                                                                                             DE

                                                                                                                                                                          gio
                                                                                                                                                   re

                                                                                                                                                                       Re
                                                                                                                                               sho
      on fuels and capital versus a shift to

                                                                                                                                              Off
                                                Source: Roadmap
      new capital equipment (see Fig. 1.7)

    - Net cost: Compares annual costs
      for other pathways versus the             Figure 1.8: Roadmap Estimated Average Societal Electricity Rate Among Pathways ($/MWh)
      All Options baseline scenario
      (not versus a no decarbonization                                             $164                                                                  $164
                                                                         $151
      alternative). The Roadmap's                                                         $142
                                                                                                                 $131    $133                  $132               $133 $135 $133
      modeled diversion in costs between                                                                                            $129
                                                                                                                                                                                           Roadmap
      pathways tend to occur in the latter
                                                                                                                                                                                           estimated
                                               $/MWh

      part (2040+) of the forecast period.
                                                                                                                                                                                           costs are highly
    - Electric and gas rates: Estimates a                                                                                                                                                  assumptions
      societal electricity rate, assuming                                                                                                                                                  dependent.
      greater electric volumetric demand
      and decreased gas volumes over
      time after an early period of

                                                                                                                                                                                n
                                                                                                                 ns

                                                                                                                            s

                                                                                                                                    gh

                                                                                                                                                                              as
                                                                                                                                               cy
                                                                         0

                                                                                   0

                                                                                           0

                                                                                                                                                                              al

                                                                                                                                                                             ed
                                                                                                                         ble

                                                                                                                                                                            tio
                                                                        202

                                                                                203

                                                                                          204

      significant capital investment

                                                                                                                                                                          eG
                                                                                                             tio

                                                                                                                                                                          rm
                                                                                                                                              ien
                                                                                                                                    ou

                                                                                                                                                                         ain

                                                                                                                                                                        ina
                                                                                                                         a
                                                                                                            Op

                                                                                                                                                                     The
                                                                                                                                    r
                                                                                                                      ew

                                                                                                                                                                     elin
                                                                                                                                          ffic
                                                                                                                                kth

                                                                                                                                                                     str

                                                                                                                                                                    ord
                                                                                                           All

                                                                                                                   en

                                                                                                                                         dE

                                                                                                                                                                 Con
      (see Fig. 1.8). The rates it uses do

                                                                                                                                                                 Pip
                                                                                                                              rea

                                                                                                                                                    No

                                                                                                                                                               l Co
                                                                                                                 %R

                                                                                                                                        ite
                                                                                                                          RB

                                                                                                                                                             nd

                                                                                                                                                            na
                                                                                                                                    Lim
                                                                                                             100

      not account for market-clearing                                                                                                                    Wi
                                                                                                                        DE

                                                                                                                                                        gio
                                                                                                                                                      re

                                                                                                                                                     Re
                                                                                                                                                    sho

      prices and are averages of all
                                                                                                                                                 Off

      customer classes.
                                                                              All Options                                                        2050

                                                Source: Roadmap

                                                                                                                                                                  Massachusetts’ Decarbonization Roadmap      13
Getting a Handle on                Figure 1.9 shows how near-            Figure 1.9: Indicative 2021-2030 Capital Investment (National)
                                   term net-zero investment                          for a Net-Zero Path (from Recent Studies) ($ Billions)
Transition Cost: More
Work Ahead                         might be allocated. Near-term

                                                                                     Source: National Academies Study
                                                                                                                        BUILDINGS                                               ELECTRICITY
                                   investment would be for five                                                         ($950 billion)                                          ($905 billion)
 ƒ The Roadmap report,             key actions:
   as with other scenario
   analyses, raises questions            - Improve efficiency and
   about ultimate cost and                 energy productivity
   affordability for customers.          - Electrify energy                                                             Existing building
                                           services in the buildings,                                                   envelope retrofits, 530                                  Solar, 310
 ƒ Several other recent studies            transportation, and
                                                                                                                                                                                                             Natural
                                                                                                                                                                                                             gas power
   have identified “deep                   industrial sectors                                                                                                                                                w/CCS, 10

   decarbonization” pathways,
   some of which use the same            - Decarbonize electricity                                                                               Efficient           Building
   EnergyPATHWAYS model                                                                                                                          appliances         system

   used in the Roadmap. All
                                         - Build critical                                                               Heat pumps               equipment,
                                                                                                                                                 110
                                                                                                                                                                    controls,
                                                                                                                                                                    80
                                                                                                                        (space & water
                                           infrastructure                                                               heating), 200                                                                        INDUSTRY
   contemplate significant                                                                                                                       Efficient new buildings, 30      Wind, 300
                                                                                                                                                                                                             ($60 billion)
   capital investment,                   - Innovate to “complete                                                        NETWORKS                                   VEHICLES                                  Industrial
                                                                         Electricity
                                                                                                                        ($811 billion)                             ($250 billion)                            efficiency, 30
   particularly in the next 10             the low-carbon toolkit”       distribution, 20
                                                                                                                                                 CO2
                                                                         EV chargers, 10                                                         transportation,                             EVs &           Electric boilers, 10
   years.                                                                                                                                        70                                          FCVs -
                                     ƒ While higher than business        CO2 storage, 10                                                                                                     Medium
                                                                                                                                                                                             & heavy
                                                                                                                                                                                                             Cement w/CCS, 10

                                                                                                                                                                                                             Natural Gas to
 ƒ A report by the National            as usual, the studies                                                            Electricity
                                                                                                                        transmission, 150                          EVs - Light Duty, 190
                                                                                                                                                                                             duty,
                                                                                                                                                                                             60
                                                                                                                                                                                                             H2 w/CCS, 10

   Academies of Sciences,              characterize the incremental
                                                                         Notes: Illustration as depicted in original report. Blocks are not to dollar scale.
   Engineering, and Medicine,          cost as modest when                      Totals indicated not fully represented by sector blocks.
   summarizing existing                compared with overall gross
   literature on U.S. net-             domestic product, typically
                                                                         Figure 1.10: A Comparison of Indicators from
   zero pathways, estimates            about a percentage higher.                     Three Recent Decarbonization Studies
   incremental capital                 Importantly, costs and
   investments of $2 trillion          trade-offs are based upon                                                                                               2030                                    2050
   over the next decade, and           assumptions over a long-            Key Metric                                               2015           EI         DDPP              NZA          EI        DDPP          NZA
   $4 trillion to $6 trillion          term horizon—for example,            Final Annual
   through 2050 beyond a
                                                                            Energy Demand                                            97          129               80           64–67        125        65         50–56
                                       energy productivity gains,           (quads)
   $22.4 trillion “business-as-        cost of existing and new             Percent
   usual” baseline. Demand-            technologies, and energy             Non-emitting                                              18          60               55           62–77        100        85        98–100
                                                                            electricity
   side investment would               commodity prices. Those
                                                                            Electricity
   comprise about 60% of the           assumptions can drive                share of final
                                                                                                                                     28           44               32           21–25        73         60          38–51
                                                                            energy demand
   investment through 2030.            significantly different visions      (percent)
                                       of the energy system future          Building energy
                                       state (see Fig. 1.10).               demand                                                    18           17              16.4         18–19        11         13          13–15
                                                                            (quads/yr)

                                                                            EV share of
                                                                            light-duty
                                                                            vehicle stock                                                1        47               44           6–17         100       100          61–96
                                                                            (percent)

                                                                         Source: National Academies Study
     14   Massachusetts’ Decarbonization Roadmap                                 (see Sources for this section for report acronym references)
Getting Myopic: Pursuing                       Figure 1.11: 2030 CECP Targeted Emissions Reductions by Sector
Decarbonization in the Next Decade
                                                                                                                                                  GHG Reductions in
                                                             Sector                        Gross GHG Emissions (MtCO2e)
 ƒ As noted earlier, Massachusetts has                                                                                                            2030 (from 2017)
   other near-term activities focused                                                      1990               2017             2030
   on decarbonization. Its 2030 CECP,
   released for public comment, attempts         Transportation                             30.5              30.5           22.5–22.7                 7.8–8.1
   to identify policy measures to move
                                                 Buildings                                  23.8              19.7              10.3                     9.4
   Massachusetts to its 2030 goal of 45%
   emissions reductions from 1990.               Electricity                                28.1              13.6            8.5–9.4                  4.2–5.1

 ƒ The 2030 CECP proposes a suite of             Industrial & Non-Energy                    12.0               9.2            7.8–9.7                 (0.5)*–1.4
   strategies that will yield reductions
   across sectors, with the potential            Total                                      94.5              73.0           49.1–52.1                20.9–23.9
   reductions noted in Figure 1.11. Policy
   actions are focused on transportation,         % Reduction From 1990                        -              23%            45%–48%
   buildings, and energy supply, with          *Negative reduction indicates an increase – this reflects partial mitigation of emissions growth
   modest activity in industrial and non-
                                               Source: 2030 CECP
   energy sectors and in land use. The
   EEA’s proposed metrics and tools for
   emissions-reductions actions are more
                                               Figure 1.12: 2030 CECP Reduction Strategies for Key Sectors
   fully described in Figure 1.12.

 ƒ EEA notes that uncertainties for the                  Transportation                                 Buildings                                 Electricity
   2030 policy are equipment stock
                                                 ƒ   $130M for clean                       ƒ   Electric space heating in             ƒ   7 GWs of clean energy
   lifespans and the potential for their             transportation systems                    one million households and                projects, including
   replacement before the end of useful life                                                   300M-400M square ft. of                   3.2 GWs solar, 3.2 GWs
                                                 ƒ   750,000 zero-emission
   and technology readiness.                         vehicles (ZEV) on the road
                                                                                               commercial real estate                    offshore wind, and 1 GW
                                                                                                                                         transmission to Quebec
                                                 ƒ   Rates and programs to                 ƒ   ~20% reduction in fuel oil
                                                     allow for electric vehicle                carbon intensity                      ƒ   2 MtCO2e limit on emissions
                                                                                                                                         from imported electricity
                                                     participation in electric             ƒ   5% reduction in pipeline
                                                     markets                                   natural gas carbon intensity          ƒ   Distribution-level grid
                                                                                                                                         upgrades
                                                 ƒ   ~20% reduction in carbon              ƒ   Deep energy retrofit in 20%
                                                     intensity of diesel fuel                  of building stock
                                                 ƒ   Pilot medium-duty/                    ƒ   Passive, high-performance
                                                     heavy-duty ZEV programs                   building envelope
                                                                                               efficiency in new
                                                 ƒ   Stabilize vehicle-miles
                                                                                               construction
                                                     traveled, even with larger
                                                     fleet

                                                     7.8–8.1 MtCO2e reduction                      9.4 MtCO2e reduction                  4.2–5.1 MtCO2e reduction

                                               Source: 2030 CECP

                                                                                                               Massachusetts’ Decarbonization Roadmap            15
Taking a Closer Look at Natural Gas Utility Implications
 ƒ The 2030 CECP acknowledges that it has not evaluated the cost of specific policies, but rather estimated them generally for suites of policies
   through the Roadmap.

 ƒ One area of particular focus for 2030 is thermal electrification in buildings, which has a direct and potentially significant impact on the natural
   gas industry. It is unclear, however, what this specific transition policy will cost and how those costs will be socialized.

 ƒ D.P.U. 20-80 is intended to address the implications of the Roadmap for natural gas utilities in the Commonwealth across proposed carbon-
   reduction pathways. Actions required under the proceeding include:

    - Quantify the costs and actual economy-wide emissions reductions in “transitioning the natural gas system”
    - Discuss potential mechanisms for cost recovery or responsibility for cost incurrence, as well as potential mitigation
    - Quantify electrification strategies, including key assumptions and GHG emissions-reduction calculations (including for power generation)
    - Discuss qualitative factors to consider, including public safety, reliability, economic development, equity, emissions reductions, and timing
    - Recommend specific initiatives, actions, and milestones to reduce GHGs from gas sale and distribution
 ƒ D.P.U. 20-80 will take some of the high-level analysis performed for the Roadmap and narrow the lens on gas utilities.

     16   Massachusetts’ Decarbonization Roadmap
North Carolina: Different State, Different Regime,
Different Approach
 ƒ In North Carolina, Governor Roy Cooper has relied on an
   executive order and stakeholder groups to shape and influence
                                                                      Figure 1.13: Selected Climate-Related Activities in North Carolina
   climate and energy policy.

 ƒ In October 2018, the governor signed Executive Order 80, which
   directed the state to address climate change and transition to a       2018
   clean energy economy. In the near-term, the executive order set
   the following goals for the state by 2025:                               ƒ October 2018: Governor Roy Cooper signs
                                                                              Executive Order 80.
    - Reduce statewide GHG emissions to 40% below 2005 levels.
    - Increase registered zero-emission vehicles (ZEV) to at least        2019
      80,000.
                                                                            ƒ September 2019: DOA releases Motor Fleet
    - Reduce energy consumption per square foot in state-owned                ZEV Plan.
      buildings by at least 40% from fiscal year 2002-2003 levels.
                                                                            ƒ September 2019: Duke Energy announces
 ƒ The executive order also laid the foundation for more robust               goal of achieving net-zero carbon emissions
   action by directing state agencies to develop longer-term
                                                                              from electric generation by 2050.
   targets and plans. With nearly 70% of GHG emissions coming
   from the electric power sector and transportation, notable               ƒ October 2019: DEQ releases NC Clean
   directives included:                                                       Energy Plan.
    - NC Department of Transportation to develop a NC ZEV Plan              ƒ October 2019: DOT releases NC ZEV Plan.
      designed to increase the number of ZEVs to at least 80,000
      by 2025, establish interstate and intrastate ZEV corridors,
      and increase installation of ZEV infrastructure.                    2020
    - NC Department of Administration to develop a NC Motor                 ƒ July 2020: NC Electric Cooperatives pledge
      Fleet ZEV Plan that identifies the types of trips for which             net-zero carbon by 2050.
      a ZEV is feasible, recommend infrastructure, and develop
      procurement options and strategies.                                   ƒ December 2020: Stakeholder group
                                                                              releases NC Energy Regulatory Process
    - NC Department of Environmental Quality to develop a                     Summary Report.
      NC Clean Energy Plan that “fosters and encourages the
      utilization of clean energy resources…and development of a
      modern and resilient grid.”                                         2021

 ƒ Additional directives within the executive order tasked state            ƒ March 2021: Stakeholders discuss major
   agencies to produce the following additional reports: a climate            energy legislation.
   risk assessment and resiliency plan; a GHG inventory; clean
   energy and clean transportation workforce assessments; and a
   comprehensive energy, water, and utility conservation program
   in state buildings.

                                                                                             Massachusetts’ Decarbonization Roadmap   17
State Agencies and Stakeholder Groups Map the Path Forward
 ƒ The NC ZEV Plan organized actions in four categories: education,                           - An ensuing stakeholder process arose to design specific policy
   convenience (e.g., fast charging), affordability, and policy. Early                           recommendations. The group reached general agreement and
   actions include coordinating ride-and-drive events, facilitating fast                         recommended the following legislative package:
   charging collaboration, and establishing consistent wayfinding
                                                                                                   ƒ Adopt a performance-based regulatory framework that
   signage.
                                                                                                      includes a multi-year rate plan, revenue decoupling, and
 ƒ The NC Motor Fleet Plan used telematics data to identify 572                                       performance incentive mechanisms (PIMs).
   traditional, gas-powered vehicles that could be replaced by electric
                                                                                                   ƒ Expand securitization to electric utilities to retire
   vehicles, thereby saving the state an estimated $3.8 million and
                                                                                                      undepreciated assets, in addition to current authorization
   reducing emissions by 22,000 metric tons over the lifetime of the
                                                                                                      related to storm recovery costs.
   vehicles.
                                                                                                   ƒ Study the benefits and costs of wholesale market reform and
 ƒ As for the electric sector, the NC Clean Energy Plan established a
                                                                                                      their impacts on the North Carolina electricity system.
   goal to reduce GHG emissions 70% below 2005 levels by 2030 and
   to attain carbon neutrality by 2050.                                                            ƒ Expand procurement practices to utilize competitive
                                                                                                      procurement as a tool for electric utilities to meet energy
    - An overarching theme across the wide-ranging
      recommendations was an interest in establishing a “21st century                                 and capacity needs identified in integrated resource plans.
      regulatory model that [incentivizes] business decisions that
                                                                                          ƒ Stakeholders have since begun negotiating major energy legislation
      benefit both the utilities and public in creating an energy system
                                                                                             to be considered by the North Carolina legislature.
      that is clean, affordable, reliable, and equitable.”

                               Figure 1.14: North Carolina Greenhouse Gas Emissions by Sector

                               Note: *Industry includes fossil fuel combustion, natural gas and oil processes, and industrial processes.
                               Source: NC Dept. of Environmental Quality

     18   Massachusetts’ Decarbonization Roadmap
Key Observations Concerning
North Carolina’s Approach
 ƒ The actions and ensuing targets set
   by Governor Roy Cooper create
   short-, medium-, and long-term goals.
   Achieving incremental milestones
   will require continuous improvement
   and investments in both ZEV
   infrastructure and renewable or net-
   zero technologies.

 ƒ The focus on the electric power and
   transportation sectors addresses the
   largest sources of GHG emissions
   but also reduces the number of
   stakeholders that must pursue near- or
   medium-term actions.

 ƒ Despite being initiated by an
   executive order, the process has
   aligned stakeholders on a set of policy
   reforms that may institutionalize
   new electric utility business models
   with performance-based ratemaking,
   decoupling, and PIMs.

 ƒ Despite the absence of a legislative
   mandate, major electric utilities serving
   North Carolina customers, notably Duke
   Energy and North Carolina Electric
   Cooperatives, have announced the
   goal of net-zero carbon by 2050. What
   makes their voluntary commitments
   notable is that these utilities accounted
   for nearly 85% of the state’s retail
   electricity sales in 2019.

                                               Massachusetts’ Decarbonization Roadmap   19
What This Means for Energy and Utility Companies
 ƒ While the Roadmap and similar analyses serve as tabletop exercises             - What opportunities for investment (and returns) can come from
   for envisioning decarbonization, the real work is left to the energy              transition?
   and utility industries to assess growth opportunities, potential costs,
                                                                                  - How will the costs of transition investments be allocated among
   and deployment actions needed to implement policy directives.
                                                                                     customer classes or socialized more broadly, and what new rate
 ƒ Utilities should look closely at proposed transition actions and ask:             or pricing schemes are required?

    - What assumptions are driving different pathways? Do they                    - How much capital is needed to fund energy system investments,
       assume technology breakthroughs? Some examples:                               and where will it come from?

          ƒ Availability and deliverability of imported clean energy           ƒ In addition to addressing the questions above, and others, utilities
                                                                                 will need to consider long-term targets as they make investment
          ƒ Behavioral changes (e.g., EV adoption, ridesharing)                  and business model decisions over the next decade.

          ƒ Stock turnover and ability and cost to retrofit
          ƒ Availability of resources, including trained personnel, at scale
            during the contemplated timeframes

          ƒ Heat pump efficiency
          ƒ Dispatchability and capacity availability of different power
            generation resources

                                          Potential Actions for Utilities Considering Decarbonization

       ƒ Opportunities: Consider where investment might afford business opportunities to roll out new products and services, generate
           higher margins, improve system performance, or otherwise grow the business.

      ƒ Interim Targets: Identify interim “no-regrets” strategies that preserve real options as technology and other transitional aspects
           evolve.

      ƒ Signposts: Articulate key indicators that could serve as status markers of whether transition cost, difficulty, or timing are
           different than originally contemplated and require plan adjustment.

      ƒ Scope, Cost, and Prioritization: Prioritize “bang-for-the-buck” investments with a capital plan and resource allocation strategy.
      ƒ Rate Strategy: Identify key features of existing regulatory and rate structures that require readjustment to provide net-zero
           utility and customer incentives.

     20    Massachusetts’ Decarbonization Roadmap
Notes:                                                      Sources:
IMPLICATIONS                                ‡Analysis started with the end-state emissions goal         www.mass.gov/service-details/global-warming-solutions-
                                            and used “back-cast” modeling to understand the             act-background; www.mass.gov/info-details/ghg-
It is a long road to 2050, and pressure     transformations needed to get to 2050. It modeled           emissions-and-mitigation-policies; www.mass.gov/service-
is building in some states to reconfigure   pathways, taking into account energy supply and demand      details/gwsa-implementation-progress; Massachusetts
                                            and emissions input/output on an hourly and annual level,   S.2995, passed Jan. 4, 2021; Massachusetts Executive
infrastructure in key energy-consuming
                                            cost assumptions, and expected turnover of capital stock    Office of Energy and Environmental Affairs (EEA),
and producing segments of the                                                                           Massachusetts 2050 Decarbonization Roadmap Study
                                            (power plant, boilers, vehicles, etc.).
economy. Near term, utilities should                                                                    (Dec. 2020) (includes the Roadmap Report and associated
look closely at proposed policy                                                                         technical analyses) (Roadmap); EEA, Interim Clean Energy
                                                                                                        and Climate Plan for 2030 (Dec. 30, 2020) (2030 CECP);
roadmaps to determine recommended                                                                       Massachusetts Dept. of Public Utilities, D.P.U. 20-80, Vote
actions and embedded assumptions,                                                                       and Order Opening Investigation into the Role of Gas Local
considering implementation issues,                                                                      Distribution Companies as the Commonwealth Achieves
                                                                                                        Its Target 2050 Climate Goals (Oct. 29, 2020); National
including customer cost, expected pace                                                                  Academies of Sciences, Engineering, and Medicine,
of action, and possible barriers. They                                                                  Accelerating Decarbonization of the U.S. Energy System
should also identify potential growth                                                                   (Feb. 2, 2021) (National Academies Study); Megawatt Daily;
                                                                                                        NRDC; Foley Hoag; North Carolina Executive Order 80
opportunities as the energy system is
                                                                                                        (signed Oct. 29, 2018); NC Department of Administration,
reconfigured.                                                                                           NC Motor Fleet ZEV Plan (Sept. 2019); NC Department
                                                                                                        of Transportation, North Carolina ZEV Plan: A Strategic
                                                                                                        Plan for Accelerating Electric Vehicle Adoption in North
                                                                                                        Carolina (Oct. 2019); NC Department of Environmental
                                                                                                        Quality, NC Clean Energy Plan: Transitioning to a 21st
                                                                                                        Century Electricity System (Oct. 2019); and RMI and RAP,
                                                                                                        North Carolina Energy Regulatory Process: In Fulfillment of
                                                                                                        the North Carolina Clean Energy Plan B-1 Recommendation
                                                                                                        (Dec. 2020); WRAL, “Secret Talks Underway on Potential
                                                                                                        Major NC Energy Bill” (Mar. 10, 2021);

                                                                                                        Reports referenced in Figure 1.10 are: Energy Innovation,
                                                                                                        “Net-Zero Emissions Scenario” (2020), Policy Solutions,
                                                                                                        available at https://us.energypolicy.solutions/scenarios/
                                                                                                        home (EI); Evolved Energy Research, U.S. Deep
                                                                                                        Decarbonization Pathways Project, 350 PPM Pathways for
                                                                                                        the United States (2019) (DDPP); Larson, et al. Net-Zero
                                                                                                        America by 2050: Potential Pathways, Deployments and
                                                                                                        Impacts (forthcoming), Princeton University (Dec. 2020),
                                                                                                        preliminary results summary available at https://www.
                                                                                                        dropbox.com/s/kyz1d2b6h90vjyn/Preliminary%20Results.
                                                                                                        pdf?dl=0 (NZA). All reports were cited in the National
                                                                                                        Academies Study referenced above.

                                                                                                           Massachusetts’ Decarbonization Roadmap        21
Energy and Utility Sector Themes
Cost control and increasing capex emerge as cross-energy sector priorities.
Turning the Corner
 ƒ Over
   It has the past
           been    several
                nearly     months,
                       25 years    energy
                                since FERCand  utility
                                           issued      companies
                                                    Order         have beenopen
                                                          888, establishing discussing                 KEY TAKEAWAYS
     their
     accessperformances       in 2020 and network
              to the bulk transmission      expectations   for 2021
                                                     and just  moreandthanbeyond.
                                                                           20 years since FERC
     promulgated Order 2000, calling for the establishment of regional transmission                    After a difficult pandemic year,
 ƒ   In our review of
     organizations        selected companies’ comments to investors, almost all companies
                       (RTO).                                                                          utilities hope for improving
     discussed two significant common items:
                                                                                                       conditions and increasing
 ƒ   Over that time, large parts of the United States—as well as Canada—have
       - First, most acknowledged the efforts of the workforce in performing well
     established bid-based markets for energy and related services. These markets have
                                                                                                       revenues from commercial and
         despite the constraints of the COVID-19 pandemic. Many said that financial                    industrial customers.
     encouraged technological innovation and asset turnover in the power generation
         performance was better than expected given the circumstances.
     sector and, along with declining fuel prices, helped lower power prices over the
       - Second,
     past  20 years.    Theare
                    firms    non-RTO    West referencing
                                increasingly  has tested this  construct through
                                                            environmental,   social, its
                                                                                     andcompeting      Many companies deployed
         governance
     imbalance           (ESG) strategies. Many discussed social justice and equity
                  markets.
                                                                                                       cost control measures in 2020
         activities and workforce diversity initiatives. Most referenced clean energy
 ƒ   Setting
         and aside    issues and effects ofobjectives
               GHG emissions-reduction        the pandemic,    as we
                                                          as well, withentered  2020 some
                                                                         some focused     on           and hope to maintain cost
     markets   were feeling
         frameworks             the strains
                         for reporting      of policy
                                         climate      differences and commodity preferences
                                                 performance.                                          discipline going forward.
     among states, federal and state governments, and stakeholders in those markets.
 ƒ   More   detailed discussion
     Key questions                  of company
                        are: Can markets         priorities
                                            endure           and strategies
                                                    amidst these   frictions, appears
                                                                              should theyon the
                                                                                             evolve,
     following   pages.
     and, if so, in what way?                                                                          The energy and utility sector
                                                                                                       continues to deploy capital
                                                                                                       strategically and reposition
                                                                                                       business portfolios, many
                                                                                                       to pure-play, rate-regulated
                                                                                                       operations.

                                                                                                       While capital investment
                                                                                                       has continued to grow for
                                                                                                       infrastructure upgrades and
                                                                                                       GHG reduction initiatives,
                                                                                                       some analysts see downside
                                                                                                       risks if energy demand growth
                                                                                                       disappoints, if regulatory lag
                                                                                                       becomes an issue, or if balance
                                                                                                       sheets are weak.

                                                                                                             Energy and Utility Sector Themes   23
Looking for Stock Price Growth                Figure 2.1: Selected Energy Sector Normalized Equity Indices - Five Years (1/1/2016–3/31/2021)
                                                          (Jan. 1, 2016 = 100%)
 ƒ Setting aside the unusual
                                                           250%
   economic conditions of the past
   year, utilities have been lagging
   the overall market index as well                        200%
   as higher growth sectors such                                                                                                                                                                                                                                                                                                                                                                                                                                                    S&P 500
   as financials, technology, and                                                                                                                                                                                                                                                                                                                                                                                                                                                   S&P 500 Electric
   healthcare.                                             150%

                                             Index Value
                                                                                                                                                                                                                                                                                                                                                                                                                                                                                    Utilities Sub
                                                                                                                                                                                                                                                                                                                                                                                                                                                                                    Ind Index
 ƒ Relatively strong economic                                                                                                                                                                                                                                                                                                                                                                                                                                                       S&P 500
   growth over the past few years                          100%                                                                                                                                                                                                                                                                                                                                                                                                                     Multi-Utilities

   and recent bullish outlooks for                                                                                                                                                                                                                                                                                                                                                                                                                                                  SNL Gas Utility
   economic rebound have caused                                                                                                                                                                                                                                                                                                                                                                                                                                                     Alerian
                                                           50%
   some observers to believe that                                                                                                                                                                                                                                                                                                                                                                                                                                                   Midstream U.S.
   utilities’ defensive characteristics—
   absent a growth story—may cause                          0%

                                                                  1/4/16

                                                                            3/4/16

                                                                                          5/4/16

                                                                                                       7/4/16

                                                                                                                  9/4/16

                                                                                                                             11/4/16

                                                                                                                                           1/4/17

                                                                                                                                                         3/4/17

                                                                                                                                                                      5/4/17

                                                                                                                                                                                 7/4/17

                                                                                                                                                                                             9/4/17

                                                                                                                                                                                                               11/4/17

                                                                                                                                                                                                                           1/4/18

                                                                                                                                                                                                                                     3/4/18

                                                                                                                                                                                                                                                 5/4/18

                                                                                                                                                                                                                                                                   7/4/18

                                                                                                                                                                                                                                                                               9/4/18

                                                                                                                                                                                                                                                                                          11/4/18

                                                                                                                                                                                                                                                                                                       1/4/19

                                                                                                                                                                                                                                                                                                                      3/4/19

                                                                                                                                                                                                                                                                                                                                   5/4/19

                                                                                                                                                                                                                                                                                                                                              7/4/19

                                                                                                                                                                                                                                                                                                                                                         9/4/19

                                                                                                                                                                                                                                                                                                                                                                       11/4/19

                                                                                                                                                                                                                                                                                                                                                                                     1/4/20

                                                                                                                                                                                                                                                                                                                                                                                                3/4/20

                                                                                                                                                                                                                                                                                                                                                                                                          5/4/20

                                                                                                                                                                                                                                                                                                                                                                                                                        7/4/20

                                                                                                                                                                                                                                                                                                                                                                                                                                       9/4/20

                                                                                                                                                                                                                                                                                                                                                                                                                                                   11/4/20

                                                                                                                                                                                                                                                                                                                                                                                                                                                              1/4/21

                                                                                                                                                                                                                                                                                                                                                                                                                                                                           3/4/21
   valuations to continue to lag other
   sectors.
                                              Sources: S&P Global Market Intelligence data; ScottMadden analysis
 ƒ A look back at relative energy and
   utilities’ index values versus the
   broader S&P 500 index is shown             Figure 2.2: Selected Energy Sector Normalized Indices - Three Years (1/1/2018–3/31/2021)
   on Figures 2.1 and 2.2.                                (Jan. 1, 2018 = 100%)
                                                           160%
 ƒ Looking ahead, Figure 2.3
   captures estimated EPS growth in                        140%
   selected U.S. utilities versus their
   forward (2022) price-earnings                           120%
                                                                                                                                                                                                                                                                                                                                                                                                                                                                                    S&P 500
   multiple. This analysis indicates
                                                           100%                                                                                                                                                                                                                                                                                                                                                                                                                     S&P 500 Electric
   that many utilities may be
                                             Index Value

                                                                                                                                                                                                                                                                                                                                                                                                                                                                                    Utilities Sub
   undervalued.                                            80%
                                                                                                                                                                                                                                                                                                                                                                                                                                                                                    Ind Index

                                                                                                                                                                                                                                                                                                                                                                                                                                                                                    S&P 500
                                                           60%                                                                                                                                                                                                                                                                                                                                                                                                                      Multi-Utilities

                                                                                                                                                                                                                                                                                                                                                                                                                                                                                    SNL Gas Utility
                                                           40%
                                                                                                                                                                                                                                                                                                                                                                                                                                                                                    Alerian
                                                                                                                                                                                                                                                                                                                                                                                                                                                                                    Midstream U.S.
                                                           20%

                                                            0%
                                                                  1/2/18
                                                                           2/2/18
                                                                                     3/2/18
                                                                                              4/2/18
                                                                                                         5/2/18
                                                                                                                  6/2/18
                                                                                                                           7/2/18
                                                                                                                                       8/2/18
                                                                                                                                                9/2/18
                                                                                                                                                            10/2/18
                                                                                                                                                                      11/2/18
                                                                                                                                                                                12/2/18
                                                                                                                                                                                          1/2/19
                                                                                                                                                                                                      2/2/19
                                                                                                                                                                                                                  3/2/19
                                                                                                                                                                                                                           4/2/19
                                                                                                                                                                                                                                    5/2/19
                                                                                                                                                                                                                                              6/2/19
                                                                                                                                                                                                                                                          7/2/19
                                                                                                                                                                                                                                                                      8/2/19
                                                                                                                                                                                                                                                                                9/2/19
                                                                                                                                                                                                                                                                                         10/2/19
                                                                                                                                                                                                                                                                                                    11/2/19
                                                                                                                                                                                                                                                                                                                12/2/19
                                                                                                                                                                                                                                                                                                                          1/2/20
                                                                                                                                                                                                                                                                                                                                     2/2/20
                                                                                                                                                                                                                                                                                                                                              3/2/20
                                                                                                                                                                                                                                                                                                                                                       4/2/20
                                                                                                                                                                                                                                                                                                                                                                  5/2/20
                                                                                                                                                                                                                                                                                                                                                                            6/2/20
                                                                                                                                                                                                                                                                                                                                                                                       7/2/20
                                                                                                                                                                                                                                                                                                                                                                                                8/2/20
                                                                                                                                                                                                                                                                                                                                                                                                         9/2/20
                                                                                                                                                                                                                                                                                                                                                                                                                   10/2/20
                                                                                                                                                                                                                                                                                                                                                                                                                             11/2/20
                                                                                                                                                                                                                                                                                                                                                                                                                                         12/2/20
                                                                                                                                                                                                                                                                                                                                                                                                                                                   1/2/21
                                                                                                                                                                                                                                                                                                                                                                                                                                                             2/2/21
                                                                                                                                                                                                                                                                                                                                                                                                                                                                       3/2/21
                                              Sources: S&P Global Market Intelligence data; ScottMadden analysis

     24   Energy and Utility Sector Themes
Figure 2.3: Earnings vs. Price/Equity Multiple Outlook for Selected U.S. Utilities

                                          14%

                                                    Stocks in this quadrant have
                                                                                                                           NJR
                                                    lower P/E ratios and stronger
                                          12%       relative long-term earning growth              SR
                                                    potential and could be considered
                                                    fundamentally undervalued.                                SJI
Estimated Long-Term EPS Growth Rate (%)

                                          10%
                                                                                                                                                                  NEE
                                                                                                                                               CPK                              AWK

                                                                                                                            AGR
                                          8%                                                               AEE
                                                                                                        EVRG             CMS
                                                                                PCG
                                                                                                    ATO           OTTR                                  SJW
                                                                                          MDU                                           ES
                                                                            NFG                     ETR                   D                     WTRG                    AWR
                                                                                             SRE
                                                                                                                    AEP ALE            WEC
                                          6%                                               FE           DTE                 LNT          PNM
                                                                                                                                         XEL
                                                                                           SWX                                    AVA
                                                                                            BKH       NI             OGS
                                                                                                    DUK             NWE          SO
                                          4%                                                        POR
                                                                               EIX          PNW       PEG                    HE                                               CWT

                                                                         PPL                                                     IDA
                                                                                  Multi-utility
                                                                                           CNP                ED                                                  Stocks in this quadrant have higher P/E
                                          2%
                                                                                             OGE                           NWN                                    ratios and lower relative long-term
                                                                                                                                                                  earnings growth and could be
                                                                                                                                                                  considered fundamentally overvalued.

                                          0%
                                                0                5                   10                      15                        20               25              30               35              40

                                                                                                          Forward P/E Ratio - Calendar Year 2022

                                                                                          Electric Utility         Gas Utility          Multi-Utility   Water Utility

     Notes: For the 12 months ended Dec. 31, 2022. As of Feb. 26, 2021. Comments are per S&P.
     Source: S&P Capital IQ

                                                                                                                                                                                Energy and Utility Sector Themes   25
Deploying, and Redeploying,                   Figure 2.4: Investor-Owned Utility Historical and                                                                                                                                                                                         Figure 2.5: Investor-Owned Utility
Capital                                                   Projected Capex (as of Oct. 2020)                                                                                                                                                                                                         2019-2020 Projected
                                                                                                                                                                                                                                                                                                    Functional Capex
                                                                                                                                                                                                                     139.8
 ƒ Despite the challenges of the                           $140 B
                                                                                                                                                                                                                                     132.2                                                                                                                                             $139.8 B
                                                                                                                                                                                                                                                                                                                                      $135.6 B
   COVID-19 pandemic, capital                              $130 B                                                                                                                                        124.1                                   125.8                                                  $140 B
                                                                                                                                                                                        119.2
   spending in the utility industry                        $120 B
                                                                                                                                                            112.5         113.1                                                                                                                         $120 B                                                                        $37.4 B           27%
                                                                                                                                                                                                                                                                                                                                     $38.1 B            28%
   continued apace in 2020 (see                            $110 B
                                                                                                                                           104.0
   Fig. 2.4). According to U.S.                            $100 B                                                                96.1
                                                                                                                                                                                                                                                                                                        $100 B

                                             $ Billions

                                                                                                                                                                                                                                                                                       $ Billions
                                                                                                 90.3 90.3
   government figures, the annual                          $90 B                                                                                                                                                                                                                                        $80 B                        $39.0 B            29%                           $41.8 B           30%

   amount of electric power industry                       $80 B 74.3
                                                                                   78.6
                                                                                                                                                                                                                                                                                                        $60 B
   construction in 2020 did not dip                        $70 B
                                                                                                                                                                                                                                                                                                                                     $25.7 B            19%                           $25.9 B            19%
   below $73B (Fig. 2.6).                                  $60 B
                                                                                                                                                                                                                                                                                                        $40 B

                                                                                                                                                                                                                                                                                                                                                                                      $23.5 B            17%
 ƒ Among investor-owned electric                           $50 B                                                                                                                                                                                                                                        $20 B                        $23.6 B            17%

                                                                                                                                                                                                                                                                                                                                                                                      $2.5 B             2%
                                                           $40 B                                                                                                                                                                                                                                                                     $3.5 B             3%
   utilities, year-end capex                                         2010          2011          2012          2013 2014 2015                               2016          2017          2018 2019 2020 2021 2022                                                                                           $0 B                      $7.0 B             5%                            $8.8 B             6%

   projections as of October 2020                                                                                                                                                                                                                                                                                                        2019P                                             2020P
                                                                                                                                                                                                                            Projections                                                                                             as of October 2019                            as of October 2020
                                                                                                                                   Actuals
                                                                                                                                                                                                                            (Oct. 2020)
   projected a 3% increase over 2019
                                                                                                                                                                                                                                                                                                    Generation                                Distribution                             Transmission
   levels. Spending among functional
                                                                                                                                                                                                                                                                                                    Gas-Related                               Regulatory Compliance                                                   Other
   areas was relatively steady,
   with a slight decrease in the                    Notes: According to EEI, at the industry level, projected capex is consistently overestimated for the first year's projection
                                                           (by 5%-7%) and underestimated in the second year (by 6%-10%) and in the third year (by 20%-25%). Each annual
   generation portion of spend and a                       functional projection above is compiled during the reported calendar year and not revised to align with actual total.
   slight increase in the distribution                     So 2019 totals do not align between the EEI charts above. Data as of October 2020.
   segment (see Fig. 2.5).                   Source: EEI

 ƒ Meanwhile, with significant
   amounts of liquidity in the                Figure 2.6: Monthly Value of Private Construction Put in Place – Electric Sector
   financial system and continued
   low interest rates, transaction                         $90
                                                                                                Estimated Annual Values
   activity has largely been smaller                                       2018: $70.4B                                2019: $76.9B                         2020: $78.7B                                                                                                                                                     COVID-19 Pandemic Period
                                                           $80
   asset-by-asset transactions,
                                                           $70
   punctuated by larger spinoffs,
   divestitures, and strategic                             $60
                                             $ Billions

   minority investments by private                         $50
   equity players (see Fig. 2.7).                          $40
   These transactions reflect
                                                           $30
   movement toward simpler pure-
                                                           $20
   play, rate-regulated businesses
   for some, while acquirors may see                       $10

   opportunity to pick up potentially                       $0
                                                                          Feb-18

                                                                                                                                                   Oct-18

                                                                                                                                                                                       Feb-19

                                                                                                                                                                                                                                                                Oct-19

                                                                                                                                                                                                                                                                                                         Feb-20

                                                                                                                                                                                                                                                                                                                                                                                  Oct-20

                                                                                                                                                                                                                                                                                                                                                                                                                      Feb-21
                                                                 Jan-18

                                                                                   Mar-18
                                                                                            Apr-18
                                                                                                     May-18
                                                                                                              Jun-18
                                                                                                                        Jul-18
                                                                                                                                 Aug-18
                                                                                                                                          Sep-18

                                                                                                                                                                              Jan-19

                                                                                                                                                                                                Mar-19
                                                                                                                                                                                                          Apr-19
                                                                                                                                                                                                                   May-19
                                                                                                                                                                                                                            Jun-19
                                                                                                                                                                                                                                     Jul-19
                                                                                                                                                                                                                                              Aug-19
                                                                                                                                                                                                                                                       Sep-19

                                                                                                                                                                                                                                                                                               Jan-20

                                                                                                                                                                                                                                                                                                                  Mar-20
                                                                                                                                                                                                                                                                                                                           Apr-20
                                                                                                                                                                                                                                                                                                                                     May-20
                                                                                                                                                                                                                                                                                                                                              Jun-20
                                                                                                                                                                                                                                                                                                                                                       Jul-20
                                                                                                                                                                                                                                                                                                                                                                Aug-20
                                                                                                                                                                                                                                                                                                                                                                         Sep-20

                                                                                                                                                                                                                                                                                                                                                                                                             Jan-21
                                                                                                                                                            Nov-18
                                                                                                                                                                     Dec-18

                                                                                                                                                                                                                                                                         Nov-19
                                                                                                                                                                                                                                                                                  Dec-19

                                                                                                                                                                                                                                                                                                                                                                                           Nov-20
                                                                                                                                                                                                                                                                                                                                                                                                    Dec-20
   undervalued unregulated
   businesses and fossil fuel assets.

                                                          Note: These are estimated annual rates based upon monthly activity.
                                             Sources: U.S. Census Bureau; ScottMadden analysis
     26   Energy and Utility Sector Themes
Figure 2.7: Selected Significant ($1B+) Asset, Spinoff, and Corporate Transactions (Jan. 2019-Apr. 2021)

                                  $9
                                                                                                                                                                                                                                       Completed
                                  $8
                                                                                                                                                                                                                                       Announced
                                  $7
         Transaction Value ($B)

                                  $6

                                  $5

                                  $4

                                  $3

                                  $2

                                  $1

                                  $0
                                       Sempra     Sempra      Amerigas     Duke       El Paso      PG&E      Brookfield      AltaGas     Pattern   Brookfield   Terraform   Bay State   Direct     Equinor     PNM         Duke     Narragansett    Sempra
                                        Wind    Renewables,   Partners   Commercial Electric Co.  Electric Infrastructure   Canada      Energy    Renewable    Power       Gas Co.    Energy    Empire and Resources   Energy      Electric Co.    Global
                                       Assets      LLC                   Renewable               T&D Assets     Corp.                   Group       Corp.                  Assets              Beacon Wind             Indiana,
                                                                          Portfolio                                                                                                              Projects                LLC

     Announced                                                                         2019                                                                                      2020                                               2021

        Industry

Transaction Type                         A          C            C           A          C            A            S           C           C          S           M           A          C          A          C          M             C            M

     Buyer Type                         EU         EU           GU           F          F          Muni           -           F           F          -           F          CU          M        O&G         EU          F            EU            F

                                                                                                         Legend
                                                   Industry                                 Transaction Type                                        Buyer Type

                                                Combination utility                A – Asset acquisition                              CU – Combination utility
                                                                                   C – Corporate acquisition                          EU – Electric utility or affiliate
                                                Electric utility                   M – Acquisition of minority stake                  F – Financial investor
                                                                                                                                                                                                 Notes: Transaction value includes
                                                                                   S – Spinoff or split-off                           GU – Gas utility or affiliate                                     purchase consideration such as
                                                Gas utility                                                                           M – Merchant energy provider                                      assumed debt. Transaction status
                                                                                                                                                                                                        as of April 8, 2021.
                                                                                                                                      Muni – Municipality
                                                Renewable energy                                                                                                                               Sources: S&P Global Market Intelligence;
                                                                                                                                      O&G – Integrated oil & gas company
                                                                                                                                                                                                        ScottMadden analysis

                                                                                                                                                                                                Energy and Utility Sector Themes                  27
CEO Themes: Messages to Stakeholders
 ƒ A selected sample of messages from investor presentations and earnings calls revealed a few themes, slightly differentiated by sectors, as
      shown in Figure 2.8.

Figure 2.8: Utility Management Themes, Priorities, and Strategies by Sector

                Gas Local                                 Midstream                          Combination                        Combination                        Integrated
         Distribution Companies                         Gas Companies                   Delivery-Only Utilities*                 Utilities**                    Electric Utilities
  ƒ   Natural gas is not going away anytime         ƒ   Dramatically improved       ƒ   Significant [emissions-             ƒ   Reducing or            ƒ   Actively manage our portfolio of
      soon. But we are reinvesting today                credit metrics, with            reduction efforts] to the               unwinding exposure         assets and companies to enable
      to prepare for and capitalize on the              “strong cash generation         region [are] customers’                 to the midstream gas       this movement [to clean energy],
      transition toward decarbonization.                and capital discipline          energy efficiency initiatives,…         sector; simplifying        while ensuring our balance sheet
                                                        moving toward goal              significantly expand[ing] zero-         to focus on pure-          and credit metrics strength…
  ƒ   Our north star and vision forward is being
                                                        to improve leverage             emissions vehicle charging              play state-regulated       Asset optimization will continue
      a carbon-neutral energy provider by
                                                        metrics.”                       infrastructure and reduc[ing]           utility operations.        as we focus on core growth
      2050.
                                                                                        the number of homes heated                                         opportunities.
  ƒ   We continue to execute our well-
                                                    ƒ   Actively researching
                                                                                        with oil. Most significant,…at
                                                                                                                            ƒ   Sale of two gas
      established regulatory strategy
                                                        opportunities that will
                                                                                        least 4,000 MWs of offshore
                                                                                                                                LDC businesses as      ƒ   As we mature in our continuous
                                                        complement extensive                                                    an efficient way to        improvement efforts, we aspire to
      focused on annual filing mechanisms,                                              wind facilities.
                                                        midstream assets                                                        recycle capital and        permanently reduce O&M costs
      which mitigate the incremental impact
      of customer bills while reducing
                                                        and enhance role in a       ƒ   Strengthen core utility delivery        invest in growth           and redeploy those resources.
                                                        future transition to a          business; grow existing clean           accretive to utility
      [regulatory] lag.
                                                        low-carbon economy,             energy businesses and pursue            businesses.
                                                                                                                                                       ƒ   Develop innovative solutions
                                                                                                                                                           that include large-scale battery
  ƒ   As innovation like RNG and hydrogen               including electrification       additional clean energy growth
                                                                                                                            ƒ   Future growth from         storage, carbon capture and
      scale, the existing gas distribution system       of compression assets,          opportunities consistent with
                                                                                                                                the new clean energy       sequestration, and hydrogen-
      will deliver more and more decarbonized           potential carbon                our risk appetite; and pursue
                                                                                                                                future investments         based strategies.
      fuel, dramatically reducing emissions             capture and storage             additional regulated growth
                                                                                                                                behind-the-meter,
      without a massive build-out of new                opportunities, and long-        opportunities to add value in
                                                                                                                                to infrastructure
                                                                                                                                                       ƒ   Long-term capital investment plan
      infrastructure.                                   term opportunities like         the evolving industry.                                             includes annual projected rate
                                                                                                                                opportunities
                                                        hydrogen transportation                                                                            base growth at our state-regulated
  ƒ   Safety, reliability, and affordability make       and storage.
                                                                                    ƒ   Announced a series of                   supporting
                                                                                                                                                           utilities of >5%, with a continued
      natural gas a preferred fuel source. Eight                                        integrated transactions                 electrification of
                                                                                                                                                           emphasis on transmission,
      out of 10 homeowners in our service           ƒ   Maintaining cost                intended to simplify our                transportation and
                                                                                                                                                           transportation and distribution,
      territory prefer natural gas.... There is         discipline, achieving           energy infrastructure                   a growing mix of
                                                                                                                                                           modernization, and resilience.
      a strong recognition that natural gas is          expense and sustaining          businesses under one growth             renewables in the
      affordable, efficient, and preferable to          capital savings, getting        platform...intended to create           distribution system,   ƒ   Stability of multi-year rate plans
      electricity for heating and cooking.              more efficient and cost         scale and strategic alignment           to expanding the           allows focus on efficiency in the
                                                        effective.                      …[and] selling a non-controlling        existing aging             business…while [maintaining]
  ƒ   Over the last 10 years, we have invested                                          interest to a strategic partner….       infrastructure             strong credit ratings and balance
      more than $11B company-wide to                ƒ   Diversification across
                                                                                        [W]e’re allocating capital              replacement                sheet [and]…consistent access to
      modernize our pipeline infrastructure,            multiple commodities,
                                                                                        into the lower-risk portion             programs.                  the capital markets.
      more than 80% of which was allocated to           magnitude of
                                                                                        of the energy value chain
      safety.                                           transportation and
                                                                                        in…cross-border renewable
                                                                                                                            ƒ   Kicked off grid        ƒ   Substantial economic
                                                        storage assets, depth                                                   enhancement                decarbonization of the electricity,
  ƒ   We have not seen any bans... across               of marketing activities,
                                                                                        opportunities, large-scale
                                                                                                                                projects, including        transportation, and industrial
      our service territory. We stay in close                                           integrated LNG projects, and
                                                        and cost control efforts.                                               securing a mechanism       sectors is possible, which
      contact through our stakeholder                                                   other investments in energy
                                                                                                                                for recovery.              represents a potential investment
      engagement strategy, our local public                                             networks.
                                                                                                                                                           opportunity of trillions of dollars
      affairs and operating teams with our city
                                                                                                                                                           in the coming decades.
      jurisdictions, [and] our state legislators
      as well.

  Notes: *Combination delivery-only utilities deliver gas and electricity but do not own and operate power generation facilities. **Combination utilities are electric and gas utilities that
         own and operate power generation and transmission facilities that serve customers in a traditional integrated utility structure or as provider of last resort supplier.

Sources: Selected utility earnings calls and investor presentations

        28    Energy and Utility Sector Themes
You can also read