Saving Our Natural Ecosystem Carbon: Amazon AWS
←
→
Page content transcription
If your browser does not render page correctly, please read the page content below
Saving Our Natural Ecosystem Carbon:
Protecting Aotearoa/New Zealand’s massive natural carbon stocks from
invasive introduced browsers
Kevin Hackwell & Maitland Robinson
March 2021
Key points
Carbon stocks in Aotearoa/New Zealand’s natural ecosystems are massive; the above-ground natural
vegetation alone stores around 1,450 million tonnes of carbon.
Direct biomass consumption and methane production by feral introduced herbivores in the natural
ecosystems is estimated to be between 2.3 and 4 MtCO2e/year. The mid-point (3.1 MtCO2e/yr) is
nearly 3 times the emissions from domestic air travel in 20181.
The mid-point, and upper estimates of the increase in carbon sequestration that could result from
significant sustained introduced herbivore control are 8.4 and 17.5 MtCO2e/year, respectively. The
mid-point estimate is equivalent to nearly 60% of the 2018 emissions from road transport.
Between 2002 and 2014 there was a significant (-3.4 MtCO2e/year) decline in the carbon stocks of the
largest native forest association (kāmahi-podocarp). The most likely cause of this decline was the
impact of introduced herbivore browsing.
Pest mammal herbivore control is likely to be one of the most significant and cost-effective emissions
reductions options.
Significant and sustained introduced herbivore control to protect and enhance natural ecosystem
carbon stocks could make a substantial contribution to achieving the country’s goal of carbon
neutrality by 2050, and has the potential to allow the country to be carbon positive.
Executive Summary:
1. This research has found that Aotearoa/New Zealand could dramatically reduce its net
greenhouse emissions by conducting intensive control of introduced herbivores (deer, goats, pigs,
wallabies and possums) in native forest, shrub, and tussock lands.
2. This approach could reduce the country's greenhouse gas emissions by an amount as great as all
the 2018 fossil fuel transport (cars, trucks, domestic air-travel, etc.) emissions combined. This
makes pest control one of the most important options for greenhouse gas emission reduction
available to the country, alongside the many sensible proposals put forward by the Climate
Change Commission.
3. This option has not received much consideration, and is largely absent from the Climate
Commission's current proposals.
4. Introduced herbivores directly consume natural ecosystem biomass (leaves, branches, buds,
etc.) and produce methane that together are estimated to be equivalent to 3.1 million tonnes of
CO2 per year, or 5.6% of Aotearoa/New Zealand's reported 2018 net greenhouse gas emissions.
1The comparison with components of Aotearoa/New Zealand’s reported 2018 greenhouse gas emissions profile is being used for the
purposes of explaining the scale of the impacts of introduced herbivores on the country’s natural ecosystems. It is not done to suggest
that introduced herbivore control could be used to offset other sources of GHG emissions. Aotearoa/New Zealand must reduce its present
sources of emissions, as well as protect and enhance the country’s natural carbon stocks.
1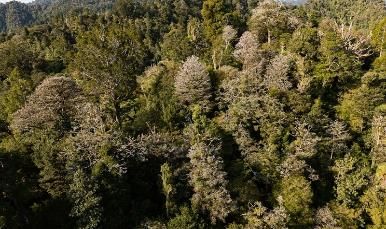
Even greater is a further 8.4 million tonnes of CO2 per year resulting from the lost carbon
    sequestration from plant growth and changes to ecosystem processes caused by the damage from
    browsing, equivalent to nearly 15% of 2018 net greenhouse gas emissions, or nearly 60% of 2018
    road transport emissions.

    5. These findings are not surprising as the vast majority of the country's carbon stocks - over 6,500
    million tonnes - are found in our natural vegetation and soils. Of this nearly 1,500 million tonnes is
    stored in the above-ground vegetation of our natural ecosystems. The sheer size of these natural
    carbon stores means that even very small changes in the condition of these stocks, either positive
    or negative, can have a massive impact on the country’s greenhouse gas emissions profile.

    6. The figures in the study are conservative estimates. The potential for increased CO2
    sequestering from pest herbivore control, and thus greenhouse gas reductions, could well be
    higher.

    7. While not part of this study, the costs of this option are likely to be very cost effective for
    reducing emissions from natural ecosystems and increasing the country’s ability to sequester
    carbon.

    8. This pest herbivore control option would have other climate change benefits as well. These co-
    benefits would enhance both ecosystem and community resilience to future climate change
    impacts. Healthy leaf litter, humus and soil layers, along with greater seedling and diverse and
    healthy forest under-story vegetation will increase rain interception and assist moisture retention,
    helping to reduce peak flood flows, and extend the length of water flow during periods of drought.
    Maintaining moisture levels will assist in reducing forest floor temperatures, thereby helping
    reduce forest fire risk, and will have multiple benefits in terms of ecosystem services and
    species/ecosystem protection.

    9. Aotearoa/New Zealand currently has an explosion of numbers of introduced herbivores,
    following decades of reduced spending on deer and goat control. Department of Conservation
    (DOC) data suggests that large herbivore populations throughout much of the country now exceed
    densities not seen since before the venison industry commenced in the 1970s. The result is
    induced native forest collapse in many areas. If not addressed there is a serious risk that these
    natural ecosystem carbon stores will go into decline with significant increases in net greenhouse
    gas emissions.

    10. A shift in the wrong direction could potentially dwarf the country’s present greenhouse gas
    emissions profile. This study reveals that the largest native forest type - kāmahi-podocarp forest -
    that make up 10% of all native forest, underwent a significant decline in stored carbon between
    2002 and 2014. The annual loss of carbon from the kāmahi-podocarp forests was equivalent to -
    3.4 million tonnes of CO2, or three times the 2018 domestic air-travel emissions, and 80% of the
    extra annual sequestration that the Climate Change Commission hopes can be generated in the
    medium term by new native forest plantings.

    11. This makes it all the more important that cost effective, and sustained introduced herbivore
    pest control in Aotearoa/New Zealand’s natural ecosystem is a key ingredient of climate policy.
    This pest control will assist the country to become carbon neutral, and possibly even carbon
    positive in the next few decades.

2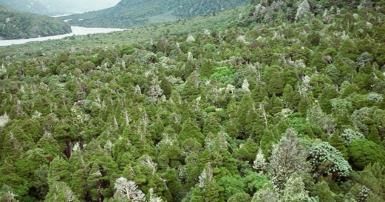
Key numbers for understanding the importance of natural ecosystem carbon stores and the threat of introduced
herbivores to those carbon stores (numbers in red represent greenhouse gas emissions, in green sequestration):
                                                              Carbon              Carbon dioxide           Percent of
                                                              million             equivalent               reported 2018 net
                                                              tonnes (Mt)         (Mt CO2e)                GHG emissions
     Above-ground carbon stored in natural                               1,456                   5,343                9,600%
     vegetation1
     Reported net greenhouse gas emissions for                           -15.1                    -55.5                100%
     20182
     Direct vegetation consumption plus methane                          -0.85                      -3.1               -5.6%
     produced by feral introduced herbivores
     (0.6-1.1 MtC: mid-point 0.85 MtC) 3
     Annual biomass loss in kamahi-podocarp                              -0.93                      -3.4               -6.1%
     forests (mid-2000s to mid-2010s) 4
     Potential extra sequestration from sustained                         +2.3                     +8.4               +15.1%
     feral introduced herbivore control
     (0.38-5.2 MtC: mid-point 2.8 MtC) 5
1.
     See table 2; 2. Ministry for the Environment (2019); 3. See tables 4&5.; 4. See table 6.; 5. see table 10.

        Recommendations:
        1.   Significantly increase the sustained and systematic control of introduced herbivores on public, private
             and iwi land in order to protect and enhance the country’s massive stocks of carbon that are stored in
             our natural ecosystems.
        2.   Focus on the control of introduced herbivores within the kāmahi-podocarp forest associations (found
             mainly on the West Coast) that the latest evidence shows are losing significant amounts of stored
             carbon.
        3.   Reduce introduced herbivore densities to ensure the recovery of palatable species and ecosystem
             health.
        4.   Replace the Recreational Hunting Advisory Council with an Ecological Advisory Council that is mandated
             to advise on the most effective methods of introduced herbivore control to maintain and restore the
             long-term ecological health of New Zealand’s natural ecosystems.
        5.   Increase resourcing of introduced herbivore control to levels similar to the very successful Predator
             Free New Zealand programme, including the development and deployment of new pest control
             technologies.
        6.   Carry out a more in-depth analysis of the National Forest Inventory data to better understand the
             direction of carbon sequestration rates for forest associations that have large components of species
             that are highly susceptible to introduced browsing.
        7.   Substantially increase the number of forest plots that are regularly surveyed in the National Forest
             Inventory to give the Inventory greater statistical power to identify the response to pest control and
             detect changes in forest carbon stocks.
        8.   Resource the National Forest Inventory so that a full report on its findings can be released within a year
             of an inventory cycle’s completion – not the 5 to 6-year gap which occurred with the first two cycle
             reports.
        9.   Release all such reports to the public on their completion – they should not remain confidential for over
             a year as happened with the 2019 report.

3
10. Carry out research on:
            a.   the production of methane by Brushtail possums in New Zealand ecosystems to better
                 understand their contribution to the country’s methane emissions;
            b.   the impact of large introduced herbivore control on soil structure and processes, including
                 forest soil capacity to oxidise methane, and to maintain soil moisture;
            c.   the ecosystem response to decreased introduced herbivore density;
            d.   more accurate national population size and distribution of introduced herbivores.
    11. Increase emphasis on establishing permanent native forests as part of the billion trees programme,
        particularly given the very short half-life of sequestered carbon post-harvest of exotic plantations.
    12. Carry out relatively inexpensive management actions, such as exclusion of domestic stock and low-level
        wild-animal control to ensure carbon gains occur in natural grasslands and regenerating shrublands
        that have been previously deforested.
    13. Introduce incentives for the retention and growth of native forests on private and iwi land and the
        control of introduced herbivores, especially where precursor scrublands are potentially the target for
        exotic afforestation.

4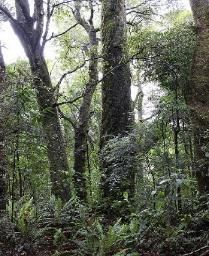
Introduction
Aotearoa/New Zealand’s contribution to global climate change

Climate change is Nature’s reaction to a multitude of human-induced ecological stresses that have increased
atmospheric greenhouse gases and therefore global temperatures. To limit the potential severity of climate
change there is an urgent need to reduce both emissions of greenhouse gasses and to sequester as much carbon
as possible in ways that will reinforce Nature’s ability to limit global temperature increases.

A country’s emission profile is made up of the difference between its total greenhouse gas production from all
sources and the amount of greenhouse gases that are removed from the atmosphere by all mechanisms. In 2018
Aotearoa/New Zealand’s gross greenhouse gas (GHG) emissions (Table 1) were equivalent to 79 million tonnes
of carbon dioxide (Mt CO2e). The majority of these emissions came from the burning of fossil fuels such as petrol
and coal (45%) and from agriculture (43%), particularly methane emissions from stock such as cows. Countering
these gross emissions was a reported 23.4 million tonnes of CO2 sequestration from measured land-use changes
and exotic forestry (LULUCF), giving a net Greenhouse Gas Inventory of 55.5 Mt CO2e (Ministry for the
Environment (MfE); 2019), which represents 15.2 Mt of carbon.

    Table 1: Aotearoa/New Zealand’s reported 2018 gross greenhouse gas emissions profile by
    CO2e and by carbon equivalent. [Adapted from MfE; 2019]
     Emissions/sequestration type                 Mt CO2e          Percentage of           Carbon
                                                                     emissions          equivalent* Mt
     CO2 (mainly fossil fuels)                 35.1               44.5%                 9.6
     Methane (mainly agriculture)              34.3               43.5%                 9.3
     Nitrous oxide (mainly agriculture)        7.6                9.6%                  2.1
     Miscellaneous                             1.9                1.5%                  0.4
     Emissions Total                           78.9               100%                  21.5

     Land-use change and forestry              -23.4                                    -6.4

     Net emissions         (emissions      –   55.5                                     15.1
     sequestration)
    * The atomic weight of Carbon is 12, and Oxygen 16. Therefore, Carbon makes up just under a third (27%)
    of the weight of a CO2 molecule.

While Aotearoa/New Zealand has a responsibility under the UN Framework Convention on Climate Change
(UNFCCC – see Box 1) to conserve and enhance carbon reservoirs, changes in carbon stocks of our indigenous
forest are not presently included in the accounting of emissions or removals under the Kyoto Protocol unless
these forests are involved in a land-use change (Kirschbaum et al. 2009). However, in future commitment
periods, emissions or removals from these forests and other ecosystems are likely to have to be accounted for
as signalled in the UNFCCC 1992.
                    Box 1.: United Nations Framework Convention on Climate Change (UNFCCC; 1992)

                    Article 4 COMMITMENTS
                    4.1(d) Promote sustainable management, and promote and cooperate in the conservation and
                    enhancement, as appropriate, of sinks and reservoirs of all greenhouse gases not controlled by the
                    Montreal Protocol, including biomass, forests and oceans as well as other terrestrial, coastal and marine
                    ecosystems;
                    Management of natural ecosystems for carbon is relevant not only for New Zealand’s reports on carbon
                    sequestration under its obligations to the UNFCCC, but is also relevant for reporting under the
                    Convention on Biological Diversity (CBD). For example, the Aichi Target number 15 is that:
                    ‘by 2020, ecosystem resilience and the contribution of biodiversity to carbon stocks has been enhanced,
                    through conservation and restoration, including restoration of at least 15 per cent of degraded
                    ecosystems, thereby contributing to climate change mitigation and adaptation, and to combating
                    desertification’.

5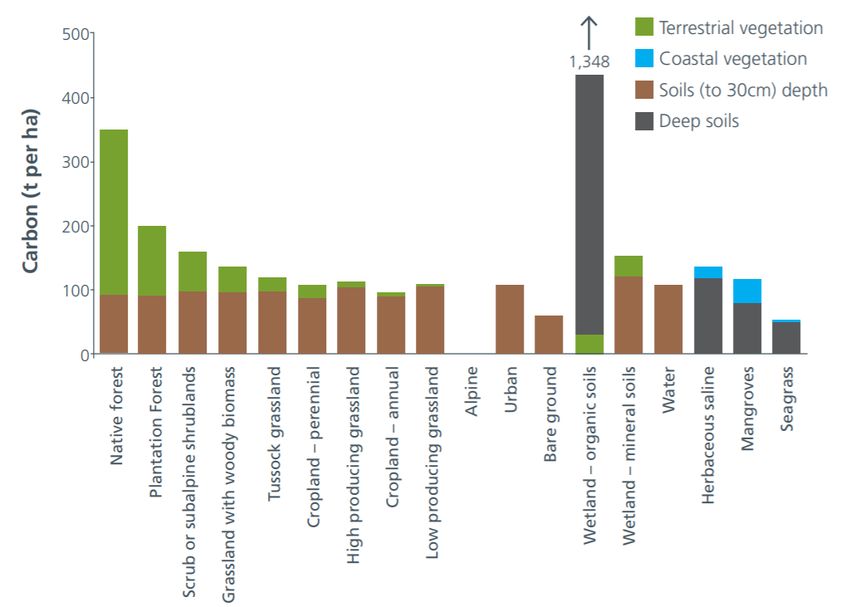
Where is New Zealand’s natural carbon?

The above-ground biomass carbon stocks in all of the country’s ecosystems is estimated at 1,860 MtC, with
natural ecosystems making up approximately 82% (1456 MtC – Table 2). Around 60% of the above ground
biomass is on Public Conservation Land (PCL) administered by the Department of Conservation (DOC). Below
the vegetative carbon stocks there is another 4640 MtC stored in our soils (about a third in PCL). This brings the
total terrestrial ecosystem carbon store to 6,500 million tonnes of carbon (Ausseil et al. 2014).

Table 2: Estimated biomass carbon stocks from various ecosystems in Aotearoa/New Zealand.
[Adapted from Ausseil et al. 2014].
                    Ecosystem                           Area           Carbon            Estimated        % of total
                                                      (000ha)          density          total carbon      vegetative
                                                                       (tC/ha)             stocks          biomass
                                                                                           (Mt C)
                    Freshwater wetlands & pakihi           249               20-31                   7            0.4%
    Vegetation:     Subalpine scrub                        478                  86                  41              2%
    Natural         Tussock grassland*                   2,583               11-27                  57              3%
    ecosystems      Mānuka /kānuka shrubland             1,212                  51                  61              3%
                    Indigenous forest*                   6,225             102-224               1290              74%
                    Total natural ecosystems            10,747                                   1,456           82.4%

                    High-producing grassland             8,765                     7                 61             3%
                    Low-producing grassland              1,658                     3                  5           0.3%
    Vegetation:     Cropland: annual                       334                     5                  2           0.1%
    Managed         Perennial: (orchards,                  192                    19                  2           0.1%
    ecosystems      vineyards)
                    Exotic forestry                      2,036            124 - 88                 231             13%
                                                                   (pre-post 1990)
                    Total managed ecosystems            13,685                                     404           16.5%
    Other                                                  700                                                    0.1%
                    All Ecosystems                      24,432                                   1,860           100%
    Soil: All
    ecosystems      Soil Carbon                         24,432                                   4,640

    Vegetation
    and Soil: All                                       24,432                                   6,500
    ecosystems
* The estimated total carbon stocks for tussock grasslands and indigenous forests were calculated from the different per
hectare carbon density of the different vegetation types and their relative area size.

For a developed country, our levels of natural ecosystem carbon are high. For example, the United Kingdom is
almost the same size as New Zealand, but has a total of around 1800 Mt of carbon stored in all vegetation and
soils, with approximately 30% (550 MtC) in high conservation value ecosystems on 20% of the land area (Field
et al. 2020), compared to some 1450 MtC in New Zealand’s natural vegetation with probably a similar quantity
in natural ecosystem soils (Tate et al. 1997).

While most wetlands with mineral soils have relatively low carbon densities (Table 2), those with deep organic
(peat) soils have the highest per-hectare densities of carbon storage (Figure 1). However, because of their very
limited extent (in part due to extensive historic wetland drainage) they, and the more extensive wetlands with
mineral soils, make up only 0.4% of the country’s total ecosystem carbon. The next highest per-hectare densities
of carbon are indigenous forests and because they cover over around 30% of the land area, they make up nearly
75% of the above-ground natural carbon (Table 2). Shrublands, tussock grasslands and subalpine scrub, together
make up a further 8% of our natural carbon stores. Exotic plantation forests contain 13% of our natural carbon,
with high and low-producing grasslands as well as croplands, including orchards and vineyards, making up the
final 3.5%.

6
Figure 1: Carbon per hectare currently stored in different Aotearoa/New Zealand ecosystems (including
soils to 30cm). Source: Parliamentary Commissioner for the Environment; (PCE 2019)

The sheer size of our natural carbon stores means that even a small change in the condition of these stocks -
either positive or negative - could have a significant impact on the country’s greenhouse gas emissions profile
(Carswell et al. 2012). For example, it would have taken an annual increase in total ecosystem carbon stocks
(including soils) of less than 0.2% (one fifth of one percent) to net our 2018 national emissions to zero. But
equally, a reduction in our natural carbon stocks of the same small amount would have doubled our net
emissions. These numbers highlight the importance that should be attached to the careful management of our
natural ecosystems to maintain and enhance their capacity to sequester and store carbon.

In the early 2000s the Department of Conservation (DOC) commissioned a range of research under the Wild
Animal Control for Emissions Management (WACEM) programme to consider the potential to manage
introduced herbivores to protect and enhance natural carbon stores. This report reviews this valuable
benchmark work as well as the wider scientific literature on the size and state of natural carbon stores, and the
impact of introduced herbivores on the capacity of those ecosystems to sequester carbon. It will look at new
work since the end of the WACEM programme, and attempt to estimate the effect that sustained and
comprehensive management of introduced deer, goats, wallabies and possums could have on our net
greenhouse gas emissions. It makes recommendations for the future management of our natural ecosystem
carbon stores in order to maximize their ability to sequester carbon.

7
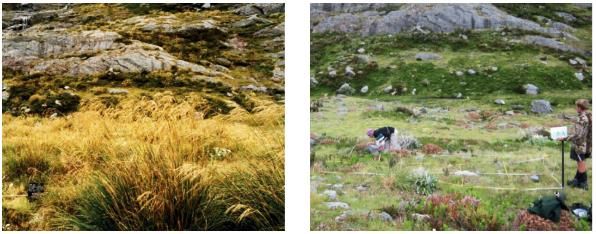
Aotearoa/New Zealand’s ecosystems and the impact of introduced mammalian herbivores

Until the arrival of humans, Aotearoa/New Zealand was the largest habitable landmass without land mammals
(with the exception of three species of bat). This absence of mammals meant that most of the ecological
niches that are dominated by mammals everywhere else were filled by birds, reptiles and invertebrates. Just as
New Zealand had a suite of bird predators, including the large Haast eagle, there was also a suite of bird
herbivores that included moa, giant flightless geese, and the giant rails, including moho (North Island takahē)
and takahē (Tennyson & Martinson; 2006).

Around half the terrestrial bird species consumed some plant foliage, shoots, buds, or flowers. Moa, geese
waterfowl and rail species occupied forests, wetlands and grasslands, and parrots and wattlebirds occupied a
range of woody vegetation types, feeding on fruits/seeds and foliage/ fruits/nectar, respectively. Other
important herbivores were the kererū, hihi, tūī and korimako (Lee et al. 2010).

Moa were the most significant of the herbivores, being physically the largest browsers and grazers within
forest and scrubland ecosystems (Lee et al. 2010). Plants evolved structural defenses against the large bird
browsers. Adaptations to limit consumption by moa included unusual divaricating form, cryptic colouring and
polymorphism where juvenile have very different leaf and branch patterns to the mature plants (Atkinson &
Greenwood; 1989).

Following the arrival of Polynesians approximately 800 years ago (Walter 2017), the combination of hunting,
modification of mainly lowland ecosystems by fire, and the introduction of two mammalian predators
(kiore/Polynesian rat and kurī/dog), led to the rapid extinction of the moa and other large bird herbivores.
More extinctions of the keystone bird herbivores followed the arrival of Europeans who carried out further
extensive habitat destruction and introduced many more alien species, particularly a range of mammalian
predators and large mammalian herbivores (Tennyson & Martinson, 2006; see Box 2).

Prior to the arrival of humans, about 80% of the country was covered in forest (PCE; 2019). Indigenous forests
and shrublands currently cover approximately 23% and 10% respectively of the land surface. The current area
of woody vegetation represents at least a 70% reduction since the arrival of humans, due to historical fire,
forest clearance, and logging (Allen et al.2013).

It has been suggested that the feral mammal herbivore introductions (deer, goats, possums, pigs, wallabies,
hares, etc.) from the early 1800s may have filled the ecological niches left vacant by the extinction of large bird
herbivores. However, many recent studies have highlighted that moa and ruminants have profoundly different
impacts on native forests (See Box 3).

Aotearoa/New Zealand’s ecosystems evolved to regenerate rapidly after natural events such as earthquakes
and storms in the presence of these avian herbivores. However, those evolutionary mechanisms often fail in
the presence of alien herbivores and predators. The rapid growth of riparian shrubs and trees after flooding
has been suppressed by deer, the seed rain and nutrient input from birds that saw the Taupo basin reforested
after massive volcanic eruptions have been lost to alien predators, and the suppressed seedlings awaiting light
from canopy collapse in mountain beech forests have been eliminated by deer, goats, chamois, hares and tahr.

With their large size and sophisticated digestive anatomy, the introduced ruminants such as deer and goats,
directly consume virtually all of the foliage of preferred native plants, and within decades to centuries notably
change the composition and regeneration patterns of the indigenous ecosystems they occupy. These longer
time scale impacts may be considerably more important than the short-term direct effects (Petzler etal. 2010).
Recent assessments of the distribution of ungulates established that in 2019/20 they occupied between 80
and 85% of public conservation land (DOC; 2020 a), which was a significant increase since 2012/13. Occupancy
(and abundance) were generally lower in national parks (helped by the success of the goat eradication
program for Taranaki/Egmont National Park) and in non-woody habitats (Figures 2 & 3).

8
Figure 2: Ungulate
                                                                                 occupancy on public
                                                                                 conservation land (PCL)
                                                                                 between 20012/13 and
                                                                                 2019/20. [Source: DOC;
                                                                                 2020 a]

    Box 2: Introducing the (large) introduced herbivores:

    The 1860s colonial culture gave rise to regional Acclimatisation Societies being set up across
    Aotearoa/New Zealand. Their motivation was to stock native ecosystems that they perceived as being
    ‘empty’. In 1867 both the Animal Protection Act and the Salmon and Trout Acts were created to protect
    and encourage the species bought from many other countries to flourish in native forests, tussocklands
    and waterways.

     Deer
    Red deer are the most widespread species of deer occupying more than 12 million ha or over 44% of the
    country. They are selective browsers, concentrating their feeding on plant species they prefer, leading to
    the local elimination of palatable herbs, shrubs, understorey woody species, and seedlings of larger trees,
    resulting in an increase of less palatable species. Red deer can also kill trees by bark-stripping. Fallow
    deer are the second most widespread species of deer but have a very patchy distribution in the North
    and South Islands occupying around half a million ha. Sika deer are found in the central North Island in
    the Kaimanawa and Kaweka Ranges, extending to southern Urewera, the Ruahine Range and the
    southern and western part of Tongariro National Park. There have also been illegal releases in Northland,
    Taranaki, and the Wellington regions. Rusa deer are east and south-east of Rotorua and are slowly
    expanding into the forests of the Urewera ranges. White-tailed deer are found across Rakiura/Stewart
    Island and an area at the head of Lake Wakatipu which includes the lower sections of the Rees River and
    Dart River valleys. White-tailed deer are also present in safari parks in the South Island (Fraser et al.
    2000). The two main populations of wild sambar deer are found in the Manawatu/Wanganui region and
    the Bay of Plenty. Their range in both these areas is mostly on private land.

    Feral goats
    Feral goats have similar dietary preferences to deer, but can also eat species poisonous to deer. Their
    impact is enhanced as they can get by on poorer food so they ‘push’ the vegetation harder, and their
    sociable nature means they aggregate in high densities putting severe pressure on favoured habitats.
    Feral goats occupy around 4 million ha (14 %) (Fraser et al. 2000), of which about 2 million ha is land
    managed by DOC. Feral goats are present on both the North and South Islands and have been present at
    various times on 34 offshore islands, but currently occur only on two (Arapawa, and Forsyth Islands).
    With a reproduction rate that is higher than deer, feral goat populations can rapidly reach very high
    densities that require substantial control efforts to protect conservation values. The scattered nature of
    goat distribution allows managers to consider eradication as an option for some mainland populations,
    as has been achieved on many islands. (Parkes; 1993)

    Tahr
    Himalayan tahr and chamois are alpine goat species and can cause significant damage to native grasses
    and herbs in the alpine habitats, with grazing causing decreases in snow tussock, changes in the
    composition of grasslands and increases in bare ground. Tahr occupy 425,900 ha in the Southern Alps
    mostly between the Rakaia River in the north and the Haast River in the south, with some outlying
    populations (Fraser et al. 2000). Tahr are highly gregarious/social animals and can reach high densities
    so, in addition to direct grazing damage, large groups of tahr can damage alpine vegetation by trampling.
    The loss of vegetation cover can result in fine-scale soil erosion.

9
Chamois
Chamois are smaller than tahr, are generally solitary and can also utilise forest ecosystems, where their
diet and impacts are similar to those of red deer. While chamois are widespread throughout the South
Island high-country occupying nearly 5 million ha, they are absent from parts of Fiordland (Fraser et al.
2000). Chamois in Westland have been shown to have higher concentrations of woody species in their
diet, compared to those on the eastern Southern Alps, and are thought to impact kāmahi in the western
alps when at high densities. Chamois can also cause damage by trampling areas of vegetation and
compactable soils, especially soft mire wetland soils.
Pigs
Because pigs have a single stomach unable to digest cellulose, they favour the most digestible food such
as improved pasture grasses, herbs, native tree seedlings, fruit, tubers and bulbs over tussock grasses or
the leaves of forest trees. Vegetation usually forms about 70% of feral pigs’ diet, and their foraging
activity can inhibit recruitment and plant community structure or composition in a range of landscapes
from sub-alpine grasslands and to temperate forests. The effect of rooting and seed consumption likely
plays a role in altering regeneration processes. Most estimates suggest that pigs now occupy approximately 9.3
million ha (35%) of the land area (McIlroy; 1989, Bengsen et al. 2017). Feral pig populations have an extraordinary
capacity for growth as sows are long-lived, can begin breeding from about 7–12 months, and can produce two litters of
up to 10 young every 12–15 months (Choquenot et al. 1996).
Possums
Brushtail possums occur throughout the country, with the exception of some alpine areas and parts of
South Westland and Fiordland, and cause serious conservation damage. Like many invasive species,
possum densities are highest at sites where possums have recently arrived for the first time (Sweetapple
et al. 2004). Possums have smaller, simpler, and less efficient digestive anatomy than the larger
ruminants. However, possums can make a major impact on overall forest diversity and, through selective
browsing, possums reduce diversity and accentuate the strong bias towards unpalatable species (Owen
& Norton; 1995).
There were early concerns about possum damage to native forests focused especially on large-scale
canopy mortality in southern rata/kamahi forests (Owen & Norton; 1995). There is also strong evidence
to link the local reduction and even local extinction of some tree species within forests to the effects of
possums such as kōtukutuku in montane Westland, and tutu and northern rātā, in alluvial forests near
Wellington (Cowan et al., 1997). A large mistletoe confined to forests and their margins, Trilepidia
adamsii, has been driven to extinction by possums (Norton; 1991).
Wallabies
There are two species of wallaby on the mainland. Bennett’s (also called red-necked) wallabies average
between 14 and 20 kg as adults and occupy some 530,000 ha in South Canterbury and north Otago
centred on the Hunter Hills. Dama (also called tammar) wallabies are smaller, weighing between 4 to 6
kg and occupy around 200,000 ha centred on the Rotorua Lakes in the Bay of Plenty. Both species occupy
a range of lowland, hill, and high-country habitats, including pasture, tussock grassland, shrubland, and
forest. Both species are undergoing a rapid expansion of their range and within 50 years could spread
across a third of the North and South Islands (Latham et al. 2016).
Impact on native wildlife
Introduced mammalian herbivores can have a considerable impact on native wildlife that rely on the
indigenous plant species they selectively eat, or the vegetation structure and regeneration they modify.
Goats left on remote offshore islands as food for castaways not only caused rapid and significant impacts
on the vegetation, they also directly disrupted seabird colonies. Goats reduced several island plant
species to the verge of extinction, with the Kermadec hebe on Raoul Island and Tecomanthe speciosa
and Pennantia baylisiana on Manawa Tāwhi/Great Island being reduced to single plants (Parkes, 1993).
The diets of possum, red deer, and goat have considerable overlap with the diet of kōkako (Leathwick et
al., 1983) and deer consume the same tussocks that are preferred by takahē (Rose & Platt; 1987). Feral
pigs have been reported to disturb ground nesting birds and eat eggs and chicks including white-capped
mollymawk (Flux 2002). Possums can compete with kea for den sites in alpine areas, and also predate a
range of native bird eggs and chicks and are known predators of Powelliphanta giant land snails (Clout;
2006, Walker; 2003, Moorhouse et al. 2003). Native bird abundance has been found to decline with
increasing length of possum habitat occupation (Sweetapple et al. 2004). Chamois-induced changes to
high alpine microclimates are thought to impact native grasshopper populations and therefore
encourage scree formation (Batcheler; 1967).
Population estimates for these introduced herbivores are reviewed in Appendix 1.
10Box 3. Ngā Moa and other bird herbivores versus deer and goats
Recent research has shown that moa diet was richer than the diet of deer and goats, implying that the
prehistoric forest understory was more varied and browsed in a different manner to deer and goats. Moa
lived at lower densities and bred more slowly than the alien browsers which now occupy New Zealand’s
ecosystems. The high population densities and intense browsing pressure of introduced mammals such
as deer and goats has driven the loss of many understory species which co-evolved with and could
therefore survive being eaten by moa (Wood & Wilmhurst; 2019, Lee et al. 2010).
The feet of deer and goats also have a different impact than moa on forest soils. Deer, goat, and tahr
foot pressures are 1.8 to nearly 3 times greater than the foot pressures of the various moa species. When
moving over soft ground, the ungulate hoof acts like a chisel, and as the toes splay out, the hoof edge
shears the soil. In contrast, the moa foot is more flexible, and rolls off the ground causing little or no
cutting damage with the edge (Duncan & Holdaway; 1989). At high population densities ungulate hooves
disturb soils and have a higher impact on soil compaction than moa.
Effects of introduced invasive herbivores on natural carbon stocks and carbon sequestration.
Freeland (1990) found that for invasive introduced populations of mammalian herbivores, density at carrying
capacity was higher for given bodyweights than it was for the same species within their natural range. He
argued that herbivores could attain higher densities at carrying capacity outside of their natural range because
the food resources they utilised had not evolved defences specific to reducing the impact of those herbivores.
Deer, goats (including tahr and chamois), pigs, wallabies and possums have direct effects on carbon stocks and
carbon sequestration through the direct consumption of vegetation biomass (leaves, flowers, fruit and seeds,
bark, seedlings, etc.), but the effect of this direct consumption is relatively small compared to the large total
biomass stocks in most natural ecosystems. However, there is general recognition that the indirect impacts of
herbivores on ecosystem structure and composition through reductions or elimination of preferred species,
their preferential consumption of nutritious litter, their impacts on ecosystem microclimates and moisture
retention can together have large ecosystem-level impacts on the cycling of nutrients and carbon (Burrows et
al. 2008).
As part of the DOC-funded Wild Animal Control for Emissions Management programme, Holdaway et al. (2012)
prepared a report on the “Potential for invasive mammalian herbivore control to result in measurable carbon
gains”. In addition to the known biodiversity benefits of introduced herbivore control, the paper looked at the
potential for such control to lead to measurable carbon gains across the whole public conservation estate.
While the focus of the DOC-funded work undertaken by Landcare Research was on the conservation estate,
the conclusions are applicable to the control of introduced herbivores across all natural ecosystems, regardless
of tenure (Carswell et al. 2008).
Direct consumption of vegetation in woody habitats.
The most direct impact of introduced herbivores on climate change is through their consumption of vegetation
(mainly leaves, but also buds, flowers, seed and fruit, leaf litter, bark, and the seedlings that would become
future forests), and its conversion into animal biomass, CO2, faeces and urine, and the production of methane
(particularly by ruminants).
Direct biomass consumption
The plant species that are palatable to mammals often have rapid growth rates, including new spring growth,
thin leaves with high leaf nutrient contents, and have invested little in defence chemistry (e.g. tannins,
phenols), or less digestible structural carbohydrates. They often have short lifespans and a low wood density
(low carbon). These plants are also often restricted in space (e.g. to more fertile, moist or sunnier sites) or time
11(e.g. to canopy gaps, or particular seral stages) and therefore are naturally uncommon. Therefore, they often
make a comparatively low contribution to total biomass (Nugent et al. 1997).
Among the 16 species that store the most carbon in forests (Table 3), only 3 (kāmahi, pāpāumu/broadleaf, and
māhoe) are palatable to deer and goats and 5 (kāmahi, southern and northern rātā, Hall’s tōtara, and māhoe)
are palatable to possums (Bellingham et al. 2014). Nationally, the group of most possum-preferred species
make up approximately 20% of the above ground live tree carbon pool and have a similar growth but
significantly more mortality compared with all other species (Beets et al. 2009). The biggest effects of
controlling alien browsers on forest carbon storage are likely to be seen in broadleaved forests where a large
amount of the vegetation biomass is made up of palatable species.
In podocarp-hardwood forests the direct carbon losses from deer have been measured at around 1% of the
annual total foliage production and over 3% for possums, together accounting for 0.055 tC/ha/yr (Nugent et al.
1997). Possums ate around 1 to 2% of annual beech foliage production in montane red-silver beech forests in
the Hurunui Valley representing between 0.015 to 0.026 tC/ha/yr. (Sweetaple; 2003). Bark chewing of beech
trees was considered to be far more damaging than the relatively small quantities involved would suggest, as
the ring barking led to the death of small to moderate-sized branches, particularly where possums were most
abundant.
Table 3: The 16 tree species that comprise the largest proportion of total carbon (C) in live stems
in forests on public conservation land throughout Aotearoa/New Zealand; values derived from
measurement of 542 plots 2009–2013, and species ranked in descending order. *also includes F.
cliffortioides and hybrids. (Total C in live stems as tC/ha.) (Adapted from Bellingham et al. 2014)
Species Carbon t/ha (2009-13)
Mean ± SEM
Silver beech Lophozonia menziesii 28.03 ± 2.41
Red beech Fuscospora fusca 20.60 ± 2.31
Kāmahi Weinmannia racemosa 15.49 ± 1.30
Black/mountain beech Fuscospora solandri* 12.91 ± 1.35
Rimu Dacrydium cupressinum 6.77 ± 1.13
Southern rātā Metrosideros umbellata 6.05 ± 1.19
Tawa Beilschmiedia tawa 5.56 ± 0.92
Hard beech Fuscospora truncata 4.73 ± 1.02
Pāpāumu Griselinia littoralis 1.91 ± 0.38
Miro Pectinopitys ferruginea 1.76 ± 0.31
Mataī Prumnopitys taxifolia 1.65 ± 0.69
Tāwheowheo Quintinia serrata 1.50 ± 0.24
Northern rātā Metrosideros robusta 1.42 ± 0.73
Hall’s tōtara Podocarpus laetus 1.34 ± 0.24
Māhoe Melicytus ramiflorus 1.34 ± 0.30
Kahikatea Dacrycarpus dacrydioides 1.13 ± 0.45
The seemingly small short-term effects on carbon stocks from direct consumption by the large browsers hides
the important indirect long-term effects on carbon sequestration. For example, in the long-term, death of
individual established trees caused by possums becomes more significant if the species are not able to
regenerate because of deer or goat browsing of their seedlings. (Coomes et al. 2003; Burrows et al., 2008
Nugent et al. 1997). In regenerating forests, the preferential loss of seedlings of palatable species can alter the
course of forest development and reduce potential long-term carbon sequestration by preventing the
establishment of high-biomass late-successional species. For example, this has been observed in regenerating
kānuka on south Kaipara Spit where fallow deer have prevented the establishment of broadleaved tree species
(Smale et al. 1995).
12Canopy mortality
The direct browsing of possums or ring-barking by deer (figure 4), goats, and possums can increase the
mortality of canopy trees (. Possum browsing has been identified as the main cause of extensive canopy
dieback in kāmahi -dominated forests in Te Urewera, and rātā-kāmahi forests in South Westland (Allen et al.
1984; Holdaway et al. 2012).
Figure 4: Trunk of Pseudopanax colensoi var. ternatum with a
dbh of 40cm, ringbarked by deer in lowland forest at Poison
Bay, Fiordland. The first deer to invade an area of forest on
Secretary Island, Fiordland, showed an almost exclusive
preference for bark of this species, killing mature trees in the
process. (Photo from Mark & Baylis; 1975).
Investigating significant kāmahi die-back in the Kaitake range of
Taranaki/Egmont National Park, Clarkson (1993) noted possums find palatable
kāmahi shoots growing from buds on the trunk or branches being targeted as
preferred food. The kāmahi die-back was attributed to severe possum
browse, with high levels of possum browsing impacting on trees’ ability to
recover from the damage caused by Cyclone Bola.
In other areas significant shifts in composition and structure of many
indigenous ecosystems have been attributed to the combined effects of ruminants and possums. For example,
in the southern Ruahine Range where tall ancient forests at low to mid-altitude were replaced in the mid-20th
century by short-statured forests in which tree ferns and other non-palatable species are abundant. Such
changes resulted in reduced above-ground carbon stocks (Bellingham et al. 2014). Possum damage is also
responsible for severe canopy dieback in the mountain cedar forests of the upper Rakaia (figure 5a), which had
not experienced pest control for over 30 years (Harding; 2009). In Te Tai Tokerau/Northland the relatively
recent arrival of possums (60 years ago) is evidenced by the extent of dying totara and other palatable species
(figure 5b). Because possums arrived in most areas of the country decades earlier, this type of tipping point
passed decades ago.
Figure 5a: The unique and rare
mountain cedar forests in the upper
Rakaia Valley collapsing due to possum
browsing, in the absence of pest
control. (source DOC).
Figure 5b: The forests of Te Tai
Tokerau/Northland were one of the last
to experience colonisation by possums,
starting in the 1960s. Many of the
region’s forests contain the skeletons of
recently lost palatable canopy species,
killed by the impact of continuous
browsing that weaken the trees to a
tipping point where further browsing
triggers an irreversible decline, or
accelerates dieback caused by insect
attack, etc. (photo Dean Wright)
13The largest declines in forest carbon are likely to occur where there are high possum numbers in forests
dominated by canopy trees that decay quickly (Holdaway et.al 2012), and this has been borne out by the latest
national forest carbon stock assessment where the kāmahi-podocarp forest association was the only type of
forest to record a significant reduction in carbon store (see below; page 15).
Seedling mortality
The effect of browsing on forest floor seedlings is not only due to deer, goats, and pigs. For example, in beech-
podocarp-broadleaved forest near Dunedin, seedling densities in exclosures that excluded both possums and
rats were 3.6 times as high as in control plots, and 2.1 times as high as in exclosures that excluded only
possums (Wilson et al. 2003), indicating the effects on seedling recruitment of rat seed consumption. Possums
have also been found to consume up to around 30% of beech seedfall during beech forest mast events
(Sweetapple; 2003). This level of seed consumption by possums could be significant for beech forest
recruitment, particularly when combined with the beech seed consumption of rats and mice.
Magnitude of direct Carbon consumption
While the per-animal direct consumption of vegetation is relatively small, when the combined feral
populations of large introduced herbivores across all natural habitats are taken into account, their impact
takes on national significance. A rough estimate of direct consumption comes to between 2.8 and 5.2 million
tonnes of carbon dioxide equivalent per year (Table 4).
Table 4: The direct national annual biomass carbon losses due to introduced herbivore consumption.
Herbivore Annual dry Herbivore Annual Annual
matter population population direct population
consumption estimate5 consumption direct
(kgC/yr) MtC/yr consumption
MtCO2e/yr
Deer 240-4901 300,000 0.072 - 0.147 0.26-0.54
Goats 90-1801 500,000 0.045 - 0.090 0.16-0.33
Pigs 158-2242 300,000 0.047 - 0.067 0.17-0.25
Possums 17-353 30,000,000 0.523 - 1.040 1.92-3.82
Wallabies Bennett’s 654 1,064,400 0.069 0.25
Dama 284 410,000 0.011 0.04
Total direct biomass C
consumption 0.767 - 1.424 2.8-5.23
Total biomass 0.537 to 0.997 1.96 to 3.66
consumption loss
(digestibility factor: 70%)
1. From Holdaway et al. (2012); 2. From Dzieciolowski et al. (1990); 3. Range from Cowan (2007); 4. From Latham et al. (2020);
5. For calculations of herbivore population estimates; see Appendix 1.
Between 25 to 30% of the eaten biomass is not metabolised and passes through the animal to become part of
the soil carbon pool (Castro Lima et al. 2016). If the upper estimate of 30% that passes through the animal is
used, the biomass loss due to direct consumption would be equivalent to between 1.9 and 3.7 million tonnes
of CO2, which is between 3.4 and 7 percent of our reported 2018 net greenhouse gas emissions.
Methane production by introduced herbivores
Methane (CH4) is a potent greenhouse gas with a 100-year global warming potential at least 25 times that of
CO2 (PCE 2019). Ruminant animals such as deer, goats, tahr, and chamois have specialist fermentation
stomachs that produce methane during the digestion. Feral deer are estimated to produce 16.5 kg of methane
per animal per year (Hristov; 2011), with individual feral goats producing around 10kg CH4/yr (Hristov et al.
2013). This is equivalent to around 410kg CO2e/animal/yr and 250kg CO2e/animal/yr respectively.
14Pigs are not ruminants and their simpler digestive systems produce only a small amounts of methane (1kg
methane, or 25kg CO2e) per animal per year (Crutzen et.al 1986). Based on the population estimates of these
larger introduced herbivores (appendix 1), together they produce around 9,800 tonnes of CH4 a year (table 5).
Wallabies possess a forestomach that supports a cooperative host-microbe association that releases nutrients
from plant biomass. Though analogous to rumen fermentation, this results in lower methane emissions (Gagen
et al. 2014). Bennett’s wallabies produce up to 2.5 litres of methane per day (Madsen & Bertelsen; 2018),
which equates to 0.51 kg CH4/animal/yr. Dama wallabies produce up to 0.8 litres of CH 4 per day2 (von
Engelhardt et al. 1977) which equates to 0.16 kg CH 4/animal/yr.
The even simpler digestive system of possums is generally assumed to produce little or no methane (Holdaway
et al. 2012). However, Brushtail possum, and other small arboreal marsupials such as the Greater Glider,
nevertheless have extended hindguts where fermentation of plant structural carbohydrates occurs (Foley;
1984). When processing a poorly-fermentable Eucalyptus leaf diet, which has high levels of cell wall lignin, the
short-chain fatty acids produced by this hindgut fermentation can provide up to 15% of the possum’s
digestible energy (Foley et al. 1989).
Assuming a similar rate of CH4 production per body mass as Greater Gliders (Foley; 1987), Brushtail possums
with an average weight of 2.5kg would produce around 0.18g CH 4/day or approximately 65g CH4/yr. While this
is not a lot per individual possum, when the total population of approximately 30 million possums is taken into
account, it amounts to 1,950 tonnes of methane per year, which in turn is equivalent to some 42,900 tonnes of
CO2. The availability of more easily fermentable food sources in New Zealand ecosystems, where high levels of
structural carbohydrates (cellulose, hemicellulose) are replaced by non-structural carbohydrates (starch and
sugars), is likely to increase rates of fermentation (Castro Lima et al. 2016), with a potential consequent
increase in possum methane production on this side of the Tasman Sea. For the purposes of this analysis the
Australian rates of methane produced from poor quality Eucalyptus leaf food sources will be used.
Table 5: Estimates of the annual methane emissions from feral introduced herbivores.
Herbivore Methane Estimated Estimated annual Estimated
emissions per population7 CH4 emissions annual CO2e
animal kg CH4/yr (tonnes CH4) emissions
(kgCO2e/yr)
Deer 15 (375)1 300,0006 4,500 112,500
Goats (including 10 (250)2 500,0006 5,000 125,000
tahr and chamois)
Feral pigs 1 (25)3 300,0007 300 7,500
Possum 0.065(1.6)4 30,000,0008 1,950 48,750
Wallabies
Bennett’s 0.51(13) 5 1,064,4009 543 13,570
Dama 0.16(13) 6 410,0009 66 1,650
Total 12,359 308,970
1. Hristov; (2011); 2. Hristov et al. (2013); 3. Crutzen et.al (1986) and Rivero et al. (2019); 4. Based on assumption
that Brushtail possum has a similar rate of CH4 production per body mass as Greater Gliders (Foley; 1987); see text;
5. Calculated from Madsen & Bertelsen (2012). 6. Calculated from von Engelhardt et al. (1977). 7. For calculations
of herbivore population estimates; see Appendix 1.
When the methane production estimates are combined with the population estimates of the large feral
introduced herbivores, together they produce around 12,360 tonnes of CH 4, which is the equivalent of around
309,000 tonnes of CO2 a year (table 5). This is close to one percent of the country’s 2018 biogenic methane
production, and represents 14% of the annual 90,000 tonne reduction in agricultural methane emissions by
2025 and 6% of the 2035 annual reductions (210,000 tonnes) that are being recommended by the Climate
Change Commission (CCC 2021a; recommendation 3, p.33).
2 The lower range value of methane produced on higher energy/higher protein diet (von Engelhardt et al. 1977).
15Combining the direct carbon consumption estimate with the methane production estimate (tables 4 & 5) we get a range for the direct impact of feral introduced herbivore populations of around 2.3 to 4.0 million tonnes of CO2e per year. To give some context to this estimated range, it is equivalent to 5.6% of Aotearoa/New Zealand’s reported 2018 net greenhouse gas emissions and nearly two times greater than the reported loss of between 1.2 to 2.4 Mt CO2e each year from deforestation (MfE, 2019). The Climate Change Commission described this loss from deforestation as “low but non trivial”, and has recommended that no further native forest deforestation occurs after 2025. The direct consumption and methane emissions range also encompasses the Commission’s estimate of the long-term annual contribution (+4 MtCO2e/yr) that could be made by new native forests established on steeper, less productive land by 2050 (CCC. 2021a). Browser impact on forest and shrubland soils Wardle et al. (2001) found that while there were several small but statistically significant effects of browsing on some measures of soil quality, there were also strong and significant effects on species composition of leaf litter, and composition of various litter‐dwelling faunal groups. The impact of browsing on soil fauna was correlated with the effects on the leaf species that made up the litter layer, but was not correlated with the effects of browsers on the composition of plant communities. Over a quarter of the locations surveyed showed significant effects of browsers on the soluble organic carbon concentrations of the humus, and, averaged across the 30 locations, concentrations were significantly greater (20%) inside, than outside exclosures. For many sites, browsing mammals had a significant effect on carbon storage in the humus and litter layers. Despite the strength of these effects, their direction was highly idiosyncratic, with browsers significantly promoting sequestration of carbon in some cases, but having the reverse effect in others. The site-specific effects of introduced browsers reflected the importance of soil texture and moisture on the levels of soil carbon. Several mechanisms have been proposed for how introduced herbivores can indirectly affect below-ground carbon sequestration - either positively or negatively - by influencing the quantity and quality of the vegetation biomass that is returned to the soil (Peltzer et al., 2010). Replacement of palatable, high-nutrient species with low-nutrient species, plus the preferential consumption of high-nutrient litter from canopy and sub-canopy trees, can lead to reduced litter quality, disrupting the composition of the soil litter and the accumulation of carbon in the soils’ mineral layers. Compaction of soils by large grazing herbivores can alter soil moisture by reducing the porosity and ability for water to infiltrate. This in turn can inhibit the flow of nutrients, slow root or shoot growth, and alter the distribution of soil microbes. In addition to reducing plant growth, declining soil moisture may inhibit microbial biomass and change the soil’s bacterial/fungal ratios, which can in turn impact on nutrient cycling and storage (Gass & Binkley; 2011). Compaction that increases soil bulk density and reduces the air-filled spaces within the soil reduces its capacity to hold moisture. This increases the soil’s likelihood of becoming water-logged and reduces the soil’s capacity to oxidise methane (Fest et al. 2017; see Box 4). In the Waikato region, Didham et al. (2009) tested the effects of livestock exclusion and mammalian pest control, on leaf-litter invertebrate communities in 30 heavily fragmented forest remnants and larger forest reserves. For key taxa, such as Diplopoda, Isopoda, Coleoptera , Mollusca, Thysanoptera and Formicidae (Hymenoptera), densities were 10- to 100-fold higher in remnants with pest control, particularly where livestock were also excluded. This work was followed up by Denmead et al. (2015) who tested the livestock trampling effects on land snail communities in Waikato forest remnants using simulated trampling under field conditions. They found that even at very low frequency, trampling caused severe changes to land snail communities. The underlying drivers of changes in those communities varied, but were primarily linked to leaf- litter mass although litter and soil moisture contents, and lack of soil compaction, also had significant positive effects on snail density independent of the experimental treatment effects. Denmead et al., concluded that in NZ in particular, the absence of ungulate trampling in the evolutionary history of ecosystems may have made invertebrate communities more vulnerable. 16
Because organic matter decomposition is predominantly mediated by the soil biota, and is a process that
underpins nutrient cycling and the provision of plant nutrients (Carlesso et al. 2019), such major reductions in
soil invertebrate communities in the presence of stock and feral introduced herbivores could cause significant
changes to soil carbon and nutrient processes.

Reducing the capacity of soils to retain moisture adds to vegetation stress during dry periods and is likely to
contribute to greater tree mortality during periods of drought. Kumbaski et al. (2010) found that long term red
deer grazing in a Turkish woodland reduced litter mass and caused crucial changes in a range of soil
characteristics, including significantly increased compaction, higher soil bulk density, less saturation capacity,
lower soil pH, and less organic carbon content.

The forested Haida Gwaii Islands (1 million ha.) off the coast of British Columbia have been isolated from
continental North America for around 10,000 years since the last glaciation, and, until 130 years ago, were
ungulate free (Gaston et al. 2006). Maillard (2019) studied the soil response to the colonisation and then
culling of Sitka black-tailed deer. The study found that the high foot pressure of ungulates induced physical
compaction that was significantly higher on islands with over 70 years of deer presence, than on islands never
colonised by deer. In addition, soil water content and total phosphorus were significantly lowered after 70
years of deer presence. Trampling of soil by deer also slowed litter decomposition, reducing litter quality and
modifying microbial community structure. Most of these effects only became apparent after the long periods
of time.

The impact on shrubland soils is similar, with large herbivore grazing being correlated with drier, more
compacted, soils and nutrient loss. For example, Bassett et al. (2005) found that soil compaction affected
mānuka and cabbage tree seedling root development by increasing soil strength and decreasing oxygen
availability. In Colorado, after 16 years of excluding deer in montane mixed grassland–shrub/woodland
habitat, the mean increase of soil carbon concentrations in exclosures was +14%, or just under 1% per year.
Soil bulk density in the exclosures was 25% less and soil moisture was 15% higher than in grazed areas. In a
similar study in remnant grassy woodlands in southern NSW, Spooner et al. (2002) found fenced sites also had
less soil surface compaction, significantly higher numbers of tree recruits, and significantly greater cover of
native perennial grasses, with less cover of exotic annual species than in the grazed sites.

                  Box 4: methane oxidation by native forest soils – impact of soil compaction

                  Soils can reduce methane emissions through the action of methanotrophs, a group of soil bacteria that
                  oxidise methane to use it as a source of energy. Most soils host methanotrophs, but “pristine”
                  Aotearoa/New Zealand beech forest soils have some of the highest rates of methane consumption in the
                  world with the measured rates about 6.5 times higher than rates reported for most Northern Hemisphere
                  forest soils. Nearly half of all the country’s soil methane oxidation occurs in beech forests (Price et al.
                  2004).
                  Most of the methane oxidation, which averages -10.5±0.6 kg CH4/ha/yr, occurs beneath the organic
                  horizon not the organic (litter) layer, with the rate mainly influenced by soil water content, which in turn
                  is determined by the extent of the soil’s air-filled spaces. When the soil airspaces are restricted and/or
                  filled with moisture there is less CH4 oxidation (Fest et al. 2017). Organic matter in the mineral soil
                  reduces soil bulk density, and increases porosity and the diffusion of gas. The low bulk density allows
                  greater root penetration, which in turn contributes to a greater porosity.

                  The methane oxidation rates increased through a sequence of naturally regenerating kānuka shrublands,
                  increasing from -1.5kg CH4/ha/yr in unimproved pasture, to -5.1kg CH4/ha/yr in 80 year-old kānuka
                  shrublands (Price et al. 2010).

                  The contribution to greenhouse gas reductions from soil methane oxidation is nationally significant, and
                  has been calculated to be a sink for 147,000 tonnes of CH4 per year, which is equivalent to around 12%
                  of the 2018 agriculture CH4 emissions, or nearly 7% of the country’s reported 2018 net greenhouse gas
                  emissions (-3.7MtCO2e/yr).

                  Price et al. (2001) suggested that our native forests soils represented an undisturbed low N-input natural
                  forest, that could be considered to be a pre-industrial, pre-agricultural benchmark for temperate forests
                  worldwide. By contrast our pasture soils have very low measured methane oxidation rates that are

17
You can also read