SCENARIO PLANNING DEVELOPING AND IMPLEMENTING SCENARIOS FOR YOUR INTEGRATED RESOURCE PLAN - IN.gov
←
→
Page content transcription
If your browser does not render page correctly, please read the page content below
SCENARIO PLANNING
DEVELOPING AND IMPLEMENTING SCENARIOS FOR YOUR
INTEGRATED RESOURCE PLAN

Horizons Energy
Indiana Contemporary Issues Conference
April 25, 2017
AGENDA
 • Why Scenario Analysis is Important
 • Developing Scenarios (Qualitative)
    – Scenario Building Blocks
    – Themes
    – Story Lines
    – Timelines
 • Implementing Scenarios (Quantitative)
    – National Level IRP
    – Utility Level IRP

                                           Page 2
Why Scenario Analysis Is Important

Challenge the     “If past history was all there was to the game, the richest
status quo        people would be librarians.”

                            Warren Buffett

Anticipate the    “A failure of imagination. We failed to imagine that the era we
unexpected!       now find ourselves in could ever happen.”

                            Thomas Kean, Chair, 9/11 Commission, July 23, 2004

Consistently      “We are continually faced by great opportunities brilliantly
assess business   disguised as insoluble problems.”
decisions
                            Lee Iacocca

                                                                                 Page 3
Defining Uncertainty
“As we know, there are known knowns; there are things we know we
know.
We also know there are known unknowns; that is to say we know
there are some things we do not know.
But there are also unknown unknowns—the ones we don’t know we
don’t know.”
Donald Rumsfeld
United States Secretary of Defense, February 12, 2002
Rumsfeld was referring to the Department of Defense use of a Johari
Window
Page 4Johari Window
KNOWN UNKNOWN
“As we know, there An unknown known
KNOWNS
are known knowns; is something we
there are things we know, but do not
know we know.” realize is relevant.
“We also know there “But there are also
UNKNOWNS
are known unknowns; unknown unknowns
that is to say we - the ones we don’t
know there are some know we don’t
things we do not
know.”
know.”
Page 5Black Swan Event
(Unknown, Unknown)
Unexpected events of large magnitude and consequence.
Such events, considered extreme outliers, collectively play
vastly larger roles than regular occurrences.
While Black Swans are unpredictable by definition (unknown,
unknown), we still can perhaps study their impacts. In other
words, we may not know the cause, but we can guess
possible impacts to the utility industry input drivers.
Page 6AGENDA
• Why Scenario Analysis is Important
• Developing Scenarios (Qualitative)
– Scenario Building Blocks
– Themes
– Story Lines
– Timelines
• Implementing Scenarios (Quantitative)
– National Level IRP
– Utility Level IRP
Page 7Scenario Building Blocks
• Time Horizon – Generally 20 or more years
• Predetermined Elements – Legal, Market, or Societal Forces
(microgrids, market competition, reliability)
• Key Uncertainties – Forces driving fundamental changes
(renewables, batteries, natural gas, environmental concerns)
• Prime Movers – Intuitions and actors that can directly affect Key
Uncertainties (President, Congress, EPA, FERC, IURC, State
Governments, RTOs)
• Wildcards – High-impact very low probability events (i.e. Black
Swan Events)
• Signposts – Specific future events that may signal or verify the
existence of a scenario
Page 8Themes
The scenario building blocks are organized into themes. The
idea is to create unique plausible futures based on a theme.
The themes could be around Technology, Reliability,
Globalism, Isolationism, Terrorism, Green World, etc.
The goal is to create diverse themes which “bookend” a wide
variety of plausible futures. It’s important to avoid the tunnel
vision and herd mentality of the day when creating the
themes.
Page 9Storylines
A Storyline is developed for each Scenario Theme. In this
exercise, the stakeholders identify events which are expected
to occur in this scenario including their impact and timing.
The idea is to create a narrative around each plausible future
by identifying signposts which may indicate the pace and
direction of that particular scenario.
Page 10Developing Timelines
A Timeline is developed for each Storyline. The timeline
provides the necessary information to model the scenario.
New supply-
side
resource mix
54 GW of is largely
coal-fired combined Renewable
EIA load generation cycles, generation
forecast retired wind, and serves 14%
CAGR ≈ 1% (2016-2020) solar of load
2018 2020 2022 2024 2026 2028 2030 2032 2034 2036
Forward Curve 5.5 GW of No CO2 Tax CO2 emissions 73 GW of coal
for fuel blended new nuclear reduced to 10% retired (2021-
to EIA Long- on-line below 2005 2036)
Term Forecast levels
Existing
Environmental
Regulations
Page 11AGENDA
• Why Scenario Analysis is Important
• Developing Scenarios (Qualitative)
– Scenario Building Blocks
– Themes
– Story Lines
– Timelines
• Implementing Scenarios (Quantitative)
– National Level IRP
– Utility Level IRP
Page 12Scenario Drivers
Status Scenario Scenario Scenario Scenario
Quo 2 3 4 5
Medium- Medium-
Demand Reference Low High
Low High
Medium- Medium-
Fuel Reference Low High
High Low
Battery, Battery, Advanced
Technology battery, smart
Improvements
Current Current smart grid, smart grid, grid with fed
EE, EV EE, EV incentives
Environmental CO2 Cap CO2 Rate
Existing Laws Existing Laws CO2 Tax
Regulations and Trade Cap
Pool Pool Pool Pool
Reserve Pool
Requirements Requirements Requirements Requirements
Margin + 1% + 2%
Requirements
+ 2% + 3%
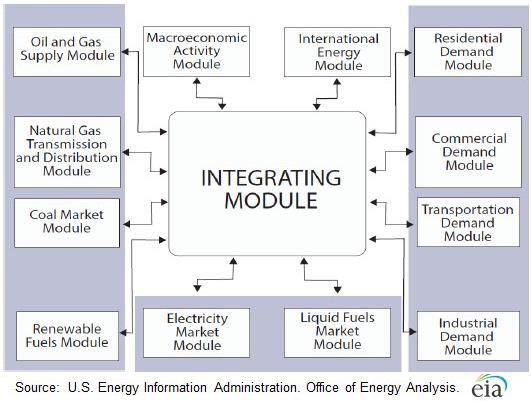
Page 13Market Simulation (National IRP)
Data
Fundamental Data Sources EIA NEMS Model
• EIA 860
• EIA 923
• FERC 714
• EPA NEEDS
• EIA NEMS
• NYMEX
• NREL
• Horizons Energy Research
Integrated Market Model
• Energy Prices • Fuel Prices
• Capacity Prices • REC Prices
• Ancillary Services Prices • Capacity Additions
• Emissions Prices • Capacity Retirements
Page 14National
Database
Hierarchy
Balancing
Authorities
(21)
Balancing Authorities (BA)
are defined as the NERC
Assessment Areas. The
minimum reserve margin is
set for each BA.
M
a
Saskatc ni
hewan to
b IES
a O-
Areas (76)
Ont
M
P ario
I
E S
A O
K -
- S
P N M
M D I
T P
- - S M
N M O I
o N - P S
r M W J O P
t I I M - J
Areas are the zonal pricing points (energy, capacity,
h S S - - MM M
P O U C I I -
M
P - M O S A
I
- I S M O TP
NS A O E - SJ
M IM
AS) within ISOs, RTOs, and the traditional market
EP D I
I - -
P SN
S IS A
- E-
O LE PE
K R RK
- JP
S C CY
M S- M
- -
structures. The transmission limits (energy and
S O EK -
M A
P M RY D
O E
P I C E
- C O
S -
I S K
S O T
M E
o - V
capacity) are defined between the Areas.
I R
u M A A
S C
t I R
O -
h S
- S
O
M O
-
S C
L
O
A
-
T
X
Resources Fuels Emissions Expansion
Grid- Fuel and SO2, NOX, Resources are
connected Fuel Delivery CO2 Emission added
generating Rates; Units economically to
resources identified by maintain
CPP reliability
Page 15From Scenarios to Strategy
External Market Data: Local Market Data: Portfolio Data:
Emissions Caps Demand Requirements Generator Ownership
Transmission Topology Existing Generators Purchase & Sale Contracts
Demand Requirements Fuel Delivery Costs Fuel Contracts
Existing Generators Renewable Requirements Emission Allowances
Fuel Supply & Transportation Construction / Retrofit Alternatives Project Financing
Renewable Requirements
Construction / Retrofits
Market Price Forecasts:
Market Power Portfolio
Simulation Fuel: Coal, Gas, Oil
Emission Allowances
Optimization
Renewable Energy Credits
Page 16National IRP – Status Quo
Page 17National IRP – Scenario 5
Page 18The Portfolio Hand-Off
Proceed with caution.
The input driver assumptions (fuel prices, load,
policy, etc.) and the output results (energy prices,
capacity prices, emission prices, allowance prices,
A/S prices, etc.) are then passed to the Utility's
portfolio model for detailed optimization.
Be sure all of the inputs and
outputs are consistent between
the market model and portfolio
model including time-of-day
data.
Page 19Contact Information
Doug Buresh
Executive Consultant
Indianapolis IN Office
Doug.Buresh@horizons-energy.com
317-564-8343
Greg Turk
Executive Consultant
Columbus OH Office
Greg.Turk@horizons-energy.com
614-553-7816
Page 20You can also read