SEARCH Workshop on Large-Scale Atmosphere/Cryosphere Observations
←
→
Page content transcription
If your browser does not render page correctly, please read the page content below
NOAA OAR Special Report

SEARCH Workshop on Large-Scale
 Atmosphere/Cryosphere Observations

February 2002

                               MOSPH
                          D AT       E
                     AN                  RI
                IC                            C
            N
                                                  AD
       EA

                                                      MI
  OC

                                                       NIS
ONAL

                                                       T R AT I O N

                                                                      Contribution 2452 from NOAA/Pacific Marine Environmental Laboratory
N AT I
  U.

                                                  CE
       S.

                                                  R

            E                                     E
         D

                PA                            M
                     RT                  M
                          MENT OF CO
NOAA OAR Special Report

SEARCH Workshop on Large-Scale
Atmosphere/Cryosphere Observations

Principal Authors:
James Overland
Florence Fetterer
David McGuire
Jackie Richter-Menge
John Walsh

Pacific Marine Environmental Laboratory
7600 Sand Point Way NE
Seattle, WA 98115-6349

February 2002

Contribution 2452 from NOAA/Pacific Marine Environmental Laboratory
NOTICE

Mention of a commercial company or product does not constitute an endorsement by
NOAA/OAR. Use of information from this publication concerning proprietary products
or the tests of such products for publicity or advertising purposes is not authorized.

     Contribution No. 2452 from NOAA/Pacific Marine Environmental Laboratory

        For sale by the National Technical Information Service, 5285 Port Royal Road
                                    Springfield, VA 22161

                                             ii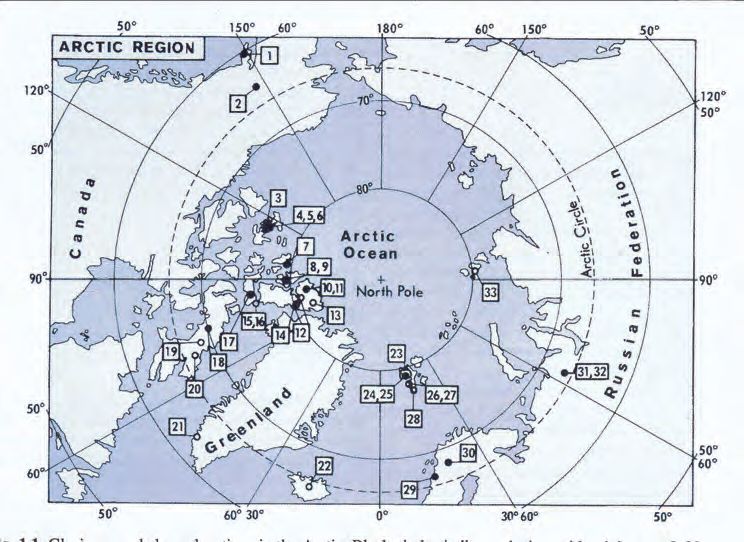
Contents iii
Contents
1. Executive Summary . . . . . . . . . . . . . . . . . . . . . . . . 1
1.1 References . . . . . . . . . . . . . . . . . . . . . . . . . . . . . 4
2. Detection of Arctic Change . . . . . . . . . . . . . . . . . . . 5
2.1 Comparisons of Conceptual Models . . . . . . . . . . . . . . . 5
2.2 Multiple Lines of Evidence . . . . . . . . . . . . . . . . . . . 7
2.3 Impact of Arctic Change on Midlatitude Climate . . . . . . . 8
2.4 References . . . . . . . . . . . . . . . . . . . . . . . . . . . . . 9
3. Atmospheric Observations . . . . . . . . . . . . . . . . . . . . 11
3.1 The Synoptic Observational Network in the Arctic . . . . . . 12
3.2 Satellite Data . . . . . . . . . . . . . . . . . . . . . . . . . . . 14
3.3 International Arctic Buoy Programme . . . . . . . . . . . . . 15
3.4 Cloud and Radiation Data Sets . . . . . . . . . . . . . . . . . 16
3.4.1 Existing data sets . . . . . . . . . . . . . . . . . . . 16
3.4.2 Outlook: The next 5 years . . . . . . . . . . . . . . 19
3.5 Satellite Temperature Sounding Data . . . . . . . . . . . . . 20
3.6 Long-Term Intensive Atmospheric Observing Stations . . . . 23
3.6.1 Rationale . . . . . . . . . . . . . . . . . . . . . . . . 23
3.6.2 Strategy . . . . . . . . . . . . . . . . . . . . . . . . 23
3.6.3 The Barrow, Alaska site . . . . . . . . . . . . . . . . 25
3.7 Data Archives . . . . . . . . . . . . . . . . . . . . . . . . . . . 26
3.7.1 Russian radiation data . . . . . . . . . . . . . . . . 27
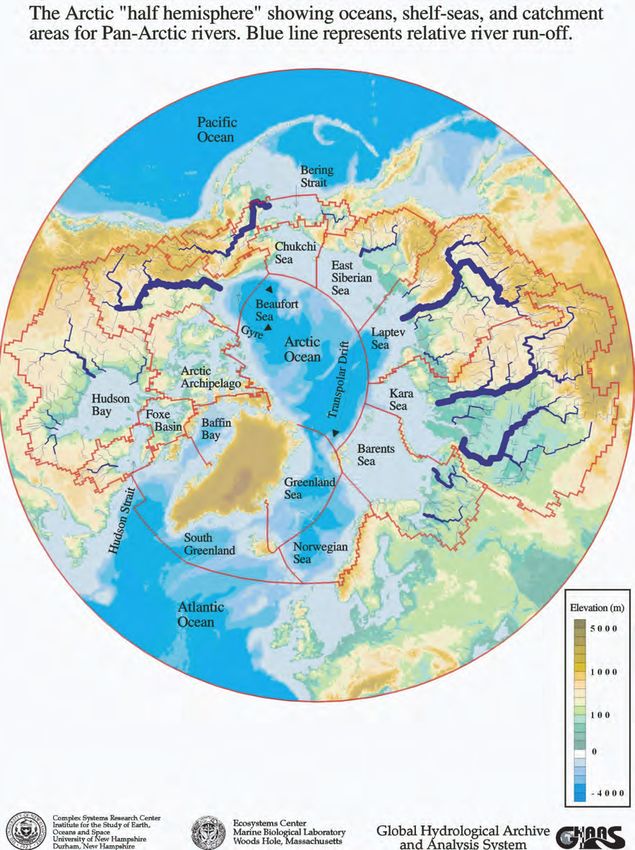
3.7.2 Arctic hydrology network . . . . . . . . . . . . . . . 28
3.8 References . . . . . . . . . . . . . . . . . . . . . . . . . . . . . 28
4. Terrestrial Observations . . . . . . . . . . . . . . . . . . . . . 31
4.1 Introduction . . . . . . . . . . . . . . . . . . . . . . . . . . . 31
4.2 Key Recommendations for Continuing/Enhancing High Lat-
itude Terrestrial Observations . . . . . . . . . . . . . . . . . . 32
4.3 Opportunities for Continuing and Enhancing High Latitude
Terrestrial Observations . . . . . . . . . . . . . . . . . . . . . 37
4.3.1 Land Cover . . . . . . . . . . . . . . . . . . . . . . . 37
4.3.2 Snow Cover . . . . . . . . . . . . . . . . . . . . . . . 38
4.3.3 Soil Thermal Regime . . . . . . . . . . . . . . . . . 38
4.3.4 Glaciers and Ice Sheets . . . . . . . . . . . . . . . . 38
4.3.5 Lakes and Wetlands . . . . . . . . . . . . . . . . . . 38
4.3.6 Hydrology . . . . . . . . . . . . . . . . . . . . . . . 38
4.3.7 Trace Gas Exchanges . . . . . . . . . . . . . . . . . 39
4.4 Review of Information Presented on High Latitude Terrestrial
Observations—Background on Terrestrial Feedbacks Relevant
to the Arctic System . . . . . . . . . . . . . . . . . . . . . . . 39
4.4.1 Land Cover . . . . . . . . . . . . . . . . . . . . . . . 41
4.4.2 Snow Cover . . . . . . . . . . . . . . . . . . . . . . . 44
4.4.3 Soil Thermal Regime . . . . . . . . . . . . . . . . . 44
4.4.4 Glaciers and Ice Sheets . . . . . . . . . . . . . . . . 47
4.4.5 Lakes and Wetlands . . . . . . . . . . . . . . . . . . 48
4.4.6 Hydrology . . . . . . . . . . . . . . . . . . . . . . . 49
4.4.7 Trace Gas Exchanges . . . . . . . . . . . . . . . . . 51
4.5 References . . . . . . . . . . . . . . . . . . . . . . . . . . . . . 54
5. Sea Ice Observations . . . . . . . . . . . . . . . . . . . . . . . 59
5.1 Introduction . . . . . . . . . . . . . . . . . . . . . . . . . . . 59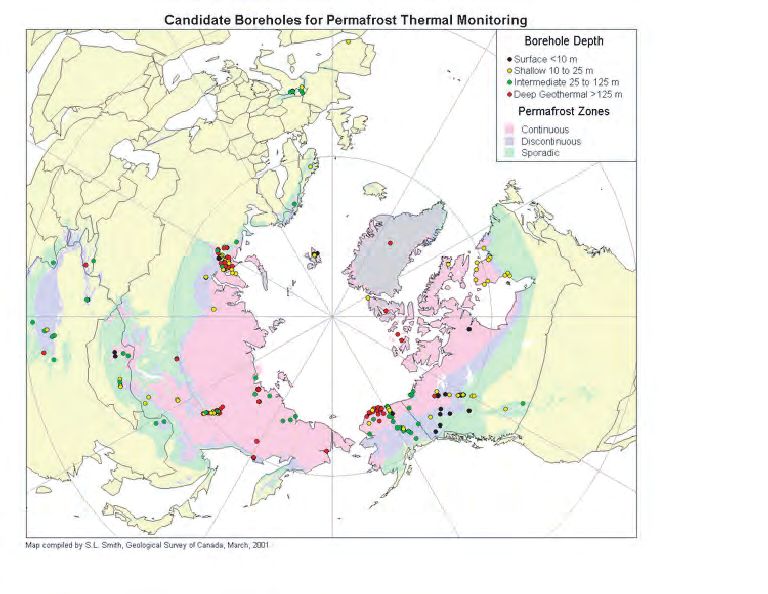
iv                                                                            Contents

           5.2 Recommendations . . . . . . . . . . . . . . . . . . . .        .   .   .   .   59
           5.3 Background . . . . . . . . . . . . . . . . . . . . . . . .     .   .   .   .   60
           5.4 Key Parameters and Current Measurement Techniques              .   .   .   .   62
               5.4.1    Ice extent . . . . . . . . . . . . . . . . . . . .    .   .   .   .   62
               5.4.2    Redistribution . . . . . . . . . . . . . . . . .      .   .   .   .   63
               5.4.3    Export . . . . . . . . . . . . . . . . . . . . .      .   .   .   .   63
               5.4.4    Ice thickness and snow depth . . . . . . . . .        .   .   .   .   63
         5.5   References . . . . . . . . . . . . . . . . . . . . . . . . .   .   .   .   .   67
     6.  An Arctic System Reanalysis . . . . . . . . . . . . . . .            .   .   .       69
         6.1   Summary and Recommendations . . . . . . . . . . . .            .   .   .   .   69
         6.2   Presentation and Discussion Issues . . . . . . . . . . .       .   .   .   .   70
     7.  International Coordination . . . . . . . . . . . . . . . .           .   .   .       76
         7.1   Reference . . . . . . . . . . . . . . . . . . . . . . . . .    .   .   .   .   77
     8.  Acknowledgments . . . . . . . . . . . . . . . . . . . . . .          .   .   .       77
     Appendix A: Agenda . . . . . . . . . . . . . . . . . . . . . . .         .   .   .       79
     Appendix B: Participants . . . . . . . . . . . . . . . . . . . .         .   .   .       81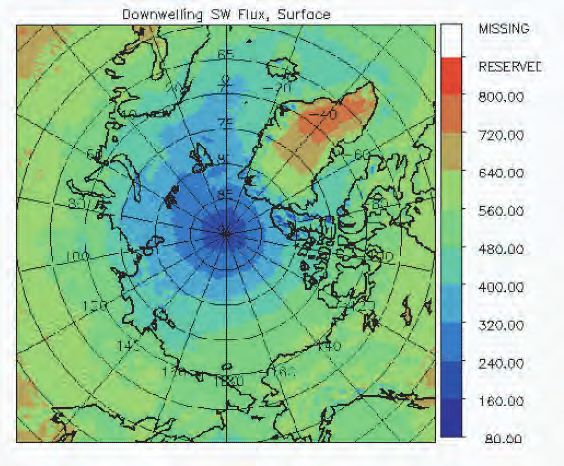
SEARCH Workshop on Large-Scale Atmosphere/Cryosphere
Observations
Principal Authors:
James Overland
Florence Fetterer
David McGuire
Jackie Richter-Menge
John Walsh

1.    Executive Summary
The Arctic environment has undergone significant temperature swings over
the last 100 years. Over the last 30 years trends show surface temperature
warming, melting permafrost, reduced sea-ice, longer growing seasons, and
changes in the character of tundra. These changes are robust, and many
other biological and physical changes are suggested—redistribution of marine
populations, unusually cold stratospheric temperatures, changes in Icelandic
and Aleutian midlatitude storm tracks, and shifts in ocean circulation. The
Study of Environmental Arctic Change (SEARCH) is based on the principle
that this complex suite of atmospheric, oceanic, and terrestrial changes are
interrelated, with impacts on ecosystems and society.1 It is important to
recognize that these events have already occurred or are under way, and
that it is desirable to anticipate their future course or at least assess their
potential range.
    A major task for SEARCH is to determine how existing observation sys-
tems can be best used and enhanced to understand and anticipate the course
of the ongoing changes in the Arctic. The purpose of the workshop held in
Seattle during 27–29 November 2001 was to review existing land, sea ice,
and atmospheric observations and the prospect for an Arctic System Re-
analysis, through white papers, invited speakers, and panels.2 Assessment
of the equally important areas of paleo-environmental, biological, ocean, and
human observations were beyond the scope of this effort and are the focus
of a future summary. Sixty-eight scientists participated (Appendix B), and
reviews of the areas addressed form the major chapters of this report. Future
efforts across a broad spectrum of disciplines will be accomplished through
the SEARCH Panel on Detection/Observations.
    The primary workshop conclusion is that there is no cohesion among
various Arctic disciplines and data types to form a complete observation set
of Arctic change. This situation results from several factors. Many rou-
tine observations were not designed specifically for climate studies. Many
research studies are of limited duration at diverse and uncoordinated loca-
tions. Temporal intercalibration is lacking between data sets due to changes
   1
     Serreze et al., 2000; SEARCH Science Plan, 2001, http://psc.apl.washington.
edu/search; Unaami website: http://www.unaami.noaa.gov
   2
     Agenda—Appendix A, website http://www.epic.noaa.gov/SEARCH/obs/workshop
2      Principal Authors: Overland, Fetterer, McGuire, Richter-Menge, Walsh

    in instrumentation or satellites. In short, there has been no program like
    SEARCH to promote and support basin-wide, continuous long-term, multi-
    disciplinary data sets in the Arctic.
        A second workshop conclusion is that present data sets are vastly under-
    utilized in understanding Arctic change. Barriers include lack of conceptual
    models for conducting interdisciplinary analyses, data accessibility, various
    data formats, spatial inhomogeneity, and lack of easily applied tools for vi-
    sualization and analysis of multi-disciplinary data. SEARCH can provide
    solutions by harnessing existing methodologies and technologies.
        A third conclusion is that a distributed observing system must accommo-
    date a wide range of spatial patterns of variability. A hypothesis of SEARCH
    is that many Arctic processes, both biological and physical, show Arctic-wide
    covariability, both for individual variables and between variables. Research
    has indicated that even for parameters such as surface temperature, there
    is not one fixed mode of variability and that patterns shift on seasonal and
    decadal scales. This conclusion leads to the following criteria:

         Observations should be pan-Arctic.
         Observations should resolve variability on a scale of 500 km, which is
         typical of meteorological length scales, or different ecosystems.
         Observations should be located in regions of large decadal variability
         and long-term trends; priority should be given to locations with long
         historical records.
         Observations must be multi-variate. Detection and prediction is im-
         proved by using multiple indicators.
         Data from observations must be accessible. This includes future ob-
         servations and making available retrospective data sets.

    The following bullets provide examples of activities that would address the
    first SEARCH workshop conclusion “There is no cohesion among various
    disciplines and data types to form a complete observation set of Arctic change”:

         Advocate for continued quality-controlled data from surface-based and
         satellite weather sensors, permafrost boreholes, glacier and lake moni-
         toring sites, and coordinated runoff measurement activities.
         Make the best use of satellite sensing of vegetation changes supported
         by continuing selected International Tundra Experiment (ITEX) sites
         and IGBP transects.
         Develop a climate quality, four-dimensional temperature data set over
         the Arctic by upgrading the TOVS soundings by bias removal.
         Enhance logistics and sensor suite for the International Arctic Buoy
         Program (IABP).
         Continue to monitor sea ice extent with microwave sensors from satel-
         lite, and use current generation sea ice models and data to design a
         system for direct observations to track changes in ice thickness.
SEARCH Large-Scale Observations Workshop                                                                                         3

    Sfc. temperature trend 1950–96 (C/decade)         AO surface temperature anomalies (C) 1950–96

       -0.9   -0.6   -0.3   0   0.3   0.6   0.9             -1.5   -1.2   -0.9   -0.6   -0.3   0   0.3   0.6   0.9   1.2   1.5

Figure 1.1: A map of 50-year trends of Northern Hemisphere winter temperatures; (right) the regression
of local temperatures on to the wintertime AO index (JISAO website).

     Support the utility of long-term intensive measurement sites, espe-
     cially radiation and chemistry, at Barrow, Alaska, Kiruna, Sweden,
     and Svalbard, with enhanced measurements in northeast Canada and
     Siberia.
     Initiate summaries of biological, oceanographic, and human observa-
     tions. Note the existing Paleoenvironmental Arctic Sciences (PARCS)
     data archive at http://www.ngdc.noaa.gov/paleo/parcs.
     Strengthen international coordination.

The following bullets provide examples of activities that would address the
second workshop conclusion, “Present data are vastly underutilized in un-
derstanding Arctic change”:

     Initiate a high-resolution Arctic System Reanalysis.
     Develop a protocol for detection of Arctic change.
     Develop multiple lines of evidence for change and make evidence avail-
     able at a single website location.
     Support gridding and time intercalibration of satellite products for the
     Arctic.
     Support standards for data sets and metadata to readily permit timely
     sharing of information and enhance multidisciplinary analyses.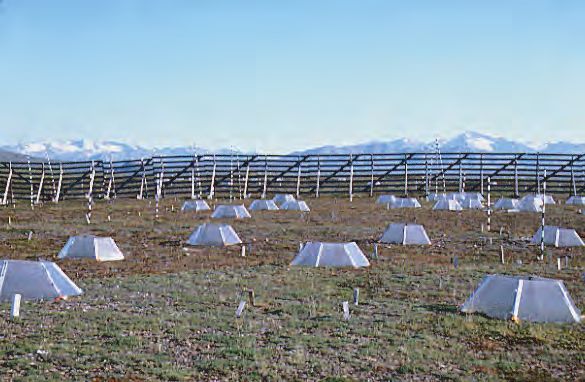
4         Principal Authors: Overland, Fetterer, McGuire, Richter-Menge, Walsh

    As an example of the third workshop conclusion, that “A distributed observ-
    ing system must accommodate a wide range of spatial patterns of variabil-
    ity,” Fig. 1.1 (left) shows the map of wintertime temperature trends for the
    Northern hemisphere for the previous 50 years. There is large-scale spatial
    covariability, with warming trends over eastern Siberia and northwestern
    North America, and cooling over NE Canada and, to some degree, west of
    Bering Strait. To the right is shown the regression of temperatures at each
    location onto the Arctic Oscillation (AO), an index of northern hemisphere
    atmospheric circulation. The temperature pattern for the AO is similar to
    the 50-year trend in NE Canada and eastern Siberia, but there are differ-
    ences: the AO has a stronger response in Scandinavia, and the cold region
    near Bering Strait now extends over Alaska. Eastern and midwest North
    America now shows warming. Even for surface temperatures there is not
    one fixed mode of variability; indeed these patterns shift on seasonal and
    decadal scales (Overland et al., 2002).

    1.1     References
    Overland, J.E., M. Wang, and N.A. Bond (2002): On the recent temperature
        changes in the western Arctic during spring. J. Climate, 15, in press.
    SEARCH Science Plan (2001): available at http://psc.apl.washington.edu/
        search/
    Serreze, M.C., and coauthors (2000): Observational evidence of recent change in
        the northern high latitude environment. Clim. Change, 46, 159–207.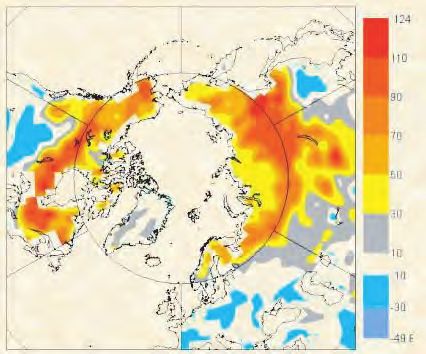
SEARCH Large-Scale Observations Workshop                                         5

2.      Detection of Arctic Change
One of the goals of SEARCH is to project the future course of the recent and
ongoing decadal (e.g., 3–50 year), pan-Arctic complex of interrelated changes
in the Arctic. A major suggestion at the workshop was that SEARCH would
be well served by further developing the definition of detection of Arctic
change. Change in the Arctic is multivariate and understanding the in-
terrelation of the parts is a goal of SEARCH. Nevertheless, developing an
operational definition would:
     1. Help refine SEARCH hypotheses,

     2. Aid in prioritizing an observational system, and

     3. Improve communication of SEARCH results.
Therefore, a recommendation of the workshop is:
       Develop a protocol for detection of Arctic change.
    In review of the literature (Klein, 1990; Risbey et al., 2000) on multi-
disciplinary projects of large scope, credibility of the process is a major
feature and is enhanced through quality control of the components, repro-
ducibility of the analyses, stating uncertainties, clarity and transparency,
without sacrificing the recognition of the underlying complexity of the sys-
tem. Such procedures are promoted through formal methods, which develop
alternate quantifiable metrics for specifying historical change and future de-
tection. Because of the existence of different lines of evidence for Arctic
change over the last 30 years, SEARCH is a candidate for a comparative
approach to interdisciplinary studies.
    “Detection” as used by SEARCH has a broader context than is used by
the climate change community. For climate change, detection is often used
in a narrow sense that some indicator, such as global surface temperature,
exceeds the range of background noise of natural climate variability (Bar-
nett et al., 1999), i.e., due to anthropogenic and other external factors. For
many ecosystem and societal applications of SEARCH, it is important to
understand the ongoing changes in the Arctic, whether they are natural or
external. Several authors have argued that external change will amplify or
change the frequency of occurrence of natural large-scale patterns of vari-
ability (Palmer, 1999); this remains to be shown in the Arctic.
    In this section, we do not develop a protocol. This should be an early
activity of the SEARCH panel on detection/observations. We provide three
examples which more fully develop detection concepts: (1) comparison of
conceptual models of Arctic variability, (2) the use of multiple lines of evi-
dence, and (3) selection of robust indicators for the impact of Arctic change
on midlatitude climates.

2.1     Comparisons of Conceptual Models
The mean annual surface temperatures for the northern hemisphere in the
20th century increased until about 1940, slightly decreased until the early
6 Principal Authors: Overland, Fetterer, McGuire, Richter-Menge, Walsh
Simulated annual global mean surface
Vorticity Index temperatures with all the forcings
1.0
0.3 model
Temperature Anomalies C
observations
0.2 0.5
0.1
0.0 0.0
-0.1
0.5
-0.2
-0.3
1.0
1950 1960 1970 1980 1990 1850 1900 Year 1950 2000
Polyakov & Johnson, 2000 Stott, et al. 2001
Greenland Sea Greenland Sea
Ice Anomaly
Ice Anomaly
1900 1910 1920 1930 1940 1950 1960 1970 1980 1990 2000 1900 1910 1920 1930 1940 1950 1960 1970 1980 1990 2000
Venegas & Mysak, 2000
Figure 2.1: Recent trends of Arctic data. The upper left panel shows shifts in an Arctic atmospheric
circulation index, based on vorticity. The lower panel shows changes in Greenland Sea ice anomalies (right)
broken down into four different frequency components (left). The upper right panel shows modeled and
observed global temperature changes over the last century.
1970s, and increased through 2000. Changes in the Arctic mirrored the
northern hemisphere with, perhaps, a greater relative increase in the 1930s.
These temperature changes are reflected in other variables such as the
strength of the polar vortex and ice extent. The upper left panel in Fig. 2.1
from Polyakov and Johnson (2000) shows both a decadal scale variability as-
sociated with the Arctic Oscillation (AO) and a 60–80-year Low Frequency
Oscillation (LFO). Because the LFO and AO both have a positive phase in
the 1990s, these authors suggest that a forward projection of these two os-
cillations would predict a major temperature reversal in 2000–2020; we can
call this the extrapolation model. The Greenland Sea ice record (Fig. 2.1,
bottom right) was decomposed by Venegas and Mysak (2000) into four fre-
quency bands (Fig. 2.1, bottom left). The sum of their low frequency and
decadal oscillations also show a minimum ice area in the 1990s, with a pro-
jection for increases after this minimum.
An alternative model comes from the Global Climate Model (GCM) hind-
cast for the 20th century completed for Intergovernmental Panel on Climate
Change (IPCC) (Scott, 2001). The temperature observational record and
an ensemble average of four model runs is shown in Fig. 2.1 (upper right).
These results show the temperature maximum in the late 1940s; the model
attributes this warming to a weak solar radiation influence plus naturalSEARCH Large-Scale Observations Workshop 7
variability in two of the four ensemble runs. However, the models could not
reproduce the dramatic temperature increase in the 1990s without including
increased CO2 forcing in their model. Thus, the IPCC conceptual model
would project increased warming in 2000–2020, after a brief minimum asso-
ciated with the decadal change of the AO. One formal approach to detection
is through the comparison of models. In the two examples we have major
differences in these projections for the next 20 years. What is the evidence
for each approach?
A third default model may also be considered. The previous examples
project an ordered systems response. We can also hypothesize a stochastic
or chaos-like system (Rind 1999; Overland, 2000). There is some sugges-
tion that the northern hemisphere atmosphere system has several alternate
states (Corti et al., 1999). These states can have preferred residence times
and long-memory behavior (Percival et al., 2001), but also suggest that the
system can have regime transitions or shock-like behavior. The large inter-
annual variability of the AO during the previous 4 years (1999–2002) could
suggest that the atmosphere is in a transition between more stable states.
While prediction of a system with this type of climate noise is impossible,
understanding the nature of the low frequency variability would help with
the detection of rapid transitions.
2.2 Multiple Lines of Evidence
SEARCH is based on several recent observed changes in the Arctic which are
robust: declines in sea level pressure, increased surface air temperatures, cold
stratospheric temperatures, decreased sea ice cover, permafrost temperature
increases, longer growing seasons, and changes in the character of tundra.
There are many other less robust physical and ecosystem changes that have
occurred over the previous 30 years in the Arctic.
SEARCH can benefit from a more formal compilation of this information
to address the multivariate aspects of Arctic change. An excellent example is
provided by Hare and Mantua (2000) for the North Pacific. In comparing 100
time series, they show that biological time series were the better indicators
of regime-like behavior in 1976 and 1989 than physical data alone. Physical
data has large interannual and multi-scale variability, while the biological
data acted as a filter on the physical system.
The formal approach examines different lines of evidence. One can in-
vestigate the sources, quality, and quantity of available data. Uncertainties
can be estimated and the signal/noise issue can be addressed individually.
One can reduce the dimension of the system by the selection of relatively
independent lines of evidence versus those subsets which covary in time or
have similar spatial patterns. The process can be transparent and several
approaches can be taken for detection. For example, the time series can
be combined into a single attribution, with greater confidence than for any
individual variable. Alternatively, each series can be tested separately, and
detection can be based on categories, such as “most” of the evidence, the
“balance” of the evidence, or “some” of the evidence depending on the num-
ber of series which pass a given detection criteria.8 Principal Authors: Overland, Fetterer, McGuire, Richter-Menge, Walsh
http://www.unaami.noaa.gov
Figure 2.2: A sample from a data collection web site for 85 Arctic time series sorted by location and data
type.
Figure 2.2 shows a data collection for the Arctic of 85 time series divided
into seven categories: fisheries, biology, terrestrial, sea ice, ocean, atmo-
sphere, and climate indices (http://www.unaami.noaa.gov). These data
were chosen to span the years 1975–1995. The number of long time series
drops off significantly before this time. Longer time series of a century or
more are available; sea ice extents and air temperatures are an example as
discussed by R. Colony at the workshop. Such expanded data collections
should form the basis of understanding the covariability and independence
of Arctic change.
2.3 Impact of Arctic Change on Midlatitude Climate
At the workshop, Mike Wallace (Thompson et al., 2001) made a presenta-
tion which shows an example of research driven by a potential application.
Thompson et al. noted the number of days during winter when 14 cities had
extreme cold temperatures, colder than 1.5 of the standard deviation from
the mean value (Table 2.1). They sorted this data into those days afterSEARCH Large-Scale Observations Workshop 9
Table 2.1: Number of days of cold temperatures which follow a weak vortex (neg-
ative AO) versus a strong vortex (positive AO).
Weak vortex: Strong vortex:
–1.5 std. temperature threshold Total days +1–60 days +1–60
< −17◦ C in Juneau, AK 334 104 66
< −18◦ C in Chicago, IL 411 149 67
< −6◦ C in Atlanta, GA 416 149 73
< −10◦ C in Washington, D.C. 392 153 77
< −9◦ C in New York, NY 403 164 99
< −1◦ C in London, UK 442 157 77
< −3◦ C in Paris, France 446 148 68
< −9◦ C in Stockholm, Sweden 348 154 54
< −9◦ C in Berlin, Germany 450 142 77
< −22◦ C in St. Petersburg, Russia 381 137 46
< −20◦ C in Moscow, Russia 472 152 80
< −29◦ C in Novosibirsk, Russia 480 155 69
< −4◦ C in Shanghai, China 471 170 84
< −1◦ C in Tokyo, Japan 328 130 60
Thompson et al., 2002
the atmosphere shifted to a weak vortex (negative AO) and a strong vortex
(positive AO). The negative phase of the AO has a more north-south wave-
like character compared to the positive AO with a more west-east (zonal)
character. The number of cold days associated with a weak vortex were
about double the number associated with the strong vortex. They further
showed that the magnitude of the change was about 3 degrees over northern
midlatitudes, about the same magnitude as the influence of a shift from El
Niño to La Niña. Thus, by focusing on extreme events rather than mean
values, these authors demonstrated a practical midlatitude influence of the
AO.
2.4 References
Barnett, T., and coauthors (1999): Detection and attribution of recent climate
change: A status report. Bull. Am. Meteorol. Soc., 80, 2631–2659.
Corti, S., F. Moltieni, and T.N. Palmer (1999): Signature of recent climate changes
in frequencies of natural atmospheric circulation regimes. Nature, 398, 799–802.
Klein, J. (1990): Interdisciplinarity: History, Theory, and Practice. Wayne State
University Press, Detroit, MI, 331 pp.
Overland, J.E., J.M. Adams, and H.O. Mofjeld (2000): Chaos in the North Pacific:
Spatial modes and temporal irregularity. Progress Oceanogr., 47, 337–354.
Percival, D.B., J.E. Overland, and H.O. Mofjeld (2001): Interpretation of North
Pacific variability as a short- and long-memory process. J. Climate, 14, 4545–
4559.
Polyakov, I., and M.A. Johnson (2000): Arctic decadal and interdecadal variability.
Geophys. Res. Lett., 27, 4097–4100.
Rind, D. (1999): Complexity and climate. Science, 284, 105–107.
Risbey, J.S., M. Kandlikar, and D. Karoly (2000): A protocol to articulate and
quantify uncertainties in climate change detection and attribution. Climate
Res., 16, 61–78.10 Principal Authors: Overland, Fetterer, McGuire, Richter-Menge, Walsh
Stott, P.A., and coauthors (2001): Attribution of twentieth century temperature
change to natural and anthropogenic causes. Climate Dyn., 17, 1–22.
Thompson, D.W.J., M.P. Baldwin, and J.M. Wallace (2002): Stratospheric connec-
tion to northern hemisphere wintertime weather: Implications for prediction.
J. Climate, 16, in press.
Venegas, S.A., and L.A. Mysak (2000): Is there a dominant timescale of natural
climate variability in the Arctic? J. Climate, 13, 3412–3434.SEARCH Large-Scale Observations Workshop 11
3. Atmospheric Observations
Compiled by James Overland with contributions from Roger Colony, Jennifer
Francis, Barry Goodison, Roy Jenne, Jeff Key, Lawrence Mysak, Steven
Pawson, Ignatius Rigor, Bob Stone, Patrick Sheridan, Russ Schnell, Mike
Wallace, Betsy Weatherhead, Taneil Uttal, and Bernie Zak.
A goal of SEARCH is the development of a distributed observing system
to track Arctic change. This observing system includes both biological
and physical data. The backbone is the World Meteorological Organiza-
tion (WMO) sites, which collect routine weather data, and current and fu-
ture environmental satellites. This information net is primarily designed for
operational, short-term weather forecasting, rather than long-term climate
studies. The operational focus creates potential problems in using the WMO
data to detect changes over decadal time scales. Issues include data accuracy,
ability to detect small changes, the length and continuity of the record, site
changes and urbanization, and changes in instrumentation type and automa-
tion. Arctic scientists share the issue of using WMO and satellite data for cli-
mate purposes with the larger climate community. Such issues are addressed
by the Global Climate Observing System (GCOS) at http://www.wmo.ch/
web/gcos/.
As noted in the Introduction, there are changes in the Arctic that show
large-scale (500 km+) covariability, but there is no one particular spatial pat-
tern of variability. Thus, to explore and potentially project such changes, a
uniform distribution of sites is necessary (300–500 km) which track a variety
of processes. SEARCH provides an Arctic component to the overall global
climate program by providing a focus for Arctic observations and parame-
terization of Arctic processes in climate models. Thus, the recommendations
for atmospheric observations in SEARCH are primarily to augment routine
atmospheric observing systems and for quality control of operational data.
Recommendations
Although the current set of WMO surface observation stations is ade-
quate for SEARCH purposes, we advocate for continuation of quality
measurements, intercomparison of measurements, and support of easily
accessible, current, and archives of value-added data sets. The subset
of GCOS surface network (GSN) stations is not adequate to monitor
the potential spatial variability of Arctic change.
The number of WMO upper air locations is only about 10% of the
number of surface stations; there is no coverage over the central Arctic.
This provides a major data void for SEARCH research. SEARCH
has an opportunity to improve this situation by converting the 22-year
historical TOVS atmospheric temperature sounder data set to climate
quality by bias removal for the Arctic portion of the entire data set.
The International Arctic Buoy Program (IABP) has maintained sea
level pressure observations in the central Arctic since 1979. SEARCH12 Principal Authors: Overland, Fetterer, McGuire, Richter-Menge, Walsh
can support IABP by providing logistics to keep a uniform grid of ob-
servations, and enhancing the sites with additional sensors such as
quality temperatures, radiation, ice thickness, and ocean properties.
SEARCH sees great utility for value-added gridded data sets from satel-
lite data, such as cloud, vegetation, and radiation fields.
Intensive observing sites are located at Barrow and Northern Europe.
Because of the large-scale spatial variability of changes in the Arctic,
it is important to maintain observations at a site in NE Canada with
the same range of observational measurements. Future consideration
should be made for a Siberian site.
Work is required to prioritize integrated data sets for change detection.
3.1 The Synoptic Observational Network in the Arctic
At the workshop, Barry Goodison and Roy Jenne reviewed the meteoro-
logical observation network in the Arctic. The number of surface stations
north of 50◦ N as of 29 October 2001 was 2477 and are shown in Fig. 3.1.
The source of this metadata is WMO Publication No. 9, Volume A, which
contains a complete list of the active surface and upper air weather observ-
ing stations at http://www.wmo.ch/web/ddbs/publicat.html. The pub-
lication is updated every 2–3 months. A second source of data is from
the Global Climate Observing System (GGOS) Surface Network (GSN),
http://www.wmo.ch/web/gcos/gcoshome.html. The GSN is a subset of
989 sites for the globe (244 sites north of 50◦ N) selected for quality, conti-
nuity, and longevity, with a coverage every 500 km. Polyakov et al. (2002)
make use of 49 Arctic stations with data time series longer than 65 years.
Given the large regions of covariability for many variables of Arctic
change as suggested in Fig. 1.1, the WMO Station coverage for tempera-
ture and pressure, and the present archiving by the National Climate Data
Center (NCDC), appear adequate for the requirements of SEARCH histor-
ical analyses and future detection activities. We can make this statement
even with the loss of some stations in the Russian Arctic. It should be
recognized, however, that good spatial coverage of observation sites are an
essential underpinning of research to improve understanding of the climate
system. SEARCH should be concerned about further loss of observation
sites, especially those with long historical time series, and the continuity
and intercalibration within the records.
The large void over the central Arctic ice pack in Fig. 3.1 is covered
through the International Arctic Buoy Program (IABP). Further details will
be provided in Section 3.3. Another source of weather information is the Arc-
tic Climate System Study (ACSYS), Precipitation Data Archive (APDA),
http://dwd.de/research/gpcc/acsys. As of December 1999, they list
Arctic synoptic weather stations as well as a subset of stations sorted by
river catchment areas. They also link to 30 other snow and precipitation
data sources.SEARCH Large-Scale Observations Workshop 13
WMO Publication No. 9 Volume A
90° N
75° N
60° N
2477
45° N
All active Synoptic Stations north of 50 N as of 29 Oct 2001
Figure 3.1: Location of WMO surface observation stations.
The coverage of upper air profiling stations from the WMO web site is
shown in Fig. 3.2. The number of stations is just 10% (238) of the number
of surface stations. The number of stations is particularly low over the high
Arctic (land area) and non-existent over the Arctic Ocean basin. This lack
of coverage is a major problem. One opportunity for upper air data in the
Arctic is through the use of satellite sounder data available since 1980. This
was an operational weather product and needs to be recalibrated as a climate
product. Additional discussion is in Section 3.5.
A method to make the best use of this limited information is through
Reanalysis Projects, such as that undertaken by the NCAR Data Support
Section and the Model Development Group at the National Center for Envi-
ronmental Prediction (NCEP). The NCAR group has developed an extensive
data set with major quality control, duplicate removal, and systematic er-
ror removal. The 110 upper air stations north of 60◦ N and their period
of coverage during the period 1940–1999 are listed on the workshop web
site: http://www.epic.noaa.gov/SEARCH/obs/workshop/reports.shtml
under Roy Jenne. This upper air station data, along with surface reports,
aircraft reports, and some satellite wind and temperature data after 1973,
are used in a 6-hour analysis/forecast cycle using a state-of-the-art weather
forecast model to extrapolate the observations in space and time. The ex-
trapolation is good when there is adequate data coverage upwind of the
region of interest. Lack of coverage remains a problem for the central Arc-
tic. The NCAR/NCEP reanalysis has a nominal resolution of 208 km. The14 Principal Authors: Overland, Fetterer, McGuire, Richter-Menge, Walsh
WMO Publication No. 9 Volume A
90° N
75° N
60° N
238
45° N
All active Upper Air Stations north of 50 N as of 29 Oct 2001
Figure 3.2: Location of WMO upper air observation stations.
model also computes secondary variables which are not measured directly,
such as radiation and moisture fields. Reanalysis fields are available at
http://wesley.wwb.noaa.gov/ncep data/index.html. Thirty-one vari-
ables are available on different atmospheric pressure levels and 62 additional
variables at a single pressure level. Further information on the NCAR pro-
cessed data set is at http://dss.ucar.edu.
3.2 Satellite Data
Satellites provide a spatial and temporal basis for following Arctic change.
A review of satellite and data center issues is provided in a National Re-
search Council (NRC) Report, Enhancing NASA’s Contributions to Polar
Science (J. Walsh and coauthors, 2001). Certainly the Polar Operational
Environmental Satellites with twice daily coverage of visual and IR images
and temperature soundings are basic. MODIS (MODerate resolution Imag-
ing Spectroradiometer) flying on TERRA and to fly on AQUA provides
imaging in 36 spectra bands every 2 days. The future ICESat mission will
provide cloud property information not otherwise available from passive sen-
sors, especially the high ice clouds common over polar areas. It will have an
altimeter to provide information on ice sheets. The Total Ozone Mapping
Spectrometer (TOMS) has provided measurements for most of the period
1978–present.
Key recommendations from the NRC report are:SEARCH Large-Scale Observations Workshop 15
Foster consistency within and among different satellite products.
Develop spatially and temporally coherent geophysical data sets.
Provide emphasis to sensor optimization for polar applications, which
is not now a priority. Clear examples are precipitation estimation and
cloud properties.
Data centers should work toward improvement of tools for analyzing
combined data sets. This includes documentation, temporal consis-
tency, gridding, and format conversions.
3.3 International Arctic Buoy Programme
Ignatius Rigor reported that the International Arctic Buoy Programme
(IABP) has maintained a network of buoys in the Arctic Basin since 1979.
These buoys measure sea level pressure (SLP), surface air temperature (SAT),
and other geophysical quantities. The data are transmitted and collected
through the Argos satellite system. The IABP strives to maintain a network
of at least 25 buoys evenly distributed across the Arctic Ocean. These buoys
have expected life spans of 1 to 2 years, and more than 5000 buoy-months
of data from over 500 buoys have been collected.
The IABP data are used for both operations and research, e.g., fore-
casting weather and ice conditions, validation and forcing of climate models,
validation of satellite data, and for studies of climate change. For operations,
the data are made available to the forecasting community through the Global
Telecommunications System. For research, the data are analyzed at the Po-
lar Science Center of the University of Washington, which also coordinates
the IABP. The data and more information on the IABP can be obtained
from http://IABP.apl.washington.edu/, or from the World Data Center
for Glaciology at the National Snow and Ice Data Center in Colorado.
The success of the IABP depends on maintenance of the buoy network.
The buoys have finite life spans, and a tremendous amount of resources are
required to purchase and deploy buoys. In the past the program was able
to seed the buoy network in the Beaufort Sea and the large gyre circulation
would carry buoys out to cover the Arctic Ocean. However, given the recent
predominance of high AO conditions reducing the Beaufort Gyre, maintain-
ing the buoy array in the east Arctic has been more difficult. Therefore,
an opportunity for SEARCH is to provide increased support for logistics and
continued development of methods for seeding the eastern Arctic. For exam-
ple, Fig. 3.3 shows a recent location of the buoy array, with a particularly
large data void in the central/eastern Arctic.
Given the complex nature of Arctic climate, another SEARCH opportu-
nity is to develop and deploy buoys with more sensors, e.g., CTDs, anemome-
ters, radiometers, and thermistor strings. The cost to attach additional sen-
sors to a buoy is small in comparison to the cost of the logistics to deploy
a buoy, but the benefits to the operational and research communities can
be significant. These additional data are useful in their own right and are
essential for calibrating radiation and GCM models.16 Principal Authors: Overland, Fetterer, McGuire, Richter-Menge, Walsh
International Arctic
International ArcticBuoy
BuoyProgram
Programme
1 March
1 Mar 2002 2002
Argos Buoys
Argos Buoys
Land Stations
Land Stations
IABP Land Stations
26998
Buoys that may have failed since 20020201
26999
26996 12793
12791
24289
9440
9433
5300 9492
9439
9438
9430
94329431
27414 3693 195778063 935794359436
94379434
24291 24292
19579 19578
9359 18921
8056
15524 3311 2419
21077
2159 2416
22206
3692
1222 5311
20857 24294
20858
9360
11257
20859
500 km.
Figure 3.3: Locations of buoys as part of the International Arctic Buoy Program (IABP). Note the data
void in the central Arctic.
3.4 Cloud and Radiation Data Sets
Jeff Key reported that both in situ and satellite-derived cloud and radiation
data sets are available for Arctic climate studies. The following list includes
those that can potentially be used for the detection climate change. It does
not include data sets collected during field experiments or data that do not
constitute a time series. The temporal scales range from hourly to monthly
averages, covering periods up to four decades.
3.4.1 Existing data sets
Baseline Surface Radiation Network (in situ): The Baseline Surface
Radiation Network (BSRN) is a project of the World Climate Research Pro-
gramme with a goal of detecting changes in the earth’s radiation field over
long time scales. BSRN stations in the Arctic are at Barrow, Alaska, and
Spitsbergen, Norway. The Antarctic BSRN stations are Neumayer, Syowa,
and South Pole. All stations measure global, direct, diffuse, and longwave
downward radiation. All but Syowa also measure shortwave and longwave
upward radiation and have 3-hourly synoptic observations. Spitsbergen andSEARCH Large-Scale Observations Workshop 17
Downwelling SW Flux, Surface
MISSING
RESERVED
800.00
720.00
640.00
560.00
480.00
400.00
320.00
240.00
160.00
80.00
Figure 3.4: Downwelling shortwave flux at the surface for the month of June,
averaged over the period 1985–1993, calculated from the AVHRR Polar Pathfinder
data set.
Neumayer have instrument-measured cloud base height. The stations be-
gan measurements as part of the BSRN in 1992 and 1994. On the Web:
http://bsrn.ethz.ch.
Arctic Global Radiation Data Set (in situ): The Arctic Global
Radiation (AGR) data set was compiled from Arctic land stations, ocean
drifting stations, and empirically derived long-term climatological estimates
from earlier Russian studies (Fig. 3.4). The AGR is a two-part data set,
the first being a time series of monthly fluxes covering the region north of
60 degrees latitude. While many of the station time series are short, some
exceed 40 years in length. The second part of the AGR is a long-term
monthly mean gridded climatology for the region north of 65◦ N. On the
Web: http://nsidc.org/data/arcss066.html.
Edited Synoptic Cloud Reports Over the Globe (in situ): Sur-
face synoptic weather reports over the globe for the 10-year period from
December 1981 through November 1991 were processed by C. Hahn, S.
Warren, and others to provide a data set designed for use in cloud anal-
yses. The information in these reports relating to clouds, including the
present weather information, was extracted and put through a series of
quality control checks. With this data set a user can develop a climatol-
ogy for any particular cloud type or group of types, for any geographi-
cal region and any spatial and temporal resolution desired. On the Web:
http://cdiac.esd.ornl.gov/epubs/ndp/ndp026b/ndp026b.htm.
AVHRR Polar Pathfinder (satellite): The AVHRR Polar Pathfinder
composites are a collection of products for both poles, consisting of twice-18 Principal Authors: Overland, Fetterer, McGuire, Richter-Menge, Walsh
Figure 3.5: Locations of data sources in the AGR data set.
daily gridded and calibrated satellite channel data and derived parameters at
a 5 km spatial resolution. Data include five Advanced Very High Resolution
Radiometer (AVHRR) channels, clear sky surface broadband albedo and skin
temperature, viewing and illumination geometries, surface type mask, cloud
mask, and time of acquisition. Data are composited onto two grids per day
based on common local solar times and scan angle. The data set currently
covers the period 1981–1998. The APP data set has been extended to include
cloud properties, surface radiation, and top-of-atmosphere radiation. At
present the years 1982–1993 have been processed. An example is shown
in Fig. 3.5. On the Web: http://nsidc.org/data/nsidc-0066.html and
http://stratus.ssec.wisc.edu/projects/app.
TOVS Path-P (satellite): The TIROS-N Operational Vertical Sound-
er (TOVS) Polar Pathfinder (Path-P) data set consists of gridded daily
Arctic fields of atmospheric temperature, water vapor, skin surface tem-
perature, total effective cloud fraction, cloud top pressure and temperature,
solar zenith elevation, surface pressure, turning angle between geostrophic
wind and surface stress over ice, emissivity, boundary layer stratification,
and the geostrophic drag coefficient. Data are available for the period 1979–
1998 at a resolution of 100 km. An example is shown in Fig. 3.6. On the
Web: http://nsidc.org/data/nsidc-0027.html.
International Satellite Cloud Climatology Project (satellite):
ISCCP was established as part of the World Climate Research Programme
to collect and analyze satellite radiance measurements to infer the global
distribution of clouds, their properties, and their diurnal, seasonal, and in-SEARCH Large-Scale Observations Workshop 19
Figure 3.6: Cloud pressure over the Arctic for 10 April 1996 from the TOVS Path-
P data set.
terannual variations. Variables include cloud amount, cloud optical depth
(daytime), cloud temperature and pressure, cloud phase, surface clear sky
temperature, and visible reflectance. Data are currently available for 1983–
1998 and will ultimately continue through mid-2002. The spatial resolution
of the “D1” (3-hourly) and “D2” (monthly) data sets is 280 km, though a
30 km data set is also available. This is a global product. On the Web:
http://isccp.giss.nasa.gov/products/onlineData.html.
Wisconsin HIRS Cloud Climatology (satellite): The High res-
olution Infrared Sounder (HIRS), part of the TOVS sensor suite, is also
being used to generate a global cloud product at the University of Wis-
consin. Variables include cloud amount, cloud emissivity and transmissiv-
ity, cloud height, and cloud temperature. The data set currently covers a
12-year period from 1989 to the present. The spatial resolution is 2◦ lat-
itude by 3◦ longitude. An example is shown in Fig. 3.7. On the Web:
http://www.ssec.wisc.edu/∼donw.
3.4.2 Outlook: The next 5 years
Some of the data sets described above will be extended to include additional
years. The BSRN network will continue to collect data, the ISCCP data set
will be processed through 2002, the extended APP data set will cover the
years 1994–1998, and the Wisconsin HIRS cloud climatology will continue
indefinitely (a related project will generate a 22-year climatology by mid-
2002). Additionally, there is a possibility that the TOVS Path-P data set
will be used to generate surface shortwave and longwave fluxes, providing
another source of radiation information over a 20-year period. A comparison20 Principal Authors: Overland, Fetterer, McGuire, Richter-Menge, Walsh
Figure 3.7: Global cloud amount for July over the period 1989–1995 from the Wisconsin HIRS Cloud
Climatology project.
of the TOVS-derived surface radiative fluxes to measurements made during
SHEBA is given in Fig. 3.8 (A. Schweiger, personal communication).
3.5 Satellite Temperature Sounding Data
Jennifer Francis reported that the Television Infrared Observation Satel-
lite (TIROS) Operational Vertical Sounder (TOVS) instrument has flown
on NOAA polar-orbiting satellites since 1979 and has collected one of the
longest and most complete satellite data records in existence. It was orig-
inally designed to serve the weather forecasting community by providing
temperature and moisture profiles in regions of the Earth that had few con-
ventional meteorological stations. An example of lower stratospheric temper-
ature anomalies for April months in the 1990s are shown in Fig. 3.9. Further
details are available in several reports by J. Francis at the workshop website.
Data from this sensor have shown potential for a wide range of climate appli-
cations. A problem arises in this context, however, as the radiances were not
adequately calibrated for long-term accuracy, hence substantial biases exist
in data from the various platforms. These biases have several sources, e.g.,
different sensor characteristics on each platform, instrument degradation,
orbital changes, and systematic errors in forward radiative transfer models.
Absolute and relative errors in the radiances reduce the potential value of
TOVS observations for monitoring and understanding climate change.
An opportunity for SEARCH is to address these errors for the Arctic.
Many of the known errors should be regionally and seasonally independent,SEARCH Large-Scale Observations Workshop 21
Figure 3.8: Downwelling longwave (left) and shortwave (right) fluxes computed from the TOVS Path-P
data set (”Parameterized”) and measured at the surface over the SHEBA year.
but we suspect some may be peculiar to or exacerbated in Arctic conditions.
Thus, efforts should be primarily directed to the Arctic to produce a data set
of TOVS radiances with biases minimized. Once this has been completed,
the data should be of value both for geophysical retrievals with sufficient
accuracy to identify changes since 1979, and future changes, as well as for
direct assimilation by numerical atmospheric models for reanalyses.
One would begin by assessing techniques used by other experienced
groups—such as those who produce the NCEP and ECMWF reanalysis data
sets and long-term, global TOVS retrievals—to learn of the successes and
failures of their methods and/or data sets of corrections. A large number
of suitable, high-quality radiosonde profiles would need to be assembled and
matched with satellite observations coincident in space and time. This effort
would involve data rescue, sorting, and evaluating the quality of available
radiosonde data. Large numbers of data are needed so that random errors,
such as in radiosonde measurements and from satellite noise, can be removed
by averaging. By employing one or perhaps two well-characterized (in terms
of their biases in varying atmospheric conditions) forward radiative trans-
fer models, we could calculate from the radiosonde/satellite match-ups the
corrections to TOVS radiances.
Another avenue of effort is to take advantage of periods when two satel-
lites flew simultaneously. Radiances measured in close space and time prox-
imity, as well as the retrievals from these radiances, can be compared to de-
termine relative biases. This method may be particularly effective in polar
regions, as orbits converge in high latitudes, resulting in frequent overpasses
of the same area.
This effort would be an intensive multi-step process that would need to be
performed collaboratively at NOAA/NESDIS, NCEP and other institutions22 Principal Authors: Overland, Fetterer, McGuire, Richter-Menge, Walsh Figure 3.9: An example of temperature anomalies in March for different years based on satellite temperature profiling data.
SEARCH Large-Scale Observations Workshop                                             23

with TOVS expertise. A related but preliminary project is already under-
way at NOAA/NESDIS, which involves rescuing a data set of radiosondes
(so-called DSD5). Additional soundings will be needed from later periods
and for airmass types that are not well represented in the archived data
set. Converting TOVS retrievals from an operational data set to a climate
quality data over the data sparse Arctic areas will be a major tool for direct
study of atmospheric changes and for use in reanalysis projects, especially a
recommended Arctic system reanalysis as part of SEARCH.

3.6     Long-Term Intensive Atmospheric Observing Stations
3.6.1     Rationale
In addition to the distributed and satellite-based observing systems discussed
so far in this section, it is necessary to operate a small number of strategically
placed, long-term, intensive ground-based, atmospheric observing stations
on land with an option for making similar measurement sets on icebreakers,
at ice camps, and at field experiments. The primary purpose of such sites
would be to:

        Make detailed measurements of key parameters over sufficient periods
        to monitor climate change and assess seasonal and decadal climate
        variability

        Support interpretation and validation of satellite data

        Provide measurement suitable for developing new model parameteri-
        zations

        Provide measurements sufficiently detailed to conduct process studies
        to advance fundamental understanding of Arctic atmospheric processes

Taneil Uttal and Bernie Zak commented on this approach.

3.6.2     Strategy
In developing a plan for intensive sites it is necessary to isolate the type, fre-
quency, and accuracy of measurements required, to review existing facilities
and capabilities, and to determine optimum site selection within the logistic
constraints that are likely to be imposed by the Arctic environment.
    Intensive sites would make continuous, long-term measurements of pa-
rameters such as spectral and broadband surface radiation fluxes, surface
albedo, clouds (fraction, vertical distribution, microphysics and optical prop-
erties), aerosols (chemical composition, optical depth, concentration, spa-
tial distributions), Arctic haze, surface sensible heat and latent heat fluxes,
ozone, carbon dioxide greenhouse gases (CO2 , O3 , water vapor, NO2 , CH4 ),
precipitation, and high quality, standard meteorological observations (pres-
sure, temperature, winds, humidity).
    Currently, and historically, sites are operated at Barrow, Alaska and
Kiruna, Sweden, with some observations in NE Canada and Svalbard. Fig-
ure 1.1 (left) shows a map of wintertime temperature trends for the Northern
24 Principal Authors: Overland, Fetterer, McGuire, Richter-Menge, Walsh
160° 180° 160°
140° 140°
60°
Arctic Circle
ALASKA
70°
120° 120°
80°
CANADA
Arctic 100°
100°
Ocean
RUSSIA
80° 80°
GREENLAND
60° 60°
ICELAND
FINLAND
NORWAY
SWEDEN ESTONIA
LATVIA
LITHUANIA
DENMARK BELARUS
UNITED
KINGDOM UKRAINE
POLAND
40° IRELAND
GERMANY
MOLDOVA 40°
20° 0° 20°
0 1000 2000 Miles
0 1000 2000 3000 Kilometres
Figure 3.10: Barrow is the present site of extensive atmospheric measurements.
The present concept would enhance measurements at existing stations, two possi-
bilities being Alert and Svalbard, with eventual development at a third station in
Russia such as Tiksi. Red lines on the figure indicate a flight track for proposed
aircraft sorties which would monitor horizonal variability between stations.
hemisphere for the previous 50 years. There is large-scale spatial covariabil-
ity, with warming trends over eastern Siberia and northwestern North Amer-
ica, and cooling over NE Canada and, to some degree, west of Bering Strait.
Inspection of Fig. 1.1 supports a priority recommendation of the importance
to augment intensive observations in NE Canada. This has been a region
of cooling, which is out of phase with the Barrow and Kiruna. To complete
the array, a location in Russia should be a future consideration.
The observing strategy envisioned is to develop widely distributed, largely
autonomous observing networks in conjunction with embedded, high inten-
sity, manned observing stations at key locations. These observations would
optimally be supplemented with a program of annual aircraft sorties and
ship cruises that are performed on a regular basis from year to year to pro-
vide a measurement of large-scale horizontal variability (Fig. 3.10). TheSEARCH Large-Scale Observations Workshop 25
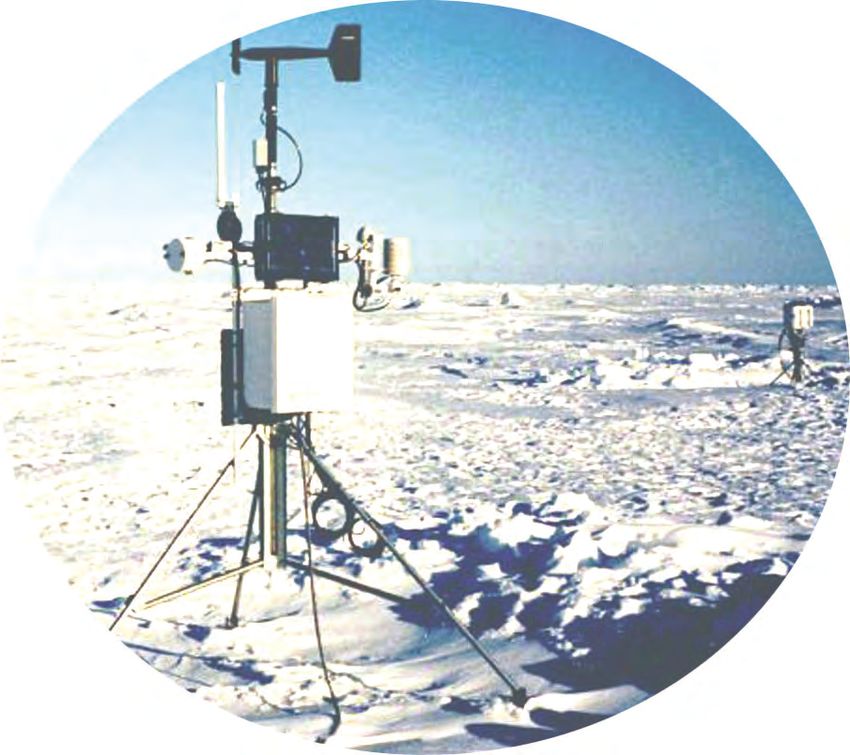
Figure 3.11: Fish eye lens view of the NOAA/CMDL Barrow Observatory.
aircraft and ship would provide a critical link with ocean/ice, satellite and
autonomous network observing programs. Finally, it is recommended that
a portable suite of instruments be developed that could be episodically de-
ployed at ice stations, on ice breakers, and in land-based field campaigns to
complement fixed sites. The Barrow, Alaska site is discussed in some detail
in the following section.
3.6.3 The Barrow, Alaska site
The atmospheric measurements being made at the NOAA Climate Moni-
toring and Diagnostics Laboratory (CMDL) Baseline Observatory and the
Department of Energy Cloud Atmospheric Radiation Measurement Program
in Barrow, Alaska represent some of the most technologically advanced and
comprehensive measurements of the clouds, radiation, chemistry, and other
aspects of the physical atmosphere. The Barrow location and its unusually
strong complement of atmospheric sensors is unique not only in the Arctic
but also with respect to comparable stations throughout the world.
The CMDL observatory has the primary goal of monitoring the atmo-
spheric constituents that are capable of forcing climate change and those
that may cause depletion of the global ozone layer. Measurements such as
meteorology, surface ozone, carbon dioxide, aerosols, and radiation began in
1972–1974 and are some of the longest continuous atmospheric records in
the Arctic. Today, over 200 different measurements are conducted at the
Barrow Observatory through 35 cooperative programs (Fig. 3.11).
The DOE ARM North Slope of Alaska (NSA) facility adjacent to the
NOAA site commenced measurements of key radiation and cloud measure-
ments in February 1998. The radiation measurements are made by a number26 Principal Authors: Overland, Fetterer, McGuire, Richter-Menge, Walsh
Ice and Liquid Water Content, Aug 09, 2000
12
TERRA, 29.94
TERRA, 20.99
10
8
Height [km, AGL]
6
4
2
0
10
Tau (LW, absorption)
8
6
4
2
0
0 5 10 15 20
Time (hours, GMT)
0.000 0.003 0.015 0.045 0.100
0.001 0.014 0.064 0.170 0.500
IWC in blues and LWC in reds (mg/m3)
Figure 3.12: Time-height (24 hours, 0–12 km AGL) cross section of radar and radiometer cloud water
content retrievals for a low level all liquid boundary layer cloud at the surface and an all-ice liquid cloud in
the upper atmosphere. TERRA satellite overpass times are indicated in red, NOAA satellite overpasses are
indicated with dashed lines.
of broad-band and spectral sensors, which are complemented by state-of-
the-art cloud measurements from millimeter cloud radar, and micropulse
lidar. By combining measurements from these passive and active sensors,
time-height records of detailed cloud properties can be derived which are
important in assessing cloud effects on atmospheric heating profiles and
atmosphere-surface heat and exchanges (Fig. 3.12).
The Barrow station, including a strong history of community support,
serves as a prototype for enhanced atmospheric measurements that would
be highly desirable at other key locations in the circumArctic.
3.7 Data Archives
Florence Fetterer has summarized 24 Arctic data sets in a report at the work-
shop web site, http://www.epic.noaa.gov/SEARCH/obs/workshop/
reports.shtml. These data are available at NCDC, National Snow and
Ice Data Center (NSIDC), and other centers.
SEARCH needs to move beyond logging data sets, which is being handled
well by various data centers, including satellite data at various Distributed
Active Archive Centers (DAACs).You can also read