Semiannual Progress Report - SOMAH - California Distributed ...
←
→
Page content transcription
If your browser does not render page correctly, please read the page content below

Solar on Multifamily
              Affordable Housing

              SOMAH

              Semiannual
              Progress Report

              Reporting period
              January 1, 2021 – June 30, 2021
Semiannual Progress Report: January 1, 2021 – June 30, 2021   1
Table of Contents
1.  Executive Summary ............................................................................................................. 5
  1.1     COVID-19 Acknowledgement ................................................................................ 5
2. Background ......................................................................................................................... 6
  2.1     Application Pathways: Track A and Track B .......................................................... 7
  2.2     Eligibility Options: Qualification Option A — Low-Income and Qualification
  Option B — Disadvantaged Communities ........................................................................... 8
  2.3     Program Budget ....................................................................................................... 8
  2.3.1   Program Administrative Budget .............................................................................. 9
  2.3.2   Program Incentive Budget ...................................................................................... 9
3. Program Progress — Key Performance Areas ................................................................ 13
  3.1     Program Administration ......................................................................................... 13
  3.1.1   Applications and Incentive Statistics .................................................................... 13
  3.1.2   Program Payments ................................................................................................. 33
  3.1.3   Online Bidding Tool ................................................................................................. 35
  3.1.4   California Distributed Generation Statistics ......................................................... 36
  3.2     Marketing, Education and Outreach ................................................................... 37
  3.2.1   2021 ME&O Plan ..................................................................................................... 37
  3.2.2   Evaluation and Surveys .......................................................................................... 37
  3.2.3   Contractors ............................................................................................................. 40
  3.2.4   Property Owners ..................................................................................................... 44
  3.2.5   Tenants ..................................................................................................................... 47
  3.2.6   Other Stakeholders ................................................................................................. 49
  3.3     Workforce Development ....................................................................................... 50
  3.3.1   Job Training ............................................................................................................. 51
  3.4     Technical Assistance .............................................................................................. 54
  3.4.1   Upfront TA ................................................................................................................ 54
  3.4.2   Standard TA ............................................................................................................. 55
4. Program Planning and Development ............................................................................. 57
  4.1     Reporting, Feedback and Accountability Mechanisms .................................... 57
  4.1.1   Public Forums .......................................................................................................... 58
  4.1.2   IOU Working Group ................................................................................................ 58
  4.1.3   SOMAH Advisory Groups ....................................................................................... 58
  4.1.4   Third-Party Program Evaluation ............................................................................. 61
  4.2     Program Design and Updates ............................................................................... 62
  4.2.1   Petition for Modification Regarding Incentive Step-Down ................................ 62
  4.2.2   Program Handbook ................................................................................................ 62
  4.2.3   DAC Participation ................................................................................................... 63

                                       Semiannual Progress Report: January 1, 2021 – June 30, 2021                                           2
5.   Conclusions ........................................................................................................................ 64
6.   Appendix A ........................................................................................................................ 66
7.   Appendix B ......................................................................................................................... 72

                                       Semiannual Progress Report: January 1, 2021 – June 30, 2021                                             3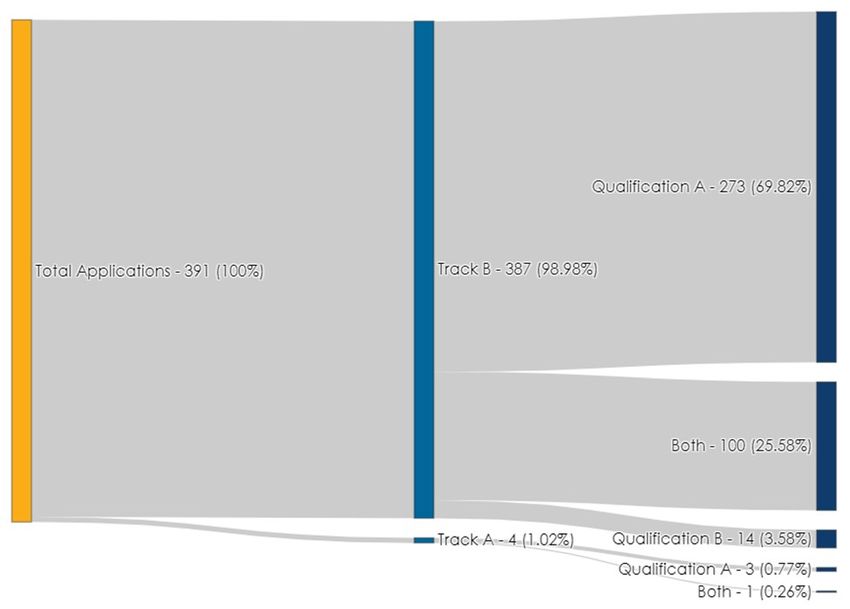
Table of Figures
Figure 1 – Track A and Track B Application Steps ................................................................... 8
Figure 2 – Total Program Administrative Expenditures by Category ..................................... 9
Figure 3 – Project Capacity and Budget ............................................................................... 11
Figure 4 – Cumulative Program Budget ................................................................................. 12
Figure 5 – Application Status by IOU Territory ........................................................................ 13
Figure 6 – Cumulative Applications Received ...................................................................... 14
Figure 7 – Construction Timeline Insights ................................................................................ 16
Figure 8 – Applications by Incentive Track ............................................................................ 18
Figure 9 – Property Eligibility by Incentive Track .................................................................... 19
Figure 10 – Property Eligibility by Reservation Status ............................................................. 20
Figure 11 – Overall Property Eligibility ..................................................................................... 21
Figure 12 – Property Eligibility by Reservation Status ............................................................. 21
Figure 13 – System Ownership Type ........................................................................................ 23
Figure 14 – System Ownership Type by Property Eligibility .................................................... 24
Figure 15 – Application Status by Incentive Track................................................................. 25
Figure 16 – Average System Size (kW) by Reservation Status .............................................. 27
Figure 17 – Average System Size (kW) by IOU Territory ......................................................... 28
Figure 18 – Distribution of System Sizes (kW) ........................................................................... 28
Figure 19 – Progress to 300 MW ............................................................................................... 30
Figure 20 – Percent of Program MW by Reservation Type ................................................... 30
Figure 21 – Project Density and Location Visualizations ....................................................... 31
Figure 22 – Eligible SOMAH Properties Map ........................................................................... 32
Figure 23 – Program Payment Statistics .................................................................................. 35
Figure 24 – Number of Completed and Planned Surveys by Category ............................. 38
Figure 25 – Number of Eligible Contractors Over Time ......................................................... 41
Figure 26 – Contractor Statistics .............................................................................................. 42
Figure 27 – Contractor Diversity .............................................................................................. 43
Figure 28 – Subcontractor Statistics ........................................................................................ 44
Figure 29 – Properties Contacted by DAC Status ................................................................. 45
Figure 30 – Property Owner Subscribers Over Time ............................................................... 47
Figure 31 – Projected and Confirmed Job Trainee Count and Metrics.............................. 52
Figure 32 – Track A Reservation Summary ............................................................................. 55
Figure 33 – Standard TA Services Requested......................................................................... 56

                                     Semiannual Progress Report: January 1, 2021 – June 30, 2021                                      4
1. Executive Summary
In the fourth reporting period for SOMAH, the program continued virtual engagement
with stakeholders and program participants to understand and adapt to the impacts of
the COVID-19 public health crisis. Application data continued to track projected
construction timelines, with construction being rescheduled to the end of 2020 and into
2021. Additional funding was released for PG&E, SCE and SDG&E in Q1 and Q2 with
plentiful funding for all IOU territories preventing waitlists in all five territories and allowing
immediate application review. The newest program offering, Progress Payment
Pathway, launched in April with the first progress payment requests submitted later that
month. Marketing, education and outreach (ME&O) efforts continued to focus on
increasing Track A participation, the number of participating projects in disadvantaged
communities (DACs)1 and contractor diversity. With COVID-19 restrictions easing and
local governments focused on post-pandemic economic recovery, the SOMAH ME&O
team intensified its stakeholder outreach, specifically to local governments. The SOMAH
Program Administrator (PA) also revised the Eligible SOMAH Properties Map to make it
more valuable to program participants and stakeholders.

1.1 COVID-19 Acknowledgement
The COVID-19 public health crisis, and the SOMAH PA’s response, continued to impact
the program in this reporting period. With the majority of 2020 affected by the impacts
of the COVID-19 public health crisis, and lingering effects felt in the first half of 2021, the
SOMAH PA continues to acknowledge the impacts to SOMAH participants,
stakeholders and the solar industry. The SOMAH PA understands that the industry will be
affected for some time to come and continues to encourage participants to provide
feedback on the barriers and impacts they are facing. Despite these impacts, the
program has continued to see projects progress with their design, construction and
interconnection efforts. The SOMAH PA maintains a dedicated webpage,
CalSOMAH.org/COVID19, to provide the most up-to-date program information and
resources on this topic. The SOMAH PA remains committed to prioritizing health and

1 Disadvantaged communities for the SOMAH program are currently defined as census tracts scoring in the
top 25% statewide on the CalEnviroScreen 3.0 map. Properties located in one of 22 additional census tracts
that are in the top 5% of pollution burden but that do not have an overall CalEnviroScreen score because
of unreliable socioeconomic data are also eligible.

                              Semiannual Progress Report: January 1, 2021 – June 30, 2021                    5
safety during this time, while working to advance the goals of the SOMAH program and
help build a resilient California.

2. Background
The Solar on Multifamily Affordable Housing (SOMAH) program provides financial
incentives for installing photovoltaic (PV) energy systems on multifamily affordable
housing. The program is designed to deliver clean power and credits on energy bills to
hundreds of thousands of California’s affordable housing residents. The program was
created by California Assembly Bill (AB) 693 (Stats. 2015, Ch. 582), authored by State
Senator Susan Talamantes Eggman (D-District 05) (then Assemblymember) and signed
by Governor Jerry Brown in 2015. Senate Bill (SB) 92 (Stats. 2017, Ch. 26), adopted with
the 2017-18 State Budget, further clarified the budget for the program. California Public
Utilities Commission (CPUC) Decision (D.)17-12-022 (effective Dec. 14, 2017)
implemented AB 693 and changed the name of the program to the Solar on Multifamily
Affordable Housing (SOMAH) program to distinguish it from other state clean energy
and low-income solar programs. D.17-12-022 established the program’s budget,
incentive structure and eligibility policies, among other items.

The SOMAH program serves utility and community choice aggregator (CCA) customers
in the territories of Pacific Gas and Electric Company (PG&E), Southern California Edison
Company (SCE), San Diego Gas & Electric Company (SDG&E), Liberty Utilities Company
and PacifiCorp. Funded through greenhouse gas (GHG) allowance auction proceeds,
SOMAH has a program budget of up to $100 million annually for 10 years and an overall
target to install at least 300 megawatts (MW) of generating capacity by 2030.

The program is determined to be transparent and accountable to the communities it
serves. It is administered by a team of nonprofit organizations that provides a host of no-
cost services to maximize participation and community benefit. These services include
comprehensive technical assistance for property owners and contractors, tenant
education resources and job training opportunities. A community advisory council
provides input into program implementation and helps ensure the program maximizes
benefits to the communities it is designed to serve. The SOMAH program is jointly
administered by the Association for Energy Affordability, Center for Sustainable Energy®
and GRID Alternatives, in collaboration with the California Housing Partnership and
Rising Sun Center for Opportunity. The SOMAH program is overseen by the California
Public Utilities Commission (CPUC).

                          Semiannual Progress Report: January 1, 2021 – June 30, 2021         6
2.1 Application Pathways: Track A and Track B
The SOMAH program is designed to accommodate participation at varying stages of a
solar PV installation, ranging from initial property owner engagement and assessment of
a property’s solar installation capacity to projects for which the contractor has already
been selected or installations that are underway or recently completed. There are two
tracks to apply for a SOMAH incentive: Track A and Track B. The SOMAH PA designed
the program with two incentive track choices to tailor the user experience based on
the stage of a project, i.e., whether the program participant is just starting their journey
with going solar, has a shovel-ready project or has recently completed the installation.
Both tracks provide fixed, capacity-based incentives for qualifying solar energy systems,
using the Expected Performance Based Buydown (EPBB)2 methodology.
Track A is designed for property owners who receive direct program marketing and
outreach from the SOMAH PA and its network of community-based organization (CBO)
partners. Track A provides upfront technical assistance (TA) services for property owners
to supply them with a well-rounded understanding of their property’s energy needs and
the educational, technical and financial resources that are available to facilitate
valuable energy efficiency upgrades and a solar installation. Participants that select
Track A will have their incentive funding earmarked for the duration of the three-month
upfront TA period, prior to a reservation request. Track A participants typically do not
have an identified contractor and are guided through a multiple bid process to select
an eligible solar contractor for their project. The SOMAH PA has recently noted
instances of an owner opting to withdraw from Track A to reapply as Track B after
receiving TA services, ahead of the multiple bid process, and will continue working with
owners to tailor their experience to support the successful participation of each project,
regardless of application track
Track B is designed for property owners who receive direct program marketing and
outreach from an eligible contractor, project developer or similar entity. Projects in this
track have already identified an eligible solar contractor who has already performed or
will provide the client assessment and design services that may include a solar site
assessment, initial design, financing options review, contract review, etc. Projects that
select Track B are not eligible for upfront TA and may waive the requirement to
participate in the multiple bid process by submitting the Multiple Bid Waiver with the
2EPBB incentives are based on the system’s capacity and design, which provide an estimate of the
system's future performance.
Semiannual Progress Report: January 1, 2021 – June 30, 2021 7Reservation Request Package. Instead of upfront TA, Track B projects are eligible for
standard TA, which is further described in Section 3.4.
For Track A and B projects, incentive funding will be reserved for 18 months based on
the date the Reservation Approval Notice is issued.
The following figure shows the application steps for Track A and Track B.
Figure 1 – Track A and Track B Application Steps
2.2 Eligibility Options: Qualification Option A — Low-Income
and Qualification Option B — Disadvantaged
Communities
Regardless of the application track selected, properties can qualify for the SOMAH
program in one or both ways, known as Qualification Option A and Qualification
Option B. A property may be eligible for SOMAH by meeting the requirements of Option
A, Option B or both. All properties must be at least five units and meet the definition of
deed-restricted, affordable housing in P.U. Code 2852(A)(3)(a)(i) and also meet
Qualification Option A or B. Qualification Option A refers to properties in which at least
80% of the units are reserved for households at or below 60% of the area median
income (AMI), and Qualification Option B refers to properties that are located in a
disadvantaged community (DAC) as identified by CalEnviroScreen and CalEPA.
Section 3.1.1, Applications and Incentive Statistics, further elaborates on each type of
the qualification options for the SOMAH program.
2.3 Program Budget
SOMAH has a program budget of up to $100 million annually, with at least 90% of the
funds allocated to incentives and up to 10% allocated to the administrative budget. To
Semiannual Progress Report: January 1, 2021 – June 30, 2021 8ensure transparency for program stakeholders, the SOMAH PA compiles and submits a
Semiannual Expense Report (SAER). The SAER tracks expenditures by category, totaling
program incentives and administration expenses incurred by the SOMAH PA, CPUC
Energy Division (ED) and the investor-owned utilities (IOUs). The SAER is posted twice a
year to the California Distributed Generation Statistics website in conjunction with this
Semiannual Progress Report.
2.3.1 Program Administrative Budget
The administrative budget is shared by the SOMAH PA, CPUC ED and the IOUs. The
SOMAH PA tracks the program expenses in four main categories: SOMAH Program
Administration; Marketing, Education & Outreach (ME&O); Technical Assistance; and
Workforce Development. Figure 2 provides a snapshot from the SAER and outlines total
program administrative expenditures through June 30, 2021.
Figure 2 – Total Program Administrative Expenditures by Category
Category
Investor-owned Utility (IOU) Expenses $3,401,006.34
SOMAH California Public Utilities Commission (CPUC) Expenditures $499,483.43
SOMAH Marketing, Education & Outreach (ME&O) $5,535,870.49
SOMAH Program Administration $11,175,749.33
SOMAH Technical Assistance $524,863.68
SOMAH Workforce Development $1,039,952.82
Total $22,176,926.09
More detailed expenditure information can be found at
https://www.californiadgstats.ca.gov/programs/#_subsection_17.
2.3.2 Program Incentive Budget
The SOMAH PA publishes updated program incentive budget information for each IOU
territory to the California Distributed Generation Statistics website on a weekly basis.
Because each IOU territory’s annual incentive budget varies based on their specific
GHG allowance auction proceeds, the SOMAH PA maintains five individual reservation
queues and up to five waitlist queues, when applicable. Collections for each funding
cycle are expected to be available in Q1 (PG&E, SCE and SDG&E) and Q2 (Liberty and
PacifiCorp). The funds for each utility territory may be released at different times, with
the collections based on each utility’s Energy Resource Recovery Account (ERRA) or
Energy Cost Adjustment Clause (ECAC). PG&E and PacifiCorp funding will be released
quarterly versus the annual lump sum release of the other territories.
Semiannual Progress Report: January 1, 2021 – June 30, 2021 9In Q3 2020, the SOMAH PA refreshed the format of Table 2: Cumulative Program Budget
on California Distributed Generation Statistics with clarification of the annual budget
years/collection period and an additional column for the funds allocated through the
under-collection true-up process where the IOUs were directed to set aside additional
funding in their 2020 ERRA and ECAC Applications to make up for under-collections in
the 2016-2019 program years. A summary of funding releases for the first half of 2021
includes the following territories and dates: PG&E (2/24 and 6/7) and SCE and SDG&E
(2/24). Figure 3 summarizes the committed and remaining budget for the SOMAH
program. Figure 4 summarizes the program dollars collected by fiscal year to date and
identifies application totals and available program funds.
Semiannual Progress Report: January 1, 2021 – June 30, 2021 10Figure 3 – Project Capacity and Budget
Waitlist Earmarked Pending Reservation Reserved Completed Application Totals
Total Remaining
Capacity Budget Capacity Budget Capacity Budget Capacity Budget Capacity Budget Capacity Budget
Budget ($) Budget ($)
(MW) ($) (MW) ($) (MW) ($) (MW) ($) (MW) ($) (MW) ($)
0.273
Track A 0 0 872,266 0 0 0.118 141,390 0 0 0.391 1,013,656
PG&E Track B 0 0 0 0 8.691 18,086,066 22.782 50,195,869 0.050 126,238 31.523 68,408,173 160,136,731 90,714,902
Total 0 0 0.273 872,266 8.691 18,086,066 22.900 50,337,259 0.050 126,238 31.914 69,421,829
Track A 0 0 0.191 609,851 0 0 0.294 850,901 0 0 0.485 1,460,752
SCE Track B 0 0 0 0 4.793 11,200,713 16.326 35,353,304 0.932 1,636,089 22.051 48,190,106 202,691,059 153,040,201
22.536
Total 0 0 0.191 609,851 4.793 11,200,713 16.620 36,204,205 0.932 1,636,089 49,650,858
Track A N/A N/A N/A N/A N/A N/A N/A N/A N/A N/A 0 0
SDG&E Track B 0 0 0 0 1,871 4,182,997 7.675 16,512,887 0 0 9.546 20,695,884 49,843,974 29,148,090
Total 0 0 0 0 1,871 4,182,997 7.675 16,512,887 0 0 9.546 20,695,884
Track A N/A N/A N/A N/A N/A N/A N/A N/A N/A N/A 0 0
PacifiCorp Track B 0 0 0 0 0.134 259,964 0 0 0 0 0.134 259,964 4,090,312 3,830,348
Total 0 0 0 0 0.134 259,964 0 0 0 0 0.134 259,964
Track A N/A N/A N/A N/A N/A N/A N/A N/A N/A N/A 0 0
Liberty
Track B 0 0 0 0 0.081 166,409 0.088 158,396 0 0 0.169 324,805 1,273,350 948,545
Utilities
Total 0 0 0 0 0.081 166,409 0.088 158,396 0 0 0.169 324,805
Track A 0 0 0.464 1,482,117 0 0 0.412 992,291 0 0 0.876 2,474,408
TOTAL Track B 0 0 0 0 15.570 33,896,149 46.871 102,220,456 0.982 1,762,327 63.423 137,878,932 418,035,426 277,682,086
Total 0 0 0. 464 1,482,117 15.570 33,896,149 47.283 103,212,747 0.982 1,762,327 64.299 140,353,340
Semiannual Progress Report: January 1, 2021 – June 30, 2021 11Figure 4 – Cumulative Program Budget
Under-
2016 2017 2018 2019 2020 2021 Application Total Remaining
collections
Budget ($) Budget ($) Budget ($) Budget ($) Budget ($) Budget ($) Totals ($) Budget ($) Budget ($)
True-up ($)
PG&E 1,740,992 4,359,110 39,330,000 33,963,300 31,620,584 34,898,605 14,224,140 69,421,829 160,136,731 90,714,902
SCE 2,733,251 4,536,250 35,213,205 36,768,272 45,542,591 37,689,090 40,208,400 49,560,858 202,691,059 153,040,201
SDG&E 0 0 9,270,000 9,104,076 11,343,785 10,294,957 9,831,156 20,695,884 49,843,974 29,148,090
PacifiCorp 422,443 961,291 1,009,512 1,150,528 0 546,538 TBD 259,964 4,090,312 3,830,348
Liberty
132,440 258,329 314,706 419,517 0 148,358 TBD 324,805 1,273,350 948,545
Utilities
TOTAL 5,029,126 10,114,980 85,137,423 81,405,693 88,506,960 83,577,548 64,263,696 140,353,340 418,035,426 277,682,086
Semiannual Progress Report: January 1, 2021 – June 30, 2021 123. Program Progress — Key Performance Areas
The overall SOMAH program budget is allocated between incentive budgets and
administrative budgets. The SOMAH PA administrative budget is further tracked through
four categories: Program Administration, ME&O, Workforce Development and Technical
Assistance. The following sections describe progress to date and notable metrics in
each of the four categories.
3.1 Program Administration
The SOMAH program opened on July 1, 2019, which included the opening of the online
application database (PowerClerk) for application submissions, launching the online
bidding tool and commencing the publication of program statistics through the SOMAH
Incentive Budget Report and SOMAH Working Data Set on the California Distributed
Generation Statistics website. The first iteration of the Semiannual Expense Report (SAER)
was submitted on July 31, 2019, and the Semiannual Progress Report (SAPR) on January
31, 2020.
3.1.1 Applications and Incentive Statistics
SOMAH kicked off 2021 with ample funding available in all five IOU territories with a total
remaining budget of nearly $150 million across the program at the close of 2020. Both
SDG&E and PG&E had active waitlists in 2020 but ended the year with a remaining
budget of nearly $7 million and nearly $46 million, respectively. No territory has had a
waitlist since Q4 2020 (SDG&E). The SOMAH PA does not forecast any program waitlists
in the immediate future based on the total amount of available funding along with the
application submission trends thus far in 2021.
Figure 5 – Application Status by IOU Territory
Complete/
Incentive Canceled/
Program Active Paid Waitlist Withdrawn Total
PG&E 212 1 0 71 284
SCE 120 0 0 56 176
SDG&E 55 0 0 25 80
Liberty
2 0 0 0 2
Utilities
PacifiCorp 1 0 0 0 1
Total 390 1 0 152 543
N = 543
Semiannual Progress Report: January 1, 2021 – June 30, 2021 13There are two main ways for previously allocated funds to become available for other
projects. First, a project may be canceled by the SOMAH PA due to missed deadlines or
not meeting program eligibility. Second, incentive funds may become available
through the course of application review. For example, adjustments made to system
size after receiving consumption data from the IOU will affect the reserved incentive
amount. The SOMAH PA has observed that the majority of projects will reduce their
system size after receiving the consumption data during the Reservation Request
Milestone, and therefore, the reserved incentive will be reduced. These previously
allocated funds are then applied to waitlisted projects (when applicable) through an
ongoing reconciliation process by the SOMAH PA. Similarly, the SOMAH PA maintains a
buffer in each territory’s budget to accommodate potential increases in system size
and incentive amount as a result of consumption data from the IOU, anticipated future
load additions, solar sizing tool recommendations or other reasons. Without an easy
method for applicants to retrieve the tenant consumption data before the program
application is submitted for review, additional steps are completed by the SOMAH PA
and the applicant, which typically result in a longer reservation request review timeline.
Figure 6 – Cumulative Applications Received
600
Complete/Incentive Paid, 1 Complete/Incentive Paid, 1
500
152
94
Number of Applications
42
400
15
Canceled/Withdrawn
300 17
Waitlist
Active
200 183 405
380 390
100
117
0
As of 12/30/2019 As of 6/30/2020 As of 12/30/2020 As of 6/30/2021
Semiannual Progress Report: January 1, 2021 – June 30, 2021 14Between January and June 2021, a total of 43 applications were submitted to the
SOMAH program. Of these, 30 new applications were submitted in Q1, and 13 new
applications were submitted in Q2. All 2021 new applications were submitted in two of
the larger IOU territories (PG&E and SCE), and no new projects were received for
SDG&E, PacifiCorp or Liberty. Of the new applications, 74% were submitted to PG&E
and 26% were submitted to SCE. The previous reporting periods included 63 new
applications in July – December 2020, and 120 in January – June 2020. While the 2021
new applications represent a continued interest in the program, the number of new
applications has decreased, and the SOMAH PA is highly motivated to increase
program participation and targeted property types, like DACs, with marketing,
education and outreach (ME&O) efforts through the remainder of the year. More
information about SOMAH’s ME&O efforts is included in Section 3.2, Marketing,
Education and Outreach.
Typically, the SOMAH PA anticipates larger influx of submissions prior to July’s incentive
step-down due the changing incentive rate. With the Energy Division’s approval of the
SOMAH PA’s 120-day extension request, that date has been postponed to October 29,
2021 at the latest, pending publishing of the report by the National Renewable Energy
Laboratory (NREL) to be used for the analysis. As a result, the SOMAH PA now predicts
the previous annual June influx will likely be delayed to later in Q3, closer to the
extended step-down date in October.
In response to recommendations from the Phase 1 Program Evaluation Report (2020),
the SOMAH PA implemented data fields to track reasons for canceled and withdrawn
projects. The SOMAH PA intends to use this information to support follow-up with
property owners on projects that were not feasible or interested at this time but still
eligible for the program. Despite new application submissions, effects of the COVID-19
public health crisis are still impacting application progression. The program also saw an
increase in canceled and withdrawn applications, largely due to voluntary withdrawals.
In the first reporting period of 2021, a total of 57 applications were canceled or
withdrawn, with COVID-19 impacts cited as a common part of the reason why the
project is no longer feasible or of interest. Several applications were also canceled
because they did not meet eligibility criteria for the SOMAH program. A cancellation
reason is recorded when projects are unable to meet their given deadlines in the
application process. The SOMAH PA has extended considerable flexibility and support
to help stakeholders and participants navigate the new environment as a result of
COVID-19. As California begins to reopen, however, the SOMAH PA is working to tighten
up the review process in hopes to keep applications moving forward. As a result,
overdue applications without timely applicant response will face cancellation.
Semiannual Progress Report: January 1, 2021 – June 30, 2021 15From conversations with contractors and property owners in the past 18 months, it is
evident that contractors are continuing to prioritize their portfolios of SOMAH projects
and are eager to move forward with completing installations and interconnections to
finalize projects. Applicants and property owners have given valuable feedback for the
projects that have chosen not to or are unable to move forward with the SOMAH
program after initial application submission. This feedback has helped the SOMAH PA
better address barriers to program participation, which have been supported through
offerings like the EECM Postponement option, discussed later in this section, and the
Progress Payment Pathway, included in Section 3.1.2, Program Payments.
Construction timelines are also important information for the SOMAH PA to track, not
only for the progress of the application queue, but for broader program planning, in
particular project completion. Of the data points collected at the first application
milestone, Reservation Request (RR), the applicant is required to enter the project’s
construction start date or projected construction start date. At the start of each
subsequent milestone, Energy Efficiency Compliance Milestone, Proof of Project
Milestone and Incentive Claim Milestone, applicants are prompted to report if
construction has started or update the projected construction start date if not. The
SOMAH PA also maintains consistent communication with SOMAH contractors with
active applications. This communication with contractors and program applicants,
along with data collection for construction timelines, helps to support forecasting efforts
for program activities as well as tailored project assistance for unique application
situations. Figure 7 is a table of the construction timeline information reported in
applications thus far.
Figure 7 – Construction Timeline Insights
Construction has Projected Construction
Date Commenced Start Date
2019 3 0
Q1 2020 4 0
Q2 2020 0 13
Q3 2020 2 7
Q4 2020 6 97
Q1 2021 0 24
Q2 2021 0 137
Q3 2021 0 73
Q4 2021 0 14
Q1 2022 0 8
Semiannual Progress Report: January 1, 2021 – June 30, 2021 16In previous reporting periods, projects were projecting to start construction primarily in
early 2020, which was largely impacted by the heightened impacts of the COVID-19
public health crisis. As a result, construction timeline projections have continued to shift
through 2020 and into 2021. The SOMAH PA expects that projected construction start
dates will continue to fluctuate through 2021 as projects progress and are better able to
forecast construction timelines with more certainty. Additionally, it is likely that the
public health crisis will continue to have lingering impacts on construction plans and
project timelines. With the country’s plans, and California in particular, focusing on
reopening this summer, the SOMAH PA looks forward to supporting the pipeline of
SOMAH projects that have continued to persevere through uncertainty and unforeseen
obstacles. Updated construction start dates will continue to post as projects continue to
progress to future milestones through their 18-month reservation period. Updated
information will continue to be made available in subsequent progress reports.
At the end of 2020, only five projects had started construction. By the end of Q2 2021,
this number has increased to 15 projects. Taking into consideration the significant
planning and timeline changes projects underwent in 2020 as a result of COVID-19
impacts, the SOMAH PA considers this increase positive and projects a higher trajectory
of growth forthcoming for construction start and completion. This forward movement
also aligns with application progression trends, as many projects have reached the
Proof of Project Milestone, which highlights contract execution and construction start
shortly after if construction has not kicked off at the Proof of Project Milestone already.
The SOMAH PA anticipates that more projects will begin construction as California
continues to lift COVID-related restrictions and projects continue to prioritize completing
PV installations. Most SOMAH projects previously approximated that their respective
construction would begin in Q4 2020. However, most projects are now reporting an
expected start date of Q2 2021, which was the biggest shift in anticipated start dates
for this reporting period. In the previous report, 54 projects expected to start
construction in Q2 2021, and during this reporting period, this number has increased to
137. The SOMAH PA predicts construction timelines to stay in relative flux until
California’s statewide reopening fully unfolds over the summer months but has not seen
significant impacts to the 18-month reservation timelines at this time.
Semiannual Progress Report: January 1, 2021 – June 30, 2021 17Figure 8 – Applications by Incentive Track
Assigned Complete/ Canceled/
Incentive Track Active Incentive Paid Waitlist Withdrawn
Track A 4 0 0 19
Track B 386 1 0 133
N = 543
In Q1 and Q2 2021, a total of 11 Track A applications were submitted; however, 10 of
these projects were canceled. Cancellation reasons varied—some properties were
ineligible at the time of application submission, while others wanted to forgo the
required three-bid process and reapply as a Track B application with their chosen
contractor instead. The property owners for these projects often chose Track A to
explore the multiple bidding platform and to review the multiple bid process before
ultimately deciding to continue the project as a Track B application with contractors
with whom they have existing relationships.
From the Track A applications submitted in 2021, one project has received Track A
approval. This project has requested cancellation; however, as the property owner
decided to continue SOMAH with a contractor with whom they had an existing
relationship. This project will reapply as a Track B application in the near future.
Regardless of application track, the PA is pleased the project will be moving forward
and that the property owner received the support they requested. The SOMAH PA
maintains consistent and transparent communication with property owners as well as
detailed feedback regarding various program requirements. SOMAH’s technical
assistance team and SOMAH’s affordable housing specialists ensure property owners
receive guidance through every part of the Track A application process. Additionally,
ME&O efforts to reach property owners will continue throughout 2021.
Along with the incentive track type (Track A or Track B) differentiating applications, the
eligibility pathway for how the project qualifies for SOMAH is another key distinction for
an application. Projects must satisfy one or both of the following options:
• Qualification Option A: 80% of property residents have incomes at or below 60%
of the area median income as determined by the Department of Housing and
Community Development.
• Qualification Option B: The property is located in a disadvantaged community
(DAC) as identified by the California Environmental Protection Agency.
• Both: The property meets the requirement of 80% of property residents having
incomes at or below 60% of the area median income and is located in a DAC.
Semiannual Progress Report: January 1, 2021 – June 30, 2021 18Figure 9 shows the breakdown between application track and eligibility pathways
during this period of performance.
Figure 9 – Property Eligibility by Incentive Track
Of the 391 active applications3 received, approximately 72% qualified for the program
through Qualification Option A, approximately 3% qualified for the program through
Qualification Option B, and approximately 25% qualified for the program through both
Qualification Option A and Qualification Option B. DAC project participation has
hovered between 25-31% since the program opened in July 2019. The percentage of
active applications located in DACs held steady at 29% of total applications at the
close of this reporting period, and the SOMAH PA continued its efforts to increase
program participation from DACs. At the end of 2020, the SOMAH PA provided the
3Active applications are those that have not been canceled or withdrawn. This figure includes waitlisted
applications as well, which have not had their project information vetted, including their property eligibility
qualification. Waitlisted applications are held in the waitlist status (categorized as Pending Reservation
Approval) and reviewed once funding becomes available to move them off the waitlist.
Semiannual Progress Report: January 1, 2021 – June 30, 2021 19Commissioner’s Office a memo describing potential options for increasing participation
by eligible properties located in DACs and has conducted stakeholder outreach in
2021 to determine the best path forward. In the last reporting period, the Semiannual
Progress Report included a summary of the CPUC DAC Participation Memo. Figure 10
further breaks down the property eligibility statuses by count and percentage to
highlight the number of DAC qualifying properties.4 In 2021, the SOMAH PA will continue
to consider the different ways in which program participation can increase for DAC
qualifying properties.
Figure 10 – Property Eligibility by Reservation Status
Pending Reservation Complete/
Reservation Approval Incentive Canceled/
Property Eligibility Approval Received Paid Waitlist Withdrawn
Qualification A - 80% of
property residents have
incomes at or below 60% of
the area median income as 62 213 1 0 112
determined by the
Department of Housing and
Community Development
Both A and B 15 86 0 0 25
Qualification B - The property is
located in a disadvantaged
community as identified by the 5 9 0 0 13
California Environmental
Protection Agency.
Unknown5 0 0 0 0 2
N = 543
4 DACs are not distributed evenly across the IOU territories. The percentage of census tracts that are DACs
in each IOU territory varies, along with the overlap of eligible properties in a DAC by each IOU territory. The
SOMAH PA does not know of any properties located in DACs in Liberty Utilities or PacifiCorp territories.
5 “Unknown” represents canceled Track A projects that did not submit property eligibility documentation
prior to cancellation.
Semiannual Progress Report: January 1, 2021 – June 30, 2021 20Figure 11 – Overall Property Eligibility
29%
71%
DAC Non-DAC
N=391
Figure 12 – Property Eligibility by Reservation Status
Pending Reservation Approval 24% 76%
Reservation Approval Received 31% 69%
Complete/Incentive Paid 100%
Canceled/Withdrawn 25% 75%
DAC Non-DAC
N=541
Semiannual Progress Report: January 1, 2021 – June 30, 2021 21The Reservation Request Milestone is the first step of the application process for Track B
projects and vets the project’s eligibility to participate in the program. The Reservation
Request Package is a robust and distinguishable milestone for all projects to complete,
with up to eight required documents and an application deposit before achieving
reservation approval. The SOMAH PA maintained a strong focus on application review
progress during this reporting period, with the number of reservation approvals during
this reporting period increased from 191 to 306. Twelve applications are very close to
completing the Reservation Request Milestone, with their document review complete
but currently pending application deposit receipt before final reservation approval. The
majority of active SOMAH applications have moved past the Reservation Request
Milestone and well into the Energy Efficiency Compliance Milestone, the Proof of
Project Milestone and the Incentive Claim Milestone.
The electronic payment options for application deposits continues to be a very popular
option for participants, which is also an asset for the SOMAH PA to streamline the
application deposit processing as the final step in processing reservation approvals. The
electronic payment offering has been extended to progress payments (more
information in Section 3.1.2) and final incentive claim payments as well, with early
participant feedback suggesting a high interest in using electronic payments for
incentives as well.
Not only is reservation approval a significant achievement for an application, it also
signals an important handoff of information between the SOMAH PA and IOUs. Based
on mandates in the CPUC’s Final Decision, the SOMAH PA sends monthly reports to the
IOUs for Energy Savings Assistance Program (ESA) referrals of projects with reservation
approval for each month, as well as a rolling list of all projects with approved
reservations. These reports highlight an important part of data exchange between the
SOMAH PA and IOUs, which encourages program benefits with “warm” ESA leads and
valuable pipeline information for future interconnections from reservation approvals.
The outcome of the monthly reported ESA leads is collected annually in Q4, with
returned data from the IOUs based on completed projects that have received SOMAH
incentives.
Semiannual Progress Report: January 1, 2021 – June 30, 2021 22Figure 13 – System Ownership Type
Solar Lease,
0.26%
21.85%
77.89%
Power Purchase Agreement Host Customer Owned
As shown in Figure 13, the large majority of SOMAH projects (nearly 80%) are third-party
owned (TPO) systems. The largest share of TPO systems are power purchase agreements
(PPAs) or what some contractors term solar service agreements (SSAs). Preliminary
property owner and contractor feedback suggests the third-party ownership option is
more financially feasible for property owners. Additionally, some contractor companies
have preferred system financing/ownership options for their installations, which is a likely
influence on the system ownership breakdown for the current application queue.
Semiannual Progress Report: January 1, 2021 – June 30, 2021 23Figure 14 – System Ownership Type by Property Eligibility
Power Purchase Agreement 28% 72%
Host Customer Owned 34% 66%
Solar Lease 100%
DAC Non-DAC
Figure 14 further segments system ownership types by DAC and non-DAC properties.
While solar leases are exclusively being used for non-DAC properties (less than 1% of
active SOMAH projects as shown above), the split of DAC and non-DAC projects is
relatively similar for host customer owned systems and power purchase agreements.
Additionally, the respective 28% and 34% shares of DAC projects are also similarly
aligned with the number of DAC projects at 29% of the total active SOMAH projects.
Semiannual Progress Report: January 1, 2021 – June 30, 2021 24Figure 15 – Application Status by Incentive Track
See Appendix A for a full list of application statuses and descriptions.
Completing application milestones is an important part of progressing applications and
collection of project data for the program. In the fourth reporting period for SOMAH,
the program now has applications in all stages of the application, construction and
completion processes representing each of the program’s four-milestone application
processes (including the unofficial milestone, Progress Payment Pathway). With
application processing efforts yielding 115 new projects advancing to approved
reservation status, the Reservation Request and Energy Efficiency Compliance
Milestones are important steps in determining project eligibility and the eligible system
size, as they consider consumption history and available energy efficiency upgrades.
Proof of Project Milestone and Incentive Claim Milestone provide information on the
contracted and executed system as well as provide proof of compliance with the
program’s job training and tenant education requirements.
The goal for the Energy Efficiency Compliance Milestone (EECM) is to assess the project
site for energy efficiency opportunities, focusing on reducing site consumption before
producing solar energy at the property. There are two pathways to fulfill the EECM
requirement: Pathway 1 - energy efficiency whole-building walkthrough audit and
Semiannual Progress Report: January 1, 2021 – June 30, 2021 25Pathway 2 - recent or active participation in an approved whole-building energy
upgrade program, documentation of a recent California Tax Credit Allocation
Committee (TCAC) rehabilitation or documentation that the property was completely
constructed under a recent version of Title 24. Pathway 1, whole-building walkthrough
audit, has posed some challenges with the COVID-19 environment. Thus, the SOMAH PA
introduced a postponement option in which projects could enroll to submit the
milestone at either the Proof of Project Milestone or the Incentive Claim Milestone. As of
this reporting period, 148 projects are enrolled in the Energy Efficiency Compliance
Milestone (EECM) Postponement. Currently, there are five active projects that did not
choose to postpone and have their Energy Efficiency Compliance Milestone approved.
To accommodate challenges with completing program requirements due to COVID-19
restrictions, the SOMAH PA introduced the EECM Postponement option in early July
2020. The EECM Postponement option was offered as a temporary program response
allowing projects that have received reservation approval to postpone submitting their
EECM documentation up to submission of the Incentive Claim Milestone. This option was
developed due to challenges with property restrictions creating barriers to complete
the whole-building walkthrough audit and other on-site activities. While a temporary
offering, EECM Postponement was widely used to keep projects active in the program
and progressing further. At the Q2 2021 Public Forum, the SOMAH PA announced an
end to the EECM Postponement option effective September 13, 2021. This timeline is
tied to 90 days after the reopening of California, June 15, 2021. The SOMAH PA will
continue to honor any projects that are approved for EECM Postponement with no
impacts to those project timelines.
Of the projects that have utilized the EECM Postponement option, it has been a mix of
projects choosing to fulfill the EECM requirement at Proof of Project Milestone versus at
Incentive Claim Milestone submission. As more projects advance to these final
milestones and completed status, the SOMAH PA will share additional information on
the frequency that the postponement option was used and when the subsequent
documentation was submitted in future reports.
Looking beyond EECM, there are 106 active projects that have had their Proof of
Project Milestone (PPM) approved. As more projects progress to PPM and beyond, the
SOMAH PA anticipates receiving more information about subcontractors that some
projects are utilizing. This subcontractor information helps to provide further insight on
the diversity of contractors engaging in and benefiting from the SOMAH program.
Currently, one contractor is utilizing subcontractors on seven different applications. In
Semiannual Progress Report: January 1, 2021 – June 30, 2021 26total, there are five separate subcontracting companies that are working to support
completion of these seven different applications.
In this reporting period, six contractors have progressed a portion of their application
portfolios to the Proof of Project Milestone (PPM), Progress Payment Pathway and
Incentive Claim Milestone stages. The SOMAH PA continues to work closely with
contractors to ensure compliance and understanding of the warranty and contracting
program requirements for the documentation submitted at PPM. While the first
completed project, PGE-SOMAH-101, finalized its incentive claim and final payment in
Q4 2020, three additional projects (in SCE territory) have completed incentive claim
and are working through the invoicing and payment process to be issued in Q3. Further
information on completed projects and incentive claim is forthcoming in future reports
as applications continue to progress through their 18-month reservations and ultimate
project completion with incentive payment.
Figure 16 – Average System Size (kW) by Reservation Status
Pending Reservation
Approval
Reservation Approval
Received
201.0 Complete/Incentive Paid
160.7
50.5
N = 389
Validating each project’s system size with aggregated annual electrical consumption
history from IOU data requests is a key step of the reservation request, prior to approval.
Figures 16, 17 and 18 outline system size statistics for the average and largest projects
across the IOU territories.
Semiannual Progress Report: January 1, 2021 – June 30, 2021 27Figure 17 – Average System Size (kW) by IOU Territory
Pending Reservation Complete/
Reservation Approval Incentive Canceled/
Program Approval Received Paid Waitlist Withdrawn
PG&E 168.3 144.2 50.5 0.0 205.5
SCE 338.1 181.1 0.0 0.0 213.1
SDG&E 170.1 174.4 0.0 0.0 191.7
Liberty
81.1 87.6 0.0 0.0 0.0
Utilities
PacifiCorp 134.5 0.0 0.0 0.0 0.0
N = 517
Figure 18 – Distribution of System Sizes (kW)
180
160 153
140
128
120
Number of Systems
100
80
59
60
40 32
20
9
2 2 2 1 0 1
0
PV System Specification CEC Rating (kW)
N = 389
Semiannual Progress Report: January 1, 2021 – June 30, 2021 28From the approved reservations, data shows that projects reduce their system size by
an average of 32% from initial submission. The data has shown a continued trend in the
percent of total system size adjustment between initial application submission and
reservation approval but notes that newer projects (submitted in 2020 and 2021) are
trending with smaller adjustments overall. The SOMAH PA attributes this shift to
contractors evolving experience with the program and availability to assess the project
sites and solar potential prior to submitting the incentive application. While using
standard measurements assumptions like kW/square foot can be helpful starting point,
this trend shows that contractors are using all resources available and taking a real-
world approach to system sizing as projects are developed and compared with site
consumption history by the SOMAH PA. Additionally, the average system cost is
$4.02/watt6 with a total expected aggregate annual output of 110,176,660 kWh7 for the
active SOMAH projects in queue.
6 Project costs are not considered verified until review of the installation contract and associated costs at
the Proof of Project Milestone. The numbers used in this average are estimates reported for the projects
currently in queue and are likely to fluctuate in future reporting periods.
7 Expected aggregated annual output is an estimate based off the PV equipment and system
configuration specifications currently listed for all active applications in PowerClerk. This figure is subject to
change based on updated system designs for projects in queue. System components and configuration
are not verified until the on-site inspection at the Incentive Claim Milestone, which directly impact the
expected output of the PV system.
Semiannual Progress Report: January 1, 2021 – June 30, 2021 29Figure 19 – Progress to 300 MW Figure 20 – Percent of Program MW
by Reservation Type
300 Complete/Incentive Paid,
0.1%
250
25%
Active
200 applications
make up
22% of total
150 program
100 75%
65.6
MWs
50
Pending Reservation Approval
0
Overall MWs Reservation Approval Received
Semiannual Progress Report: January 1, 2021 – June 30, 2021 30Figure 21 – Project Density and Location Visualizations
Figure 21 shows the geographic distribution of property locations for applications received to date. For additional
detail, a closer view is provided for areas of higher density in the San Francisco Bay Area, San Diego and the greater
Los Angeles area.
Semiannual Progress Report: January 1, 2021 – June 30, 2021 31Figure 22 – Eligible SOMAH Properties Map
Semiannual Progress Report: January 1, 2021 – June 30, 2021 32Figure 22 provides a snapshot of the new Eligible SOMAH Properties Map, launched in
March 2021. The map is based on data from the California Housing Partnership’s
Preservation Clearinghouse. It is designed for use by SOMAH participants, generally
solar contractors. The interactive visuals show multifamily affordable housing as well as
current SOMAH applications, allowing users to filter by street address, ZIP code, main
SOMAH eligibility requirements, legislative districts and SOMAH applications. The map
provides color coding based on a property’s location in CalEnviroScreen defined
disadvantaged communities, utility territories, legislative districts and climate zones.
Further edits to the map will be released in Q3-Q4 2021 and will include county-based
breakdowns and a visual overlay of federal congressional districts, as well as
breakdowns of the total property count and percent of active applications based on
filters.
3.1.2 Program Payments
Overview of the Progress Payment Pathway
In spring 2020, solar contractors expressed that the COVID-19 public health crisis was
significantly impacting their business models and access to financing, creating further
barriers to finance projects. The shelter-in-place restrictions had also caused permitting
delays, which further impacted project timelines and exacerbated financing issues by
delaying completion of milestones required for the incentive payment. In response, the
SOMAH PA explored different payment models to help alleviate the cash flow issues the
projects were experiencing. This effort ultimately resulted in what the program offers
today with the two-payment option known as the Progress Payment Pathway, with one
payment equaling 60% of the calculated incentive amount and the remaining
incentive amount issued after incentive claim approval.
While a primary goal of progress payments is to alleviate cash flow issues reported by
participating contractors, progress payments will provide additional benefits to the
program, including dismantling barriers to increase contractor diversity. The
development process of progress payments included PA consultation with program
participants and stakeholders to develop the two-payment pathway for progress
payments with Advice Letter 118-E submission on September 18, 2020. Energy Division
then approved Advice Letter 118-E on December 21, 2020, and the SOMAH PA spent
Q1 2021 focused on preparation to launch progress payments in April 2021. The
program has a dedicated landing page for progress payments and held a topical
webinar on February 25, 2021, to review program requirements and summarize program
reporting and available resources.
Semiannual Progress Report: January 1, 2021 – June 30, 2021 33You can also read