Sentiment Analysis of 21 daysCOVID-19 Indian lockdown tweets - IJARSE
←
→
Page content transcription
If your browser does not render page correctly, please read the page content below
Sentiment Analysis of 21 daysCOVID-19 Indian lockdown
                            tweets
                                   Rupinder Kaur1, Sandeep Ranjan2
       1
        Research Scholar, Computer Science & Engineering, GNA University, Phagwara, Punjab, India
   2
    Assistant Professor, Computer Science & Engineering, GNA University, Phagwara, Punjab, India

ABSTRACT

Novel Corona Virus 2019 disease has changed our lives and interactions. During the COVID-19 global pandemic
lockdown period, users expressed their concerns about the crises via social networks. The study analyzes the
general public’s response towards the COVID-19 preventive 21-day lockdown in Indiafrom25thMarch2020 to 14th
April 2020.The Indian general public actively responded to lockdown related Twitter hashtags both positively and
negatively.The dataset of the lockdown period tweets was analyzed daily to gauge the overall response of the
public.The research identified the most frequently used words and word pairs as the highlights of conversations. The
results of the study conclude that the presence of top negative and top positive words in the dataset can help
understand the psychological state of the general public.

Keywords: COVID-19, Lockdown, Sentiment Analysis, Twitter, Wordcloud

I. INTRODUCTION
           Novel Coronavirus disease or COVID-19has infected about 4.6 million people worldwide as of mid-May,
2020 [1]. Thediseaseoriginating from Wuhan, China,hasaffectedmost of the countries of the world.India, like many
other countries, has imposed a lockdown on its citizens to slowdown the spread of the disease[2].The first complete
lockdown in India was implemented for 21 days starting from 24 th March 2020. People have been restricted to their
homes and those who move out to support essential services are observing strict social distancing norms. Public life
in India, hometo the world’s second-largest population during long lockdown periods has witnessed a lot of changes.
The new social order of self-isolation, quarantine and lockdowns has inspired people to communicate via social
media platforms [3]. The spread of news items and the general public’s response to them has been swift thanks to
the social media platforms.

           Twitter allows its users to share their thoughts, feelings and opinions. The general public often shares
positive and negative reviews on government decisions concerning their life [4].When the Indian Prime Minister,
Mr.NarendraModiannounced the first lockdown of 21 days, the Indian twitter users actively responded to the
trending hashtags like #21daylockdown, #Lockdown21, #CoronaLockdownIndia and #CoronavirusLockdown.

                                                                                                      37 | P a g e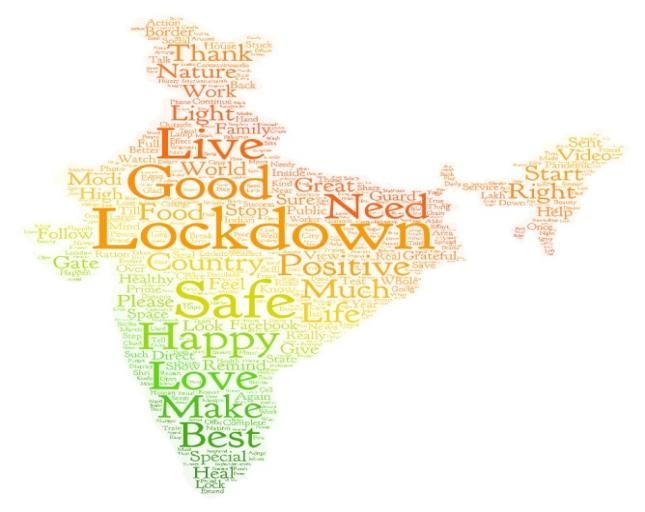
During the lockdown of 21 days, tweets corresponding to these hashtags were mined on a day to day basis and a
cumulative sentiment score was calculated for each day’s dataset.

       The present study has been performed to visualize the daily sentiment score of Indian user’s tweets and to
identify the most influential positive and negative words and word pairs that reflect the overall state of mind of the
people during the 21-day lockdown. This represents the pandemic’s effect on the lives of people and can help the
policymakers in planning their course of action in fighting COVID-19.

II. LITERATURE REVIEW
       Several researchers have tried to gauge the sentiments of citizens by mining their responses on the Twitter
platform [5]. The authors have focused on different initiatives taken by the Indian government to keep the morale of
the public positive.Students and teachers in the Philippines are facing new challenges in the learning processes due
to the COVID19 pandemic[6].The study concluded that most of the students have expressed an inability to keep up
with the new system.

       Sentiment and emotion analysis was performed on the tweets of citizens of the USA and Indiaabout their
leaders [7]. The sentimentsof the Indian citizenswere found to be more positive than that of the citizens of the
USA.Weibo postsreveal about the mental health of the Chinese people during the COVID19 pandemic times [8].The
study used Online Ecological Recognition (OER) for recognition of psychological profileusing various machine
learning predictive models. The study reported a spike in negative emotions and a fall in positive emotions; people
expressed more concern to health and family.

       A study was conducted on the SinaMicroblogto investigate the public response to COVID19 [9]. Collected
data were analyzed using the ROST Content Mining System for sentiment analysis. Changes in trends in public
responses were reported which can help the government in public policymaking.Sentiment analysis of the tweets of
citizens of twelve countries about theCOVID19 pandemicrevealed that there was a high positive sentiment from
Belgium, India and Australia [10]. China had the most negative sentiment among the sampled countries and the
most frequently used words were “Donald Trump”, the name of the US president. A hopeful and positive attitude
was seen in the majority of people worldwide.

III. METHODOLOGY

       Tweetsfor    the    popular    hashtags#21daylockdown,       #Lockdown21,       #CoronaLockdownIndia,        and
#CoronavirusLockdown were retrieved using Twitter API (Tweepy). Approximately 5000 tweets were extracted
daily in the 21day lockdown period. Sentiment analysis helps to parse text data and compute the sentiment conveyed
in it [11]. It helps to detect the polarity from the text document. User response can be positive, negative, or neutral.
For each tweet, subjectivity value (range 0 to 1) and polarity value (range -1 to +1) was calculated and the total
                                                                                                         38 | P a g e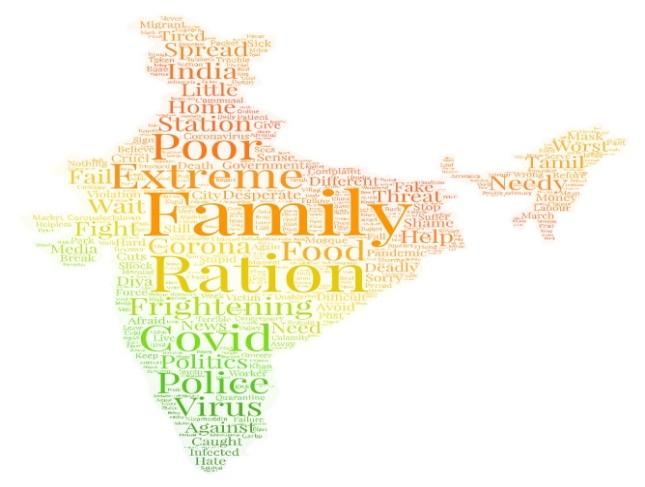
value ofsentiment was calculated as the summation of the product of subjectivity and polarity values of the
individual tweet.Table 1 provides a snapshot of the sentiment calculation process.

                                          Table 1. Sentiment Calculation

                               Tweet                                  Polarity       Subjectivity (s)   Sentiment (p
                                                                         (p)                                * s)
going really difficult parents find different reasons fight during
                                                                        -0.25              0.8              -0.2
lockdown
This generous gesture welcome such free distribution defeating
                                                                         0.2              0.65              0.13
purpose SocialDistancingNow

Good measures by the government to keep us safe
                                                                         0.6               0.8              0.48
Students classes stay connected with your studies during
                                                                        0.25               0.9             0.225
Lockdown with Creative Critical
farmer also very upset lockdown harvesting farmers debt and
                                                                         -0.6             0.62             -0.372
crisis

Support the government, hopes alive
                                                                         0.7               0.6              0.42
This happens when incompetent announces lock down India
                                                                         -0.3              0.4             -0.12
without preplanned Poor people suffer

         Significant words get repeated in the tweets and their frequency summarizes the meaning conveyed in the
dataset. These words are the main focus of the discussion topics among the general public as shownin figure 1. Top
wordpairs identified in the dataset have been listed in table 2.

                                                                                                        39 | P a g e
Figure1: Bar chart showing the most frequently used words
Table 2.Top word pair
Wordpair Frequency
somebody, sent 76
sent, told 76
told, exactly 76
exactly, year 76
year, happened 76
happened, nation 76
nation, goes 76
locality, daylockdown 76
doctor, treated 75
treated, locality 75
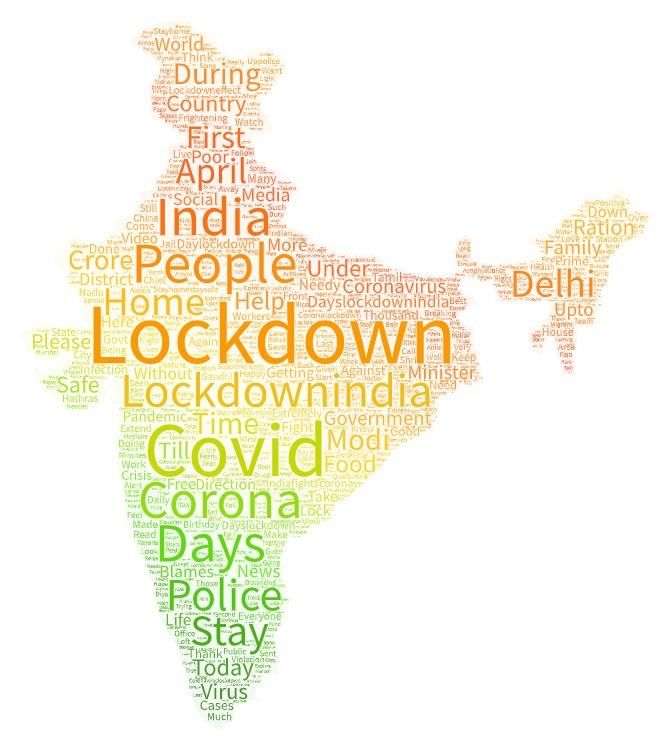
Based on the frequency of words, aword cloud was generated for the visual representation andbetter
understanding of popular words in the conversations as shown in figure 2.
40 | P a g eFigure2. Word Cloud of the dataset
IV. RESULTS
Sentiment analysis of the tweet dataset for the lockdown period reveals the most frequently used words
which resulted in both positive and negative sentiments. The dataset was sorted according to the sentiment value
columns separating negative and positive sentiment tweets. Table 3(a) lists the top positive words and table 3(b) lists
the top negative words in the dataset. Table 4 (a) lists the top positive word pairs and table 4 (b) lists the top
negative word pairs in the dataset.
41 | P a g eTable 3 (a)Top positive words (b) negative words
Word Frequency Word Frequency
lockdown 4647 family 1550
safe 1580 ration 1494
good 1102 extremely 1469
happy 1055 frightening 1463
positive 1017 covid 1112
love 1013 poor 1024
need 961 corona 733
country 914 police 642
live 842 spread 460
thank 771 needy 420
Table 4 (a)Top positive wordpairs (b) negative wordpairs
Word pair Frequency Word pair Frequency
happy,birthday 339 country,world 221
reminder,love 320 world,threat 221
doing,great 144 threat,covid 221
thank,vibhatomar 119 covid,spread 221
great,look 119 spread,country 219
vibha,efforts 119 complaint,information 69
today,food 119 something,deadly 68
beautiful,picture 73 people,distress 46
very,happy 68 active,cases 36
kind,attention 64 world,virus 35
Figure 3(a) Positive wordcloud(b) negative wordcloud
42 | P a g eThe total day-wise sentiment was plotted as shown in figure 4. The psychological state of the
general public is reflected in the overall sentiment score of a particular day and also as a whole for the
entire lockdown duration.
Figure4: Bar graph showing sentiment of the 21 days
Out of the 21 days, the overall sentiment for three days (1 stApril, 9th April and 14th April) was negative and
the sentiment for the rest of the days was positive which corresponds to the presence of negative and positive words
in the tweets of those days respectively.
V. CONCLUSIONS
Analysis of tweet dataset about prevailing situations such as COVID-19 can be used as an indicator of the
general public’s overall sentiment. The frequency of words and word pairs posted by users in their posts reveals the
overall situation of a region or a country. This can help policymakers in gauging the situation in the event of a
pandemic and plan to cope with it. Words like “ration” concern about the availability of food; “threat” and
“complaint” alarm about the well being of people. Tracking the respondents can help policymakers in resolving the
issues and helping the people.
43 | P a g eREFERENCES
[1] John Hopkins University and Medicine, “COVID-19 Map - Johns Hopkins Coronavirus Resource Center,”
John Hopkins Coronavirus Resource Center., 2020.
[2] G. B. K. Gopalkrishna Barkura , Vibha, “Sentiment Analysis of Nationwide Lockdown due to COVID 19
Outbreak: Evidence from India,” Asian Journal of Psychiatry, January, pp. 19-20, 2020.
[3] E. Chen, K. Lerman, and E. Ferrara, “COVID-19: The First Public Coronavirus Twitter Dataset,” arXiv
Prepr. arXiv2003.07372, Mar. 2020.
[4] Y. Watequlis Syaifudin and D. Puspitasari, “Twitter data mining for sentiment analysis on peoples feedback
against government public policy”, MATTER: International Journal of Science and Technology, vol. 3, no.
1, pp. 110-122, 2017, doi: 10.20319/mijst.2017.31.110122.
[5] Vibha, A. N. Prabhu, G. B. Kamath, and D. V. Pai, “Keeping the country positive during the COVID 19
pandemic: Evidence from India,” Asian Journal of Psychiatry. 2020, doi: 10.1016/j.ajp.2020.102118.
[6] C. K. L. Pastor, “Sentiment Analysis on Synchronous Online Delivery of Instruction due to Extreme
Community Quarantine in the Philippines caused by COVID-19 Pandemic,” Asian Journal of
Multidisciplinary Studies, vol. 3, no. 1, 2020.
[7] A. D. Dubey, “Decoding the Twitter Sentiments towards the Leadership in the times of COVID-19 : A
Case of USA and India,” Available at SSRN 3588623 (2020).
[8] S. Li, Y. Wang, J. Xue, N. Zhao, and T. Zhu, “The Impact of COVID-19 Epidemic Declaration on
Psychological Consequences: A Study on Active Weibo Users,” International journal of environmental
research and public health, vol. 17, no. 6, pp. 2032, 2020, doi: 10.3390/ijerph17062032.
[9] Y. Zhao, S. Cheng, X. Yu, and H. Xu, “Chinese Public Attention to COVID-19 Epidemic: Based on Social
Media (Preprint),” medRxiv, 2020, doi: 10.2196/18825.
[10] A. D. Dubey, “Twitter Sentiment Analysis during COVID19 Outbreak,” Available at SSRN 3572023
(2020), doi: 10.2139/ssrn.3572023.
[11] A. Mittal and S. Patidar, “Sentiment analysis on twitter data: A survey,” in ACM International Conference
Proceeding Series, 2019, pp. 91-95, doi: 10.1145/3348445.3348466.
44 | P a g eYou can also read