SOCIAL MEDIA BUZZ AROUND SUPER BOWL ADS - THE MIGHTY SCHMUCKS GRADUATE TEAM #17 GAMEDAY ANALYTICS CHALLENGE 2021 - FIRETOSS
←
→
Page content transcription
If your browser does not render page correctly, please read the page content below
Social Media Buzz Around
     Super Bowl Ads
 GameDay Analytics Challenge 2021

           Prepared by:
       The Mighty Schmucks
        Graduate Team #17

            Anna Sun
           Grant Griffith
           Chase Wilson

         12 February 2021
Executive Summary, Risks, and Assumptions

Analyzing the effectiveness of any specific ad campaign is problematic and challenging
at best. It is often more art than science. This dynamic is compounded by the fact that
different advertisers have different business models and, therefore, different visions and
goals in mind with regard to advertising and how to measure its effectiveness.
Therefore, this analysis will not attempt to draw any specific or exact conclusions from
the data, but rather it will attempt to extract some broadly applicable insights that will
help advertisers from various companies decide how to approach their Super Bowl ad
spending in the future.

The data set that was analyzed was based on collecting metadata from approximately
1.3 million Tweets that were posted during the Super Bowl and for approximately 1.5
hours afterward. It’s not difficult to see why simply analyzing data from Twitter is
extremely inexact and even potentially problematic. Even so, using Twitter as a proxy
for “Social Media Engagement” as a whole, analysts can gather useful insights about
the effectiveness of Super Bowl ads.

Therefore, this analysis was approached with an understanding of the imperfections that
are naturally inherent in this type of social media data, and its measurements and
analyses should be taken in the context of that imperfection.

                                                                                             2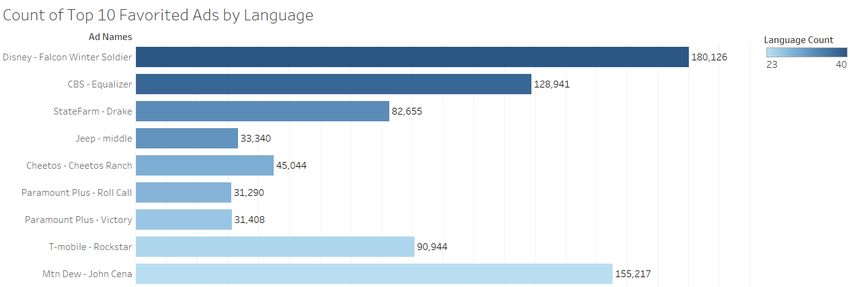
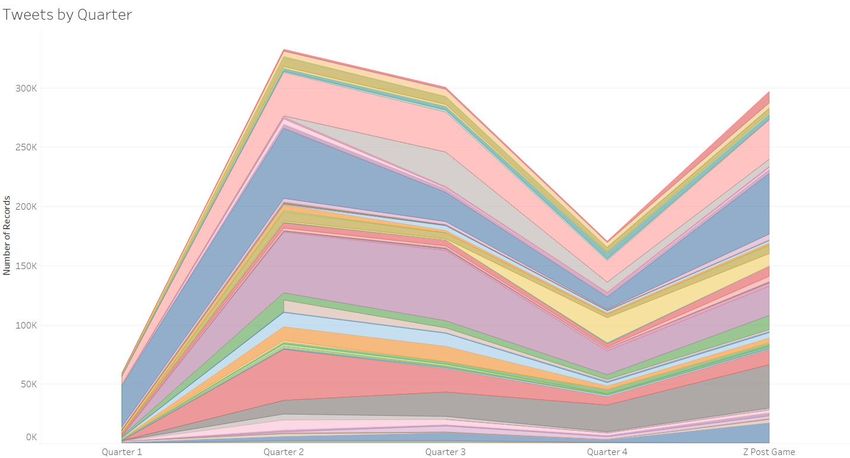
Using Tweet Volume as a Measure of Success

Some say that “all press is good press.” Therefore, success starts with the volume of
tweets generated per ad. This was a simple yet effective gauge of how engaging
(therefore successful) the Ad campaign was. To do this, the graph below was generated
to show the number of ads by ad. The Top 3 winners were be Disney, Mountain Dew,
and CBS, because they had the greatest volume of tweets.

The analysis also examined during which quarters the most Twitter activity occurred
surrounding the advertisements. The 2nd and 3rd quarters had, by far, the highest
activity.

                                                                                        3
Return on Investment
Advertisers paid approximately $5.5 million dollars, or about $183,000 per second, for a
30-second advertising spot during the Super Bowl this year. This analysis examined
over a million Tweets from Twitter in order to find out which advertisers made the most
of their investments, and which ones fell flat.
The following table shows advertisers’ cost per Tweet, weighted by the number of
seconds of advertising they paid for.
Ad Name Tweets Seconds Total Investment Cost/Tweet
Bought
Disney - Falcon and the Winter $ 30.53
180126 30 $ 5,500,000.00
Soldier
Mtn Dew - John Cena 155217 30 $ 5,500,000.00 $ 35.43
T-mobile - Rockstar 90944 30 $ 5,500,000.00 $ 60.48
StateFarm - Drake 82655 30 $ 5,500,000.00 $ 66.54
CBS - Equalizer 128941 60 $ 11,000,000.00 $ 85.31
Paramount Plus - Roll Call 31290 30 $ 5,500,000.00 $ 175.78
Nintendo - Switch Play 28684 30 $ 5,500,000.00 $ 191.74
Cheetos - Cheetos Ranch 45044 60 $ 11,000,000.00 $ 244.21
Oatly - No Cow 17275 30 $ 5,500,000.00 $ 318.38
Verizon - Verizon 29403 60 $ 11,000,000.00 $ 374.11
Disney - Disney Bundle 11938 30 $ 5,500,000.00 $ 460.71
Indeed - Rise Up 23542 60 $ 11,000,000.00 $ 467.25
BudLight - Bud Light Legends 21565 60 $ 11,000,000.00 $ 510.09
Logitech - Defy Logic 21511 60 $ 11,000,000.00 $ 511.37
Paramount Plus - Victory 31408 90 $ 16,500,000.00 $ 525.34
Anheuser Busch - Anheuser $ 555.28
19810 60 $ 11,000,000.00
Busch
M&M's - Come Together 9756 30 $ 5,500,000.00 $ 563.76
Toyota - Jessica Long Upstream 17519 60 $ 11,000,000.00 $ 627.89
Jeep - Middle 33340 120 $ 22,000,000.00 $ 659.87
Robinhood - All Investors 8199 30 $ 5,500,000.00 $ 670.81
Dexcom - Dexcom G6 8165 30 $ 5,500,000.00 $ 673.61
Universal - Old 7135 30 $ 5,500,000.00 $ 770.85
Amazon - Michael B Jordan 13922 60 $ 11,000,000.00 $ 790.12
Doordash - Sesame Street 13687 60 $ 11,000,000.00 $ 803.68
SpaceX - Inspiration4 5516 30 $ 5,500,000.00 $ 997.10
Uber Eats - Eat Local 10914 60 $ 11,000,000.00 $ 1,007.88
Mercari - Mercari 2695 15 $ 2,750,000.00 $ 1,020.41
Cadillac - Scissorhands 15900 90 $ 16,500,000.00 $ 1,037.74
TidePod - Hoodie 10458 60 $ 11,000,000.00 $ 1,051.83
Fiverr - Opportunity Knocks 9049 60 $ 11,000,000.00 $ 1,215.60
4TurboTax - Experts 6186 45 $ 8,250,000.00 $ 1,333.66
GM - No Way Norway 11234 90 $ 16,500,000.00 $ 1,468.76
Michelob Ultra - Michelob Ultra 6950 60 $ 11,000,000.00 $ 1,582.73
Pringles - Space Return 3241 30 $ 5,500,000.00 $ 1,697.01
Squarespace - 9 to 5 2881 30 $ 5,500,000.00 $ 1,909.06
Paramount Plus - Hooked It 2777 30 $ 5,500,000.00 $ 1,980.55
BudLight - Bud Light Seltzer 5446 60 $ 11,000,000.00 $ 2,019.83
Rocket Mortgage - Tracy Morgan 4989 60 $ 11,000,000.00 $ 2,204.85
Under Armour - Under the $ 2,324.60
2366 30 $ 5,500,000.00
Armour
CBS - Clarice 4620 60 $ 11,000,000.00 $ 2,380.95
Chipotle - Burrito 4360 60 $ 11,000,000.00 $ 2,522.94
WeatherTech - We Never Left 1929 30 $ 5,500,000.00 $ 2,851.22
WeatherTech - WeatherTech 1926 30 $ 5,500,000.00 $ 2,855.66
Best Foods - Fairy God Mayo 1730 30 $ 5,500,000.00 $ 3,179.19
Doritos - Doritos 3D 3458 60 $ 11,000,000.00 $ 3,181.03
Huggies - Huggies Diapers 1689 30 $ 5,500,000.00 $ 3,256.36
Skechers - Max Cushion 908 30 $ 5,500,000.00 $ 6,057.27
Klarna - Klarna 891 30 $ 5,500,000.00 $ 6,172.84
Etrade - Workout 880 30 $ 5,500,000.00 $ 6,250.00
Vroom - vroom 818 30 $ 5,500,000.00 $ 6,723.72
Amazon Prime - Coming 2 $ 9,821.43
560 30 $ 5,500,000.00
America
Scotts - Miracle Gro 697 45 $ 8,250,000.00 $ 11,836.44
Michelob - Michelob Seltzer 855 60 $ 11,000,000.00 $ 12,865.50
FBI Most wanted - Most Wanted 177 20 $ 3,666,666.67 $ 20,715.63
Jimmy Johns - Meet the King 808 105 $ 19,250,000.00 $ 23,824.26
T-mobile - Family Drama 361 60 $ 11,000,000.00 $ 30,470.91
NFL - As One 445 90 $ 16,500,000.00 $ 37,078.65
DrSquatch - Dr Squatch Soap 118 30 $ 5,500,000.00 $ 46,610.17
CBS Sports - Masters 106 30 $ 5,500,000.00 $ 51,886.79
MicroBan - MicroBan 79 30 $ 5,500,000.00 $ 69,620.25
Tough-as-nails - Tough-as-nails 47 30 $ 5,500,000.00 $ 117,021.28
Bass Pro Shop - Nature 17 60 $ 11,000,000.00 $ 647,058.82
Guaranteed Rate - Underdog 10 60 $ 11,000,000.00 $ 1,100,000.00
H&R Block - File Free 1 60 $ 11,000,000.00 $ 11,000,000.00
5The top ten performers in terms of lowest cost per Tweet were Disney, Mountain Dew,
T-Mobile, State Farm, CBS’s Equalizer, Paramount Plus, Nintendo, Cheetos, Oatly, and
Verizon. All of these advertisers invested less than $400 per Tweet.
According to the analysis, only about 8% of the advertisers that ran ads during the
Super Bowl ended up paying less than $100 per Tweet received. The following
information is useful in determining one possible “spectrum” for success based on a
relative cost ranking.
PERCENTAGE OF ADVERTISERS THAT PAID LESS THAN
$100/Tweet 7.81%
$1000/Tweet 39.06%
$10,000/Tweet 79.69%
6Total Value Gained
Having established Cost/Tweet as a good proxy for each advertiser’s relative cost of
public engagement, the analysis goes further and attempts determine which advertisers
not only paid the lowest cost for their Twitter engagement, but also got the most Twitter
buzz from their Super Bowl commercials. This cross-analysis is another potentially
useful representation of total value gained by each advertiser.
The Top 10 performers were Disney, Mountain Dew, CBS’s Equalizer, T-Mobile, State
Farm, Paramount Plus, Nintendo, Cheetos, Oatly, and Verizon.
7How Much Airtime Should Advertisers Buy?
Since Super Bowl ads are purchased in increments of seconds, the length of each ad is
directly related to its cost. The analysis examined if paying for longer ads, i.e. spending
more money, was correlated with a greater return in terms of Twitter engagement.
Surprisingly, regression analysis showed a slight negative correlation between length of
ad and Twitter engagement. The p-value was, however, too high to establish statistical
significance, likely due to the small sample size.
It was determined that, of the Top 10 Performers in terms of ROI, 8 ran ads that were
only 30 seconds in length. The other two ran ads that were 60 seconds in length, and
one of those was a CBS affiliate, which likely affects their direct cost of advertising on
CBS.
From the admittedly limited data, it was determined that there is no correlation between
purchasing more advertisement time and engagement on Twitter. In fact, the data
suggests that the average engagement from 30 second ad spots was approximately
34% HIGHER than engagement for ads longer than 30 seconds. Furthermore, there is
very little difference in standard deviation between the different ad lengths, suggesting
that there is no evidence that length of advertisement has any bearing on the riskiness
of the ad. These data points suggest that purchasing extra advertising time and creating
longer ads is likely much less important than more qualitative metrics.
Twitter engagement on ads that were 30 seconds or less in
length was approximately 34% HIGHER than on longer ads...
8Which Ad Had the Most Tweeted Keywords?
In an effort to further analyze the potential twitter response per ad, a word cloud visual
was created. The key words were taken from each tweet and were then compared to
the summation of the listed count of tweets. The key-word data was split out based on
the presence of ‘|’ punctuation, into 6 separate groups. The individual split out key-
words were then pivoted into field values and added as marks in Tableau. The sum of
the listed count of tweets was also added to the marks card but under the size
adjustment. The results indicate that out of all of the ads, the Mountain Dew John Cena
ad contained the largest count of key-words utilized in tweets, not Disney.
9Did Follower Count Affect Ad Tweet Response?
The below is a visual which exhibits if an ad received more replies on the basis of a
higher follower count. At its core the distinct count of followers and the distinct tweet
count were utilized to distinguish the impact of followers. Disney and Mountain Dew
both top the list in relative exposure.
10Did the Language Used in the Tweet Affect Favorite
Ads?
Analysis was conducted to determine if the number of languages of the responding
tweets had any impact on whether an ad became a favorite or not. The below visual
aims to show the count of languages used in response to the top 10 favorite ads. The
Disney Falcon Winter Soldier ad was at the top of the favorites list and received
responses in 40 different languages. Interestingly the second most favorite ad was the
Mountain Dew John Cena ad, which received responses in only 23 languages. From the
visual it appears that language response might have some impact on favorites as three
of the top 5 ads within the visual had a higher language response, but two out of the five
had some of the lowest responding language counts. When placed into the context of
the overall visual, it appears that language response has less of an impact on favorites.
11Conclusions and Insights
While it is difficult to draw any very specific conclusions from imperfect social media
metadata, the following insights are broadly applicable and, if nothing else, merit further
examination using broader data sets:
1. Different brands have different reasons for investing in Super Bowl Ads. Larger,
more well-known brands, likely invest in advertising largely to maintain their
social and culture status, while smaller brands may be more likely to be hoping
for a boost to their bottom lines.
2. Larger, more well-known brands tend to receive larger volumes of social media
engagement when they invest in Super Bowl advertising.
3. Cost per Tweet, while not a direct costing metric, can provide a financial
spectrum with which to judge the success of an ad relative to the other ads that
also advertised during the Super Bowl
4. This relative analysis can be further enhanced by cross-analyzing both marginal
Cost per Tweet and Total Tweet volume. Within the limited scope of this
analysis, this metric seems to be a decent proxy for overall value.
5. Keyword analysis is a great way for advertisers to gauge and target their
engagement on social media. Even though Disney won in total volume,
Mountain Dew appears to be the winner in keywords.
6. When gauging activity on social media, follower, retweet, favorite, and other
peripheral metrics can be just as important, and can reveal secondary ad reach
that isn’t always apparent in the direct numbers.
7. In the age of global social media, the reach of advertising, even for American
events like the Super Bowl, is global. Advertisers would do well to analyze more
international points of data, like language in order to make determinations about
what advertising channels fit their business model.
12You can also read