SEPTEMBER 2021 Review and Outlook 2021/2022 - Bank Austria
←
→
Page content transcription
If your browser does not render page correctly, please read the page content below

SEPTEMBER 2021 Review and Outlook 2021/2022
Focus Austria
Summary
Slowly Towards Normality
International environment
Forecast
2019 2020 2021 2022
(GDP, change in %)
Eurozone 1.5 -6.7 5.0 4.3
Germany 1.1 -4.8 3.0 5.0
France 1.8 -8.0 6.0 4.1
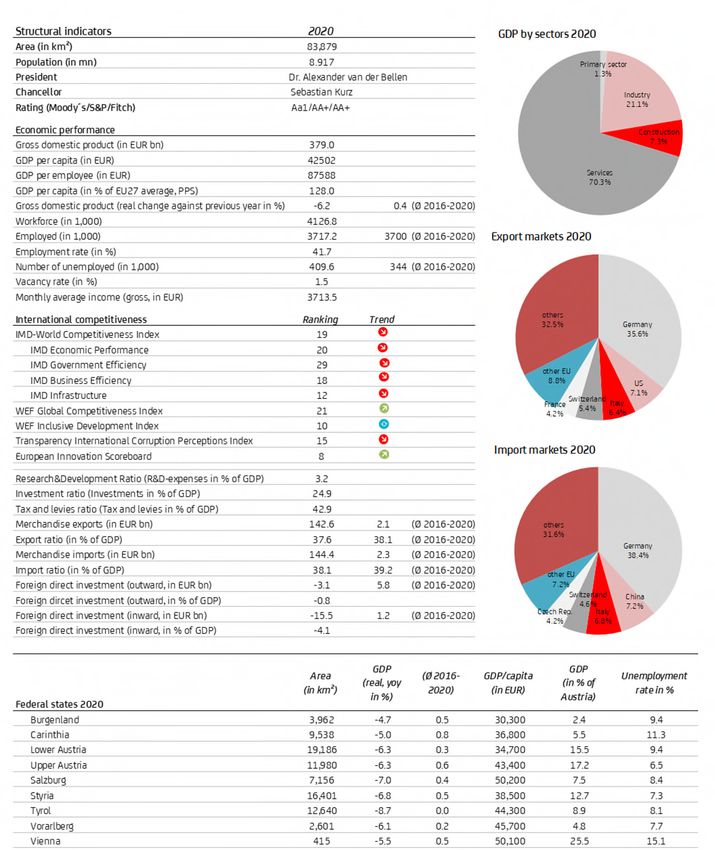
Italy 0.3 -8.9 6.1 4.2 ■ Austria's economy started off in the spring – GDP in the first half of 2021 up
Spain 2.0 -10.8 5.9 5.1 by 3% year-on-year
UK 1.4 -9.8 6.7 6.1 After the second recession over the winter, the Austrian economy started off
USA 2.3 -3.4 6.1 3.8 strongly in the spring. GDP in the first half of 2021 rose by more than 3%
Japan 0.3 -4.8 2.6 2.6 year-on-year in the first half of the year due to the 3.6% increase from the
previous quarter in the second quarter. After a recovery in industry and con-
2017 2018 2019 2020 struction began at the beginning of the year, the service sector is now making
(annual average) a strong contribution to the restart.
USD per euro 1.13 1.18 1.12 1.14
■ The peak of growth has already been exceeded – despite a slowdown from
CHF per euro 1.11 1.15 1.11 1.07 autumn onwards, a GDP growth of 4.0% 2021 and even 5.1% in 2022 is
GBP per euro 0.88 0.88 0.88 0.89 expected.
JPY per euro 126.7 130.4 122.1 121.8 Although the Austrian economy will once again post strong growth in Q3, per-
formance will not match the flying start we saw back in the spring because
Oil (USD/barrel) 55 72 64 43 the catch-up effects are set to taper off and the pace of recovery will slow in
general, especially in the industrial sector. The growth trend will further slow
10y Gov. bond (A) 0.56 0.69 0.05 -0.28 over the course of the year, but we still expect the recovery to be sustainable
3m Euribor -0.33 -0.32 -0.36 -0.42 and support 4.0% growth of the economy in 2021.
Source: UniCredit Research
The Austrian economy is expected to return to pre-crisis levels around the end
of 2021/start of 2022. Despite the increasing challenges posed by higher in-
fection rates over the winter months, recovery should continue in 2022 —
although the growth momentum will continue to decline throughout the year
as a result of the catch-up effects tapering off. Due to the statistical overhang
from the pandemic, however, economic growth for 2022 will be as much as
5.1% year on year.
■ Rapid improvement in the labor market due to a strong recovery – the un-
employment rate is already expected to return to pre-crisis levels in the
course of 2022.
In the current economic recovery, the situation on the labor market is improv-
ing surprisingly quickly. Given the high pace of recovery, the average unem-
ployment rate of 9.1% for H1 2021 in Austria is likely to drop to an average
of 8.3% for 2021 as a whole. In the coming year, the pace of improvement
will continue at a much slower pace. For 2022, we expect the unemployment
rate to fall to an average of 7.6%, with the unemployment rate expected to
return to pre-crisis levels in the course of 2022.
■ Oil prices have caused inflation to rise since the beginning of 2021 – after
an average of 2.4% in 2021, inflation should fall to 2.1% in 2022.
Inflation rose significantly in the course of 2021 due to a higher oil price. In-
Author: Walter Pudschedl flation is expected to reach its peak in late autumn, with values of 3%. We
assume a price increase of 2.4% on average in 2021. We expect the rise in
Imprint
Published by UniCredit Bank Austria AG inflation to be essentially temporary. We expect inflation to slow down from
Economics & Market Analysis Austria the turn of the year 2021/22, because first of all, there is no further upwards
Rothschildplatz 1
1020 Vienna pressure in sight from oil prices. Secondly, the effect of price-driving supply
Telephone +43 (0)50505-41957 bottlenecks in the construction and industrial sectors is expected to taper off
Fax +43 (0)50505-41050
e-Mail: econresearch.austria@unicreditgroup.at slowly. Thirdly, we are expecting only modest wage-side pressure. We there-
fore expect the price increase to decrease to 2.1% on average for 2022.
as of September 2021
UniCredit Research Page 2Focus Austria
Summary
■ ECB continues to support monetary policy – no interest rate changes expected
For the time being, the European Central Bank's PEPP crisis paper purchasing
program will continue at an unchanged pace. However, there is also a growing
number of voices within the ECB in favor of a cut-off or a run-off in March 2022.
However, a phasing out of PEPP in March 2022 would pose significant
challenges, as by then some countries will continue to have an output gap as a
result of the pandemic and eurozone inflation forecasts are expected to remain
below target. The need to obtain favorable financing conditions would then
require a substantial increase in the standard purchase program.
With the change in the inflation target in July 2021 from "just below" to
sustainable 2% in the medium term, the ECB has given itself additional room to
manoeuvre. An inflation rate that is at least temporarily "moderately above the
target value" is expected to be accepted without any reaction. For the time being,
we therefore do not expect a change in the ECB's key interest rate (0.0%) or the
deposit rate (-0.5%).
■ Rapid recovery improves budget and debt outlook
After two years of slight surpluses in public finances, the collapse of the economy
as a result of the coronavirus crisis 2020 has led to a record new debt of 8.8% of
the GDP. Despite the partly higher expenditure on various aid measures in the
first half of 2021, the favorable development of revenue, with the continuation
of the economic recovery in the second half of the year, suggests a decline in the
general government budget deficit to around 6.5% of the GDP in the current year.
Economic situation at a glance
forecast UCBA
2015 2016 2017 2018 2019 2020 2021 2022
Real change in %
GDP 1.0 2.0 2.4 2.6 1.4 -6.2 4.0 5.1
Private consumption 0.5 1.5 1.9 1.1 0.8 -8.2 1.0 5.0
Public consumption 0.9 1.8 0.9 1.2 1.5 2.5 5.8 1.6
Gross fixed capital formation*) 2.3 4.3 4.1 3.9 4.0 -5.5 7.7 4.0
Investments in plant and machinery 3.9 9.5 7.3 3.2 4.7 -8.7 10.0 6.0
Investments in construction 0.1 0.3 2.5 3.6 3.6 -4.3 3.2 2.2
Exports 3.0 3.0 4.9 5.5 2.9 -11.0 7.3 8.1
Imports 3.6 3.7 5.3 5.0 2.4 -9.2 7.2 4.4
CPI (change in %) 0.9 0.9 2.1 2.0 1.5 1.4 2.4 2.1
HCPI (change in %) 0.8 1.0 2.2 2.1 1.5 1.4 2.5 2.3
Saving ratio (in %) 7.8 7.5 7.8 8.2 14.5 12.5 9.2
Current account (in euro bn) 5.9 9.7 5.1 4.8 11.3 9.5 3.5 7.0
Current account (in % of GDP) 1.7 2.7 1.4 1.3 2.8 2.5 0.9 1.6
Employment (in 1,000)**) 3,449 3,502 3,573 3,661 3,720 3,644 3,709 3,762
Employment (change in %) **) 1.0 1.6 2.0 2.5 1.6 -2.0 1.8 1.4
Unemployment rate (nat. def.) 9.1 9.1 8.5 7.7 7.4 9.9 8.3 7.6
Unemployment rate (EU def.) 6.2 6.5 5.9 5.2 4.8 6.0 6.5 5.1
Unemployed (annual average in 1,000) 354 357 340 312 301 410 342 317
General gov. balance (in % of GDP) -1.0 -1.5 -0.8 0.2 0.6 -8.8 -6.5 -3.0
Public-sector debt (in % of GDP) 84.9 82.8 78.5 74.0 70.5 83.2 84.6 81.8
Nominal GDP (in euro bn) 344 358 369 385 398 379 403.5 433.0
*) excluding changes in inventory **) excluding persons drawing maternity benefits, military service and training
Source: Statistik Austria, OeNB, UniCredit Research
UniCredit Research Page 3Focus Austria
Business cycle
Strong recovery of the Austrian economy
■ A sharp fall in the economy by 6.2% in 2020 was followed by a rocket start of the recovery in spring 2021
■ Economic performance rose by 3.2% year-on-year in the first half of 2021
■ Rapid recovery in investment, consumption is slower
■ Growth in freight transport, but tourism is causing the volatile development of trade in services
■ Expiring catch-up effects and increasing pandemic risks will slow recovery in the second half of 2021, but recovery
continues and will allow the GDP to rise by 4.0% in 2021 as a whole
■ Economic growth climbed to 5.1% in 2022 thanks to statistical overhang
■ Focus: The Austrian industrial miracle
From the pandemic-related slump in rapid pace to the boom
As a result of the measures to contain the pandemic, which took place for the first time in
Austria in mid-March 2020, there were strong economic fluctuations over the course of the
year, depending on the course of the infection and the respective intensity of the measures,
Economic growth up and down which were reflected in a fall of 6.2% in GDP in 2020 as a whole.
due to the pandemic ultimately
leads to a 6.2% decline in the Toward the end of 2020, restrictions on trade and hospitality triggered a second phase of re-
GDP in Austria in 2020
cession, which lasted until spring 2021. However, the fall in the GDP in the first quarter of
2021 was significantly lower than the fall of 2.5% at the end of 2020, at only 0.2% compared
to the previous quarter. This was due to the improvement of the international environment
and the upturn in global trade at the beginning of the year, which enabled the export-depend-
ent industrial sectors of the Austrian economy to recover. In addition, the construction indus-
try has had a good start to the year thanks to strong order books, supported by public con-
Opening of the service industries tracts and a rise in the demand for housing. With the easing of pandemic control measures in
in the spring enabled GDP the spring, the retail, hospitality and many other service sectors abruptly switched to recovery
growth of 3.6% compared to the mode and - supported by strong pent-up demand and accumulated consumer savings - made
previous quarter from April to
June 2021 a strong contribution to the now broad-based restart of the economy. This restart was surpris-
ingly strong, with GDP rising by 3.6% in the second quarter. The Austrian economy was also
able to show particularly strongly in international comparison, after the high proportion of
contact-intensive services over the winter also caused an above-average decline in interna-
tional comparison, which allowed a corresponding backlash after opening. In the first half of
2021, the Austrian economy grew by 3.2% year-on-year.
DOUBLE RECESSION IN THE PANDEMIC IN AUSTRIA, BUT STRONG RECOVERY FROM SPRING 2021
GDP growth GDP growth in comparison
(change in GDP in % and contribution from demand components) (real GDP in %, qoq)
14
3 12
2 10
2.6 Austria
1 2.4 8
2.0
0 1.4 6 Germany
1.0
-1 4
2 Euro area
-2
0
-3
-2
-4 Private consumption Public consumption -4
-5 -6
Investment Net exports
-6 -8
GDP total
-7 -10
-6.2
-8 -12
2015 2016 2017 2018 2019 2020 1Q19 2Q19 3Q19 4Q19 1Q20 2Q20 3Q20 4Q20 1Q21 2Q21
Source: Statistik Austria, Refinitiv Datastream, UniCredit Research
UniCredit Research Page 4Focus Austria
Business cycle
Consumption starts again as the pandemic subsists
Domestic demand was most affected by the impact of pandemic mitigation measures in
2020, especially private consumption. While public consumption increased by 2.5%, among
other things, due to the expansion of health-care activity, which was the strongest increase
since the financial crisis, private consumption, at 8.2%, had to accept the most significant
decline ever.
Private consumption was the With the second shutdown from November on, private consumption collapsed again at the
hardest hit demand component
in 2020, with a decline of 8.2% end of 2020. At the beginning of 2021, the decline continued in a little damped form due to
in real terms year-on-year restrictions on trade, hospitality and contact-intensive services. It was only with the fall of the
third wave of infections in the spring, which allowed the service industries to gradually open
up, that a turnaround began. In the second quarter, private consumption rose by more than
3% compared to the previous quarter. While the economy as a whole has already grown by
more than 3% compared to the previous year, private consumption in the first half of the year
is just above the already modest result of the previous year.
In contrast to the previous year, we estimate that the recovery in private consumption will
continue in the second half of 2021, although from autumn onwards, increasing numbers of
Rebound of consumption is
infections will again require health precautions due to new virus variants, which should limit
expected to continue despite its further development. For the full year 2021, we expect private consumption to rise by
rising risks around 1%. The further upturn in private consumption will be driven mainly by catch-up
effects, after many services could not be used by the spring. This is supported by the
dissolution of the accumulated savings, which have inevitably resulted from the lack of
consumer opportunities. By spring, the savings rate has risen on average four quarters to
15.2%. The reduction to the pre-crisis level of just over 8% will not be sudden, but will
continuously give additional impetus to consumption over a longer period of time. In the
coming months, consumer development will also benefit from the surprisingly favourable
development of the labour market situation, which has already brought a new record level of
employment by the middle of the year. In addition to the ongoing uncertainty caused by the
Private consumption is pandemic, which is likely to continue to affect demand for many contact-intensive services,
generating a lot of growth, the rise in consumption in the coming months will be dampened by the loss of fiscal support
especially in 2022
(additional unemployment benefit and child bonus in the previous year). In addition, the rise
in inflation caused by the higher oil price to reduce real incomes in 2021.
Real incomes are expected to rise in 2022. Combined with the continued relaxation of the la-
bour market, the further reduction of savings and the reduction of the pandemic, this will lead
to an acceleration of the consumption dynamics to around 5%. Private consumption is ex-
pected to become the most important demand component of the Austrian economy in 2022.
REDUCTION OF SAVING FUNDS SUPPORTED: CONSUMPTION WILL BECOME THE DETERMINING DEMAND COMPONENT OF THE
RECOVERY IN 2022
Savings ratio for private households in Austria Private consumption
(in % of disposable income) (real change in %, qoq and yoy)
16% 15 15
Forecast Forecast
12 12
14.5%
14% 9 9
12.5% 6 6
12% 1.1 0.8 1.0
3 5.0 3
10% 0 0
9.2%
7.8% 8.2% -3 -3
8.5%
8% -6 -8.2 -6
Savings ratio (before Corona) -9 -9
6%
-12 qoq, seasonally adjusted (right-hand scale) -12
Savings ratio
Annual average
4% -15 -15
2018 2019 2020 2021 2022 2023 2018 2019 2020 2021 2022
Source: OeNB, Statistik Austria, UniCredit Research
UniCredit Research Page 5Focus Austria
Business cycle
A surge in investment due to a backlog of needs and a construction and industrial boom is
driving the economy
The economic downturn due to the pandemic also caused a sharp decline in investment
demand in 2020. Gross fixed capital formation fell by 5.5% for the full year. This means that
the decline was significantly lower than during the financial crisis (2009: -10.4%). Compared
with private consumption, the decline was also lower, because after the sharp fall at the
beginning of 2020, an upturn in investment activity began thanks to the recovery in global
A rising global industrial trade, which had a positive impact on Austria's export-dependent industry. In contrast to the
economy limited a sharp fall in
investment activity in 2020 to development of private consumption, the new shutdown in the winter dampened it strongly,
the first shutdown phase in the but did not interrupt it.
spring
After an increase of almost 5% at the beginning of 2021 compared to the previous quarter,
investment growth slowed slightly in the spring to just under 2% compared to the previous
quarter. For the first half of the year, this represents a strong real increase in gross fixed
capital formation by more than 7% year-on-year. As a result, investment activity has already
exceeded the pre-crisis level. In addition to the growing international industrial economy,
Rebound in investment activity
drove strong economic growth which triggered an increased demand for investment in the Austrian manufacturing export
in Austria in the first half of the industry, in the spring, with the opening of many service sectors, increased investment activity
year in terms of demand also began in this sector. All areas of equipment investment – with the exception of the
purchase of vehicles – increased in the first half of the year. Construction investments, which
were significantly less affected by the pandemic in 2020 than equipment investments, also
increased significantly in the first half of 2021.
The positive development of investment activity should be able to continue in the coming
months. The global economy is starting to weaken somewhat, but construction and industry
are still experiencing high backlog and high levels of new orders. Capacity utilisation in do-
mestic industry has already significantly exceeded the long-term average, so that in the com-
ing months, equipment investments should receive fresh impetus not only through catching-
up effects, but increasingly through the need for enlargement. This will also be increasingly
extended to the services sector, although uncertainty in this sector is high due to the increas-
The recovery in investment ing course of infection. Investment will continue to be supported by the monetary policy of the
continues, but the effects of
catching-up are slowing down in European Central Bank, which ensures favorable financing conditions. We do not expect a
2022 change in central bank interest rates until the end of 2022. Moreover, fiscal stimulus also pro-
vides support. For example, the government's investment premium for health, digitization and
greening projects will support the willingness of local companies to invest, and in the coming
months, the positive effects of the European "Next Generation EU" program should be put into
effect. However, due to the decline in tax revenues, the resources of the major public investors
- municipalities and countries - are scarce. Overall, we expect gross fixed capital formation to
increase by 7.7% in 2021. In 2022, the growth was expected to be lower, with catch-up ef-
fects expiring, at just under 4%.
INVESTMENTS HAVE ALREADY OPENED UP TO PRE-CRISIS TRENDSTHANKS TO THE INDUSTRIAL AND CONSTRUCTION BOOM
Gross fixed capital formation Gross fixed capital formation in Austria
(real change in %, yoy, with contributions from equipment and buildings) (real, Q4 2019=100)
13.1 110
15
7.6
10 105
4.7 5.0 4.5 4.7
3.1 2.5 2.2
5
0.0
0 -3.2 -3.2 -3.7 100
-5 Buildings
Investment (current + forecast)
Equipment 95
-12.0 Investment (before Corona)
-10 Gross fixed capital formation
-15 90
Q1 2018 Q3 2018 Q1 2019 Q3 2019 Q1 2020 Q3 2020 Q1 2021 Q4 2019 Q2 2020 Q4 2020 Q2 2021 Q4 2021 Q2 2022 Q4 2022
Source: Statistik Austria, Refinitiv Datastream, UniCredit Research
UniCredit Research Page 6Focus Austria
Business cycle
Recovery in goods trading, but services characterized by volatility in tourism
The development of foreign trade was particularly badly affected by the pandemic in 2020.
Austrian exports fell by 11% in real terms compared with the previous year. Imports also
dropped sharply year-on-year at 9.2%. The impact of the pandemic on the trade in goods and
services showed a strong difference. Freight transport was severely slowed down by the
Corona crisis is a much stronger interruption of the global value chains immediately after the outbreak of the pandemic. But
hit on trade in services than on since mid-2020, trade in goods has been rising again, supported by the recovery in global trade.
goods The development of services was significantly more volatile due to the strong fluctuations due
to restrictions on tourism, which led to a massive fall in cross-border travel in the second
shutdown in the winter. Service imports fell by more than 16% in real terms in 2020. Service
exports even fell by more than 17%, burdened by the massive slump in travel exports.
Overnight stays of foreign guests in Austria fell by over 40% to 66.3 million (2019: 112.8
million). With the decline in exports, both in the goods and services sectors, and the decline in
imports at a similar level, the impact on economic growth remained limited, despite the
massive distortions in foreign trade. However, in 2020, the contribution of net exports to
growth was slightly negative for the first time in two years.
Trend in the recovery of trade On the one hand, the first half of 2021 was marked by the strengthening of the recovery in
since mid-2020. By comparison, global goods trading, which was reflected in the development of Austrian goods exports, with
trade in services is still burdened
by restrictions on tourism an increase of 16% year-on-year. Goods imports increased by 14,6% due to increasing
investment and consumption requirements. At the same time, however, the development of
service exports was still severely affected by the continuing restrictions on tourism, especially
at the beginning of the year. Overall, total real exports in the first half of the year increased by
6% compared to the previous year, while imports increased by 9%. Thus, foreign trade once
again provided a small cushion for the increase in GDP.
In 2021, foreign trade once again In the second half of the year, a high rate of export growth is expected, thanks to the continued
dampened domestic economic recovery in industry. Austrian service exports will benefit from this, but will continue to suffer
dynamics
from the restrictions on tourism. Also in the summer of 2021, due to travel restrictions and var-
ious hygiene measures in tourism, normal operation was not possible and there are great risks
for the coming winter season in view of the new virus variants. Overall, this will result in a
strong increase in exports compared to 2020. The increasing demand for consumption and in-
vestment will strongly drive the import dynamics, so that in 2021, we expect a negative contri-
bution of foreign trade to the Austrian economy and a deterioration of the current account sur-
plus for the second year in a row.
AUSTRIA'S EXPORTS OF GOODS ARE ON THE RISE, SERVICE TRADE CHARACTERISED BY UP AND DOWN IN TOURISM
Overnight stays in Austria Export and import dynamics in Austria
24 350 (seasonally adjusted, qoq in %)
22 in millions Change in %, yoy (right-hand scale) 45
300 40 Export of goods
20 35 Exports of services
18 250
30 Exports , total
16 200 25 Import of goods
20 Import of services
14 150 15 Imports, total
12 10
10 100 5
8 50 0
-5
6 0 -10
4 -15
2 -50 -20
0 -100 -25
-30
Jan-19 Jul-19 Jan-20 Jul-20 Jan-21
Q1 2015 Q1 2016 Q1 2017 Q1 2018 Q1 2019 Q1 2020 Q1 2021
Source: Statistik Austria, UniCredit Research
UniCredit Research Page 7Focus Austria
Business cycle
Recovery continues, but risks are increasing again
The Austrian economy was in high spirits at the beginning of the second half of the year. This,
Economic sentiment at its peak combined with the economic data available so far, suggests that the recovery over the
in mid-2021 summer has continued at a rapid pace. However, the zenith of growth dynamics seems to
have been reached, as the first signs of fatigue appear in some parts of the economy.
International support for Austria's export-focused industrial sector is losing strength and the
additional momentum from global trade is weakening. Supply bottlenecks in the
semiconductor sector, for example, are also putting a strain on industry. Due to supply
problems and a dynamic cost trend, the momentum of the construction sector also dipped
somewhat, at least temporarily — although the order books are filling up more quickly than
before, thanks mainly to public contracts. In the coming months, the services sector should
become much more significant in terms of the pace of recovery. As many sectors did not open
up until the spring, the services sector is still benefiting from catch-up effects that have
already largely run their course in the industrial and construction sectors. Sentiment in the
Pace of recovery is losing
momentum after a rocket start services sector is therefore continuing to improve, with confidence among consumers now at
in the second half of the year a two-year high.
After the turnaround in the spring with a 3.6% increase in GDP compared to the previous
quarter, the Austrian economy will again achieve high growth in the third quarter.
Performance will not match the flying start we saw back in the spring because the catch-up
effects are set to taper off and the pace of recovery will slow in general, especially in the
industrial sector. In the course of the year, the growth trend will continue to slow down, and is
expected to be increasingly burdened by renewed measures against the spread of the
pandemic. Nevertheless, we assume that the recovery will prove to be sustainable and that
economic growth of 4.0% in Austria will be possible in 2021 as a whole.
The Austrian economy is expected to return to pre-crisis levels around the end of 2021/start
Austria's economy is expected to of 2022. Despite the increasing challenges posed by higher infection rates in the winter, recov-
reach pre-crisis levels by the
turn of the year 2021/22 ery should continue in 2022 — although growth momentum will continue to decline through-
out the year as a result of the catch-up effects tapering off. Due to the statistical overhang
from the pandemic, however, economic growth for 2022 will be as much as 5.1% year on
year. Private consumption—which will be largely free of restrictions and bolstered by the in-
creased savings levels accumulated during the pandemic—will be the main driver in the com-
ing year and will be able to develop more strongly than it has this year. By contrast, invest-
ment activity will be a less significant contributor to economic growth following the very
strong rebound in 2021, although the financing environment is likely to remain favourable
and exports are likely to provide strong momentum.
EXPIRING CATCH-UP EFFECTS SLOW DOWN RECOVERY IN THE SECOND HALF OF 2021
Economic confidence in Austria GDP
(standardised) (real, change in %, qoq and yoy)
3 12 12
2 9 5.1 9
6 2.6 4.0 6
1
3 3
0
0 1.4 0
-1 -3 -6.2 -3
Industry confidence
-2 Global industry confidence -6 -6
Forecast
-3 Consumer confidence -9 -9
qoq, seasonally adjusted
-4 Construction confidence -12 Annual average -12
Services confidence -15 yoy -15
-5 2018 2019 2020 2021 2022
2019 2020 2021
Source: Statistik Austria, UniCredit Research
UniCredit Research Page 8Focus Austria
Business cycle
The Austrian industrial miracle
The industry suffered a significant loss of production right at the beginning of the pandemic
due to the disruption of the global value chains. However, with the end of the first shutdown
in spring 2020, industry has continued to recover, which has not been interrupted by winter
restrictions. Since the third quarter of 2020, the industry has been the bright spot of the
Austrian economy, which has continuously contributed positively to the economy. In the
Industrial production already summer of 2021, domestic industry has already produced more than 2% more than before
exceeds pre-crisis levels in mid-
2021 the outbreak of the pandemic, while the overall economy is still around 3% below the pre-
crisis level due to the high backlog of services of around 8%.
Domestic industry has thus not only outscored the other sectors of the economy in Austria,
but also performed above average in international comparison. In the eurozone, especially in
Germany, output remained below the 2019 level in the summer of 2021.
The Austrian industry has thus continued a long-standing success story. Industrial output in
Austria grew by around 60% in real terms from 2000 to the end of 2019, compared with an
increase of only 10% in the output level of industry in the whole eurozone and around 30%
in Germany. What is impressive is that virtually all industrial sectors managed to achieve a
growth advantage over the eurozone, with mechanical engineering alone accounting for one
For 20 years, Austrian industry third of the overall growth lead. In addition, metal production, metal working and the
has also stood out in electrical and automotive industries also made an above-average contribution to the growth
international comparison with advantage.
higher growth, higher
employment rates, high While the number of employees in the eurozone industry has fallen by more than 10% since
productivity gains and high 2000, Austria's industry has been able to maintain its employment level broadly stable, as
competitiveness
the increase in industrial production was strong enough to compensate for the lower
personnel requirements per output unit, which were reduced by high productivity advances.
The stronger increase in hourly productivity compared to the eurozone allowed wages per
hour to rise at a similar rate. This did not lead to a deterioration in the competitive position
compared to trading partners. On the contrary, the unit labour cost position of Austria in the
property goods industry has improved since 2000 by more than 5% compared to trading
partners in the EU, and by around 2.5% compared to all trading partners.
You can read more details in our short analysis available in German only "Österreichs Indus-
trie in den letzten 20 Jahren – eine Erfolgsgeschichte", September 2021.
INDUSTRY IS DRIVING RECOVERY FROM THE PANDEMIC AND HAS BEEN PROVIDING ABOVE-AVERAGE GROWTH FOR 20 YEARS
Economic growth Industrial production
(with contributions from economic sectors in %) (2000=100, real, seasonally adjusted)
12 170
Agriculture Austria
10 160
Industry Euro area
8 150
6 Construction Germany
Services 140
4
2 130
0 120
-2 110
-4
-6 100
-8 90
-10
Q4 2019 Q1 2020 Q2 2020 Q3 2020 Q4 2020 Q1 2021 Q2 2021
Source: Statistik Austria, UniCredit Research
UniCredit Research Page 9Focus Austria
Labour market
Rapid recovery in the labor market since the beginning of 2021
■ On average, the rise and fall in the labor market, depending on pandemic measures, increased the unemployment rate in
2020 to 9.9% (national method) and 6.0% (Eurostat), respectively.
■ A marked easing since the beginning of the year, the unemployment rate at the beginning of the second half of 2021 was
reduced to 7.7% seasonally adjusted.
■ The improvement trend is losing momentum in the coming months, but after an average of 8.3% in 2021, the
unemployment rate will already reach pre-crisis levels in the course of 2022.
■ Focus: Why is the unemployment rate still above pre-crisis levels despite a record of employment?
Record unemployment due to the 2020 corona crisis, but surprisingly rapid improvement
The labour market was characterised in 2020 by a rapid climb and descent, characterised by
measures to contain the pandemic. After favourable labour market data at the beginning of
In the meantime, the corona the year, the first shutdown in the spring brought the unemployment rate to a peak of 12.7%
crisis raised unemployment in seasonally adjusted in April. As a result, the situation eased to rise slightly again at the end of
Austria to record levels
the year in the wake of the second pandemic wave. The annual average rate of
unemployment rose from 7.4% in 2019 to an average of 9.9% in 2020. According to the
Eurostat calculation, which has recently been slightly modified, the unemployment rate rose
from 4.8% in 2019 to 6.0%.
Since the beginning of the year, despite high infection rates and economic restrictions on
tourism, hospitality, personal services and trade, a clear trend towards improvement in the
labour market has prevailed until mid-May. The unemployment rate, which was 9.3% season-
The unemployment rate fell
significantly in the first half of ally adjusted at the beginning of the year, fell to 8.0% seasonally adjusted by the end of the
2021 despite economic first half of the year. Based on the recovery in construction and property production, employ-
restrictions ment has steadily increased. With the opening up of the service lines in May at the latest, the
employment level in the Austrian economy rose suddenly. In total, employment increased by
more than 200,000 people to 3.8 million in the first six months, of which around 200,000 are
still included in the current short-term work model. In the same period, the number of job
seekers fell by around 170,000 to around 290,000. The gap between employment and unem-
ployment is due to an increase in labour supply, which is due exclusively to the increase in
foreign workers, while the number of domestic workers decreased slightly.
A MARKED IMPROVEMENT IN THE LABOR MARKET, BUT RECORD VACANCIES INDICATE A SKILL PROBLEM
Unemployment rate and employment Labour supply and vacancy rate
(seasonally adjusted figures) (absolute resp. in %)
Employees 4,200,000 3.5
4,000,000 14
Unemployment rate (in %) - right-hand scale Labour supply (absolute, seasonally adjusted)
3,950,000 13
4,100,000 Vacancies (in % of the labour supply) 3.0
3,900,000 12
3,850,000 11 4,000,000 2.5
3,800,000 10 3,900,000 2.0
3,750,000 9
3,700,000 8 3,800,000 1.5
3,650,000 7 3,700,000 1.0
3,600,000 6
3,600,000 0.5
3,550,000 5
3,500,000 4 3,500,000 0.0
Jan-19 Jul-19 Jan-20 Jul-20 Jan-21 Jul-21 Jan-10 Jan-12 Jan-14 Jan-16 Jan-18 Jan-20
Source: AMS, Statistik Austria, UniCredit Research
UniCredit Research Page 10Focus Austria
Labour market
Unemployment is expected to reach pre-crisis levels in the course of 2022
At the beginning of the summer, the improvement trend in the Austrian labour market
accelerated once again. At the end of August, the unemployment rate fell to a seasonally
adjusted 7.8%, thanks to a good booking situation in many tourist centres - except cities. This
means that the unemployment rate is just under half a percentage point above the pre-crisis
No long-term consequences for
the Austrian labour market are level.
to be expected as a result of the The crisis intervention policy during the pandemic, with the focus on short-time work, has ob-
pandemic
viously performed well on the Austrian labour market. In the current economic recovery, the
situation on the labour market is improving surprisingly quickly and negative long-term struc-
tural consequences seem largely to be out of place. Given that the recovery is maintaining its
pace, the average unemployment rate of 9.1% for H1 2021 in Austria is likely to drop to an
average of 8.3% for 2021 as a whole. In the coming year, the pace of improvement will con-
tinue at a much slower pace. For 2022, we expect the unemployment rate to fall to an aver-
age of 7.6%, with the unemployment rate expected to return to pre-crisis levels in the course
of 2022. According to the Eurostat method, we expect the unemployment rate to fall to 6.4%
in 2021 and to 5.2% in 2022.
IN ADDITION TO A SHORTAGE OF PROBERLY QUALIFIED PEOPLE, THERE IS ALSO AN ABUNDANCE OF LOW-SKILLED WORKERS
Job ranking rate (unemployed/open position) Job ranking rate (unemployed/open position)
(occupational groups with lowest number of vacancies)* (Occupational groups with highest job rankings)*
8 7.1
2.0 6.3 6.6
1.5 1.6 1.6 6.0
1.5 5.3
6 4.5 4.6
1.5 1.1 3.9 4.1
0.9 1.0 1.0 3.4
0.9 4
1.0 0.7
0.5 2
0.0 0
Technicians data
Tinsmiths, plumbers
Mechanics
Cooks, kitchen
Mechanical engineers,
Machine operators,
Hotel and restaurant
Electricians
Wood processors
locksmiths, toolmakers
Lawyers, economic
Cleaning
directors, managers
Housekeepers, janitors
Building cleaners
Textile professions
Sales representatives,
admin. support occupat.
Scientists and related
Teachers, educators
Business owners,
assistants
Office occupations,
processing
advertising…
professions
advisors
professions
Blacksmiths,
electronics
stokers
*Professional groupsFocus Austria
Labour market
Why is the unemployment rate still above pre-crisis levels despite a record of employment?
The recovery of the Austrian economy from the double recession caused by the pandemic
has improved the situation on the labour market rapidly in the first half of 2021. The number
of unemployed workers in Austria rose to more than 3.8 million at the beginning of the
Convergence of supply and
demand on the Austrian labour second half of the year and thus almost reached the record level of the pre-pandemic
market has declined gradually in outbreak. In return, the number of jobseekers had fallen to 320,000 seasonally adjusted
recent years persons by July 2021, but this is still around 30,000 above the pre-crisis level. The reason for
the current increase in unemployment is formally the increase in labour supply to a new
peak of 4.15 million. The labour supply is thus almost 35,000 people above the pre-crisis
level, almost exclusively according to the additional number of unemployed.
Since the start of the pandemic, however, the Austrian labour market has not been able to
absorb even the reduced increase in labour supply, because after the collapse during the
pandemic, employment has not yet been able to catch up with the old growth trend. Thus, it
is not the increase in labour supply that is the cause of the unemployment rate, which is still
above pre-crisis levels, but the slow pace of employment growth. Given the pandemic, this
would not have been particularly noteworthy if it weren’t for the number of open vacancies
having also reached a record high during this time. While the average number of vacancies in
Qualification will be the central Austria between 2000 and 2015 accounted for less than 1% of the labour supply, this ratio
challenge of the labour market rose to up to 2% in the economic recovery from 2016 on. After the sharp fall during the
policy of the coming years pandemic, the number of vacancies increased to 2.5% of the labour supply by July 2021.
The current developments in the labour market indicate a worsening of the problems of
matching skills between supply and demand in the domestic labour market. An analysis at
the occupational group level shows that by mid-2021, the job ranking number – the number
of unemployed in a notified vacancy – in 15 out of a total of almost 80 groups is below or
equal to 1.5, which is considered as the criterion for the designation as a shortage profession
in Austria. The situation is particularly dramatic in occupational groups with more vacancies
than people looking for jobs nationwide. These include a largely well-qualified workforce,
such as machine builders, technicians in the electronic sector, plumbers, installers, metal
processors and electricians.
The recovery of the Austrian labour market from the pandemic is, in our opinion, being
slowed by insufficient employment growth, which, given the record level of vacancies, is due
to a shortage of suitable workers. Unfavourable working conditions and low wages are only
to a limited extent to be seen as a cause, as long as the lack of properly qualified workers is
also confronted with an oversupply of workers with relatively low qualifications. In labour
market policy, it is now necessary to move quickly from crisis intervention during the
pandemic to an offensive, creative approach. Improving the convergence of supply and
demand on the domestic labour market will be the central challenge of the coming years.
Both labour market and education and migration policies and the training activities of the
business side are called upon here.
More details can be found in our short analysis available in German only "Achtung dringend!
Vorrang für Qualifizierung", August 2021
UniCredit Research Page 12Focus Austria
Inflation
Oil price-related inflation growth in 2021 remains a temporary trend
■ The pandemic-related oil price decline lowered inflation in Austria to 1.4 percent in 2020 on an annual average
■ Inflation in 2021 rose to up to 3 percent in late autumn 2021 due to higher oil prices, stronger demand pressure in service
sectors and partly limited supply and supply problems
■ Price increase will rise to an average of 2.4% in 2021 Without driving oil prices, inflation will fall to 2.1% in 2022 despite
slightly stronger demand pressure
■ ECB sees inflation rise as temporary and continues its supporting monetary policy
■ Focus: But in the long run, inflation will be higher, will it not?
From time to time, inflation has been determining the price of oil since the beginning of
2020
Inflation averaged only 1.4% in Inflation fell to 1.4% on average in 2020, the lowest since 2016. The main reason for the
2020 compared to the previous decline over the course of the year was the development of the oil price, which fell from
year almost 70 US dollars per barrel at the beginning of the year to even below 20 US dollars in
April as a result of the pandemic's demand decline. In 2020, the average price of crude oil was
around 43 US dollars or 38 euro per cash, which represented an average decline of 45%
compared to the previous year in euro. Without the dampening effect on the overall inflation
of 0.4 percentage points due to the fall in oil prices, inflation in Austria would have been 1.8%
due to price increases in the services sector despite lower demand during the pandemic.
However, it should be noted that the price survey during the last year's lockdowns must also
be carried out partly through trend updates.
In the first half of 2021, inflation in Austria began to rise rapidly, starting from below 1%, to-
Significant acceleration of wards 3% year-on-year. Inflation averaged 1.9% in the first six months. The main reason be-
inflation in the first half of hind the acceleration of inflation is the rise in crude oil prices, even slightly above the pre-cri-
2021, mainly due to an increase sis level of over 75 US dollars a barrel. The high price differential compared to the previous
in oil prices
year resulted in a correspondingly strong price-driving effect, which in the first half of the year
alone is responsible for an increase of almost 0.4 percentage points year-on-year. Moreover,
the opening up of the economy from the spring onwards has led to a stronger price rise on the
demand side. In particular, price increases in some personal services, in the hospitality sector,
in some commercial sectors and in the leisure sector have been reflected. In addition, the in-
crease in costs, due to capacity bottlenecks and supply problems in industry and construction,
has been transferred to consumer prices, albeit in a reduced form.
INFLATION DRIVEN BY OIL PRICE (ENERGY, TRANSPORT) AND PRICE INCREASES IN THE HOSPITALITY INDUSTRY IN 1H 2021
Inflation drivers in H1 2021 (Relative) inflation dampers H1 2021
Recreation&Culture 10.9
1.0 Influence on inflation in % 11.4
Education
1.0 Weight in the basket in % Misc. goods 6.9
8.9
18.9 Furnishing 4.4
Restaurants & Hotels 6.5
12.5 Health 4.1
5.6
21.1 Food 3.9
Transportation 11.3
13.8 Tobacco&Alc. 3.3
beverages 3.4 Influence on inflation in %
27.1 Clothing 1.8 Weight in the basket in %
Housing&Energy 4.8
18.7 -3.4
Communication
2.2
0 5 10 15 20 25 30 -4 -2 0 2 4 6 8 10 12
Source: Statistik Austria, UniCredit Research
UniCredit Research Page 13Focus Austria
Inflation
Inflation reaches a preliminary peak in autumn 2021
Inflation in Austria trended upwards during H1 2021 and remains above the 2% mark.
Inflation is expected to reach its peak in autumn, with values of 3%. We expect an average
price increase of 2.4% in 2021. In the coming months, despite price stabilisation in the
second half of the year, the higher oil price will continue to be the main cause of stronger
Oil prices and recovery are
expected to see an inflation rise inflation. We expect an average oil price of more than 55 euro per barrel in 2021, an increase
to 2.4% in 2021, with a slight of almost 50% on the previous year. With the oil price stable, inflation would only rise to 1.8%
easing in sight in 2022 on average during the economic recovery in 2021, despite upward pressure from higher food
and service prices.
We expect the rise in inflation to be essentially temporary. We expect inflation to slow down
from the turn of the year 2021/22, because first of all, there is no further upward pressure in
sight from oil prices – we even expect a slight fall in prices on the world market. Secondly, the
effect of price-driving supply bottlenecks in the construction and industrial sectors is expected
to taper off slowly. Thirdly, we are expecting only modest wage-side pressure. We therefore
expect inflation to decrease to 2.1% on average for 2022.
However, this means that inflation in Austria will be two more years higher than inflation in
the eurozone, for which we expect inflation values of 2.0% in 2021 and 1.5% in 2022. Since
2008, inflation has been consistently higher than in the eurozone. During this period, inflation
has risen by more than seven percentage points. The price increase in comparison to the
eurozone was above average for rents, healthcare services, restaurant and hotel services and
in the leisure industry.
Low base rates for longer?
The ECB's monetary policy
remains supportive The European Central Bank also estimates that the inflation increase is temporary, so that no
monetary policy response has taken place so far. The PEPP crisis paper programme will
continue at an unchanged pace in the third quarter, but within the ECB, the vote for a cut-off
or a run-off in March 2022 will be louder. However, a phasing out of PEPP in March 2022
would pose significant challenges, as not all countries will have reached pre-crisis levels by
then and the eurozone inflation forecasts for the monetary-policy-relevant time horizon will
remain almost certainly below the target. The need to obtain favourable financing conditions
would then require a substantial increase in the standard purchase programme.
In July 2021, the ECB changed its inflation target sustainable 2% in the medium term, giving
room for manoeuvre. An inflation rate that is at least temporarily "moderately above the tar-
get value" is expected to be accepted without any reaction. For the time being, we therefore
do not expect a change in the ECB's key interest rate (0.0%) or the deposit rate (-0.5%).
OIL PRICES FLUCTUATIONS CAUSE INFLATION TO RISE IN 2021 AND DECLINE IN 2022
Inflation Overall inflation versus core inflation (excl. energy)
(with effects resulting from goods contained in the basket) (in %)
3.0% Transportation Housing Food 3.0% 4 Influence of energy Overall inflation
2.5% Other effects Total CPI 2.5% 3 Core inflation (excl. energy)
2.0% 2.0% 3
2
1.5% 1.5%
2
1.0% 1.0%
1
0.5% 0.5% 1
0.0% 0.0% 0
Forecast
-0.5% -0.5% -1
-1.0% -1.0% -1
01/17 01/18 01/19 01/20 01/21 01/22 2019 2020 2021 2022
Source: ECB, Statistik Austria, Eurostat, UniCredit Research
UniCredit Research Page 14Focus Austria
Inflation
But in the long run, inflation will be higher, will it not?
The "pessimistic" view of the market and most economists about higher inflation over the
next five years faces a growing group of economists who expect a long-term end to the trend
of low inflation.
On the one hand, demographic trends are the arguments for the low inflation phase of
Development of labour supply is
crucial for long-term inflation recent years. The baby boom and the increasing participation of women in the labour market
trends triggered an increase in the working population in the industrialised countries, which limited
the possibility of wage and price increases. In addition to improved monetary policy through
inflation targeting, globalisation has contributed to the low inflation phase since the 1980s.
The integration of less developed countries – above all China – into the global labour and
goods market triggered inflationary processes despite strong economic growth.
These favourable conditions seem to be changing. If there is no greater integration of
currently strongly growing regions – Latin America and/or Africa – into the global division of
labour, the number of working-class people will increase in absolute terms, while at the
same time it is decreasing relative to the total population (dependency ratio). This could lead
to stronger inflationary tendencies in the medium term, as the "market power" of the
providers increases, including that of labour. The wage-price spiral would turn faster.
Inevitably, however, the trend does not have to be that way, because the development in
Japan teaches us that the decline in labour supply, due to the subsequent weakness in
demand, can even lead to deflationary tendencies. Japan's labour force has been decreasing
since the 1990s, but has managed to increase GDP per capita through productivity gains per
worker. Since 2000, Japan's GDP per capita has risen by an average of 0.9%, based on an
annual productivity increase of 0.7 percentage points.
From today's perspective, it is not possible to answer whether this will be possible even if a
large proportion of the industrialised countries undergo such a development. In the medium
to long term, inflation could be higher than it has been in recent decades. How monetary policy
deals with this will be one of the challenges of the coming decades, given the rise in debt.
UniCredit Research Page 15Focus Austria
Public budget
Fiscal policy supports economic recovery from the corona crisis
■ Fighting the corona crisis led to a record public deficit of 8.8% of GDP in 2020 and a rise in public debt to 83.5% of GDP
■ Strong economic recovery with a positive effect on budget implementation in the first half of 2021: The budget deficit will
remain below the official estimate, at around 6.5% of GDP for the full year
■ Public debt expected to rise to a record level of 85.6% of GDP by the end of 2021
■ Lower new debt means that total debt in relation to economic performance will fall again from 2022
■ Focus: Who is the largest debtor in the country?
Improvement in the budget situation after a record deficit in 2020
After two years of slight surpluses in public finances, the collapse of the economy as a result
of the coronavirus crisis has led to a huge fall in revenue. In addition, to cushion the impact of
the pandemic, it has also resulted in a shift to an expansionary fiscal stance that has led to
After two years of budget sur- significantly increased spending. The various relief measures in connection with the
pluses, the 2020 coronavirus cri-
sis caused a record depletion in pandemic, such as the short-term work model, hardship fund and revenue replacement as
the public budget well as tax cuts, had an impact on the federal budget alone with additional financial burdens
of over 20 billion euro. The general government budget deficit reached a record level of 33.2
billion euro in 2020, or 8.8% of the GDP.
The available data on the federal budget for the first half of 2021 already show positive
effects of the economic recovery that was strongly implemented in the spring. Deposits are
almost 13% higher than in the previous year. Among other things, this is a result of the sharp
increase in tax revenues of over 15% year-on-year. Revenue from all major taxes has
Strong recovery has a positive increased significantly, particularly income tax and corporation tax. In addition, the
impact on budget employment sector has also seen a significant increase in the unemployment insurance due
implementation in 2021
to the good employment performance of the past months. In total, payments at the end of
June already accounted for more than 53% of the budget plan for the full year 2021 (pre-
crisis level 2019: 48.2%). Despite the strong increase in the first half of 2021 by almost 15%
year-on-year, payments in mid-year are still just below 50% of the budget plan and thus at
pre-crisis levels. Additional payments were made mainly in the areas of work (higher use of
short-time work), federal assets, due to payments to COFAG for sales compensation, fixed-cost
compensation etc. as well as health for various COVID-19 measures (procurement of antigen
tests, masks).
ECONOMIC RECOVERY IS BEGINNING TO HAVE A POSITIVE IMPACT ON THE PUBLIC BUDDGET
Tax revenues Budget deficit
(change in %, yoy) (in % of GDP)
112.4 0.6
120 0 0.2
1-12/2019 1-12/2020 -0.8
100
1-6/2021 -2
80 63.0 -3.0
60 -4
Social insurance
40 -6
15.1 15.4 Municipalities (incl. Vienna) -6.5
20 4.8 5.4 9.5
2.4 2.4 3.0 Federal states
-8
0 Republic of Austria -8.8
-20 -4.3
-8.3 -10.0 -10 Total
-40 -39.5 -32.5
Income tax Payroll tax Corporate VAT Taxes total -12
tax 2017 2018 2019 2020 2021 2022
Source: BMF, Statistik Austria, Eurostat, UniCredit Research
UniCredit Research Page 16Focus Austria
Public budget
The budget deficit for 2021 is expected to be lower than planned
Despite the partly higher expenditure on various relief measures in the first half of the year,
We expect the budget deficit to the favourable development of revenue with the continuation of the economic recovery in the
be lower than planned in 2021, second half of the year suggests a better than originally planned budget result for the full year
at 6.5% of the GDP, thanks to 2021. The official draft budget for 2021 was adopted in October 2020 in Parliament with a
stronger growth and higher
inflation deficit of 7.1% of the GDP, taking into account a growth forecast of 2.8% in real terms and an
inflation rate of 1.3%. However, we estimate that economic growth will be stronger at 4% and
that our inflation expectations will be higher at an average of 2.4%. We therefore expect the
general government budget deficit to fall in 2021 to around 6.5% of the GDP or 26 billion
euro.
We expect a further significant decline in new debt in 2022, assuming an economic
normalisation and, consequently, the expiry of all special pandemic support. However, we
assume that the Austrian government will maintain an expansionary fiscal rate to support the
economy or that additional expenditure will continue to be necessary, among other things, in
labour market policy. The current strategy report provides for a budget deficit of 3.5% for
2022. We assume that, due to the likely favourable economic development, the budget deficit
Public debt rises to record levels can be limited to 3% of GDP in line with Maastricht, even though the government has already
at the end of 2021, but low announced a tax reform that provides for a reduction in the tax on wages and income.
interest rates make debt service
easier Due to the more favourable development of new debt, the total debt will increase less than
previously expected from us. Nevertheless, at the end of 2021, with a public debt of 84.6%
of the GDP, an all-time high will be reached. However, the decline in new debt from 2022
should also reduce the level of debt relative to economic performance. Despite the increase
in total debt, the Austrian government's debt service will be even more favourable than in
previous years due to adequate debt management and the continuing low interest rate. For
2021 and 2022, we expect an interest charge of less than 5 billion euro per year or less than
3% of public revenue from taxes and levies.
PUBLIC DEBT AS A PERCENTAGE OF GDP IS EXPECTED TO FALL AGAIN FROM 2022
Public debt Regional debt in Austria
(in % of GDP) (Federal states and municipalities per federal state
Social insurance Municipalities Federal states
100 8000 25
Republic of Austria Total 85.6 6,731 6,672
83.5 82.5 per capita in % of GDP
90 78.5 7000
74.0 5,654 20
80 70.5 6000
70 19.4 4,438 4,468 4,532
5000 18.2 15
60
4000
50 14.7 14.6 2,741 2,783 2,777
3000 10
40 2,111
10.7
30 2000 8.9 5
20 1000 6.3 6.1 5.5 4.8
10 0 0
0 LA C ST B VIE UA V S T ø or
2017 2018 2019 2020 2021 2022 total
LA..Lower Austria, C..Carinthia, ST..Styria, B…Burgenland, VIE…Vienna, UA…Upper Austria, V…Vorarlberg, T…Tyrol
Source: Statistik Austria, Refinitiv Datastream, UniCredit Research
UniCredit Research Page 17Focus Austria
Public budget
Who is the largest debtor in the country?
In the corona year 2020, public debt in Austria rose by almost 35 billion euro to over 315
billion euro. By far the largest part of 86.6% is attributable to the federal government. The
proportion of the states is just over 7%, the share of the municipalities is 3%. At the end of
Lower Austria before Vienna and
Styria with the highest absolute 2020, the municipality of Vienna, which is also a federal state, had a debt of 8.5 billion euro,
debt or 2.7% of the total public debt in Austria (the rest is accounted for)
The social security institutions). In absolute terms, Vienna is thus the state with the highest
debt, behind the lower Austria region (11.3 billion euro). The state with the lowest absolute
debt is Vorarlberg, with only 1.1 billion euro, whereby we have added together the debts of
the states and of the municipalities in the respective federal state in order to make an
undistorted comparison with Vienna (municipality and federal state).
However, in view of the very different size, a comparison of absolute debt is not a good thing.
Per capita and in relation to
GDP, Vienna is improving into In relation to the population and economic strength, Vienna is rising from the penultimate
the middle ground. position to the middle ground thanks to the highest number of inhabitants and the highest
economic performance in Germany. Lower Austria, the state with the highest debt per capita,
and also in relation to GDP before Carinthia and Styria, remains at the very end of the list.
The western federal states of Salzburg, Tyrol and Vorarlberg have the lowest debt figures,
both in absolute and relative terms. Whereas Salzburg was the only federal state to reduce
the country's debt in the previous year, according to the Maastricht definition, Tyrol and
Vorarlberg suffered particularly strongly from the pandemic in 2020 and recorded the
strongest increases in debt. In Tyrol, debt has increased from 1.1 to 1.6 billion euro, i.e. by
Lower Austria also relatively the
tail light, Tyrol and Vorarlberg more than 40%, and in Vorarlberg from 0.9 to 1.1 billion euro, or almost 20%. In Vienna, too,
with the strongest deterioration the increase was very high, with almost 15% as a result of the pandemic.
in 2020
The year 2021 will lead to a high level of new debt for both the federal states and the mu-
nicipalities due to the ongoing pandemic. As a result, the total debt will continue to rise sig-
nificantly not only in the federal government, but also at the regional level. We expect an in-
crease of around 3.5 billion euro for the federal states and municipalities together. The total
debt of the regional units thus rises to over 43 billion euro or 11% of the Austrian GDP. The
ranking of the federal states is not expected to change.
UniCredit Research Page 18You can also read