SEREMAS: SELF-RESILIENT MOBILE AUTONOMOUS SYSTEMS THROUGH PREDICTIVE EDGE COMPUTING
←
→
Page content transcription
If your browser does not render page correctly, please read the page content below
SeReMAS: Self-Resilient Mobile Autonomous
Systems Through Predictive Edge Computing
Davide Callegaro: , Marco Levorato: and Francesco Restuccia˚
:
Donald Bren School of Information and Computer Sciences, University of California at Irvine, United States
˚
Department of Electrical and Computer Engineering, Northeastern University, United States
e-mail: {dcallega, levorato}@uci.edu, frestuc@northeastern.edu
Abstract—Edge computing enables Mobile Autonomous Sys- travel between destinations with little to no human control.
tems (MASs) to execute continuous streams of heavy-duty To achieve this complex endeavor, MASs necessarily require
mission-critical processing tasks, such as real-time obstacle detec- the continuous, real-time execution of streams of computation-
tion and navigation. However, in practical applications, erratic
patterns in channel quality, network load, and edge server load expensive tasks. For example, self-driving cars have to contin-
can interrupt the task flow’s execution, which necessarily leads to uously build detailed 3D maps of the surrounding areas, and
severe disruption of the system’s key operations. Existing work use them to categorize different navigation features such as
has mostly tackled the problem with reactive approaches, which blockages, intersections, driveways, or fire hydrants. Moreover,
cannot guarantee task-level reliability. Conversely, in this paper autonomous drones are always at risk of sudden and significant
we focus on learning-based predictive edge computing to achieve
self-resilient task offloading. By conducting a preliminary exper- drift due to adverse weather conditions, loss of power and/or
imental evaluation, we show that there is no dominant feature GPS connectivity. Therefore, the seamless fusion of multimedia
that can predict the edge-MAS system reliability, which calls sensor data for real-time path planning is quintessential for the
for an ensemble and selection of weaker features. To tackle the drone’s survival.
complexity of the problem, we propose SeReMAS, a data-driven
optimization framework. We first mathematically formulate a Motivation and Problem Setting. Offloading the stream
Redundant Task Offloading Problem (RTOP), where a MAS may of tasks generated by the MASs to edge servers can extend
connect to multiple edge servers for redundancy, and needs to battery lifetime and reduce task round-trip time delay [4].
select which server(s) to transmit its computing tasks in order However, strong assumptions such as perennial stability of
to maximize the probability of task execution while minimizing
channel and edge resource utilization. We then create a predictor high-capacity communication links do not apply in the highly-
based on Deep Reinforcement Learning (DRL), which produces dynamic context of MASs, where wireless links are bound to
the optimum task assignment based on application-, network- and exhibit erratic behavior even in very simple scenarios. This
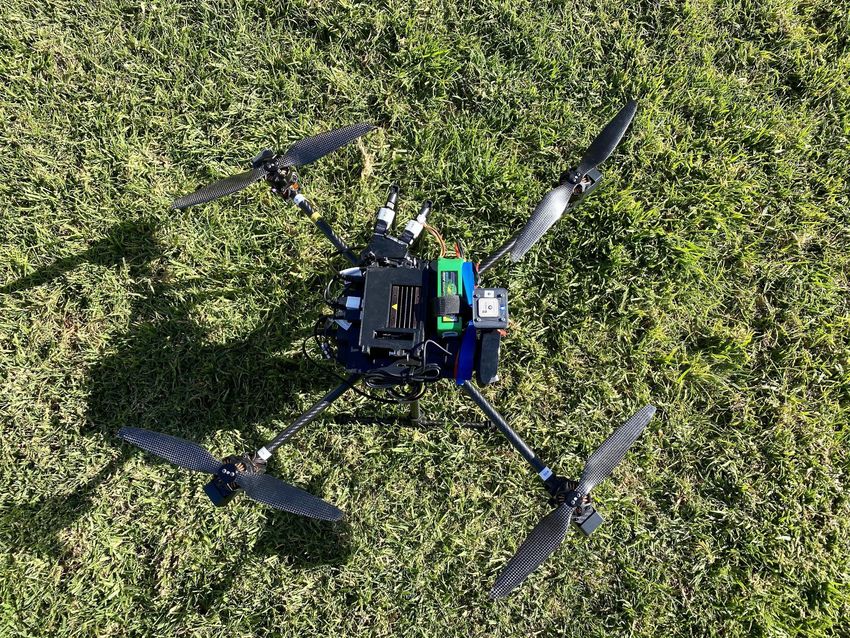
telemetry-based features. We prototype SeReMAS on a testbed key problem is further exacerbated in larger MASs and urban
composed by a Tarot650 quadcopter drone, mounting a PixHawk deployments, where parameters such as server and network
flight controller, a Jetson Nano board, and three 802.11n WiFi
interfaces. We extensively evaluate SeReMAS by considering load may induce more system instability.
an application where one drone offloads high-resolution images
for real-time analysis to three edge servers on the ground. Edge 1 Edge 2 Edge 3 Min Delay
Experimental results show that SeReMAS improves the task 0.4
execution probability by 17% with respect to existing reactive-
Task-level delay [s]
based approaches. To allow full reproducibility of results, we
share the dataset and code with the research community. 0.3
I. I NTRODUCTION
0.2
Mobile Autonomous Systems (MASs) such as self-driving
cars and drones are disrupting the wireless, embedded and
computing manufacturing industries, with unprecedented reper- 0.10 10 20 30 40 50
Time [s]
cussions on agriculture, film making, surveillance and urban
mobility, among others. According to a study by PwC, the Fig. 1: Example of task level delay from a flying drone to 3
current global market value for drones is estimated to be over edge servers, transmitted over WiFi 802.11n in a 50s interval.
$127 billion [1], while it is expected that North America’s In this paper, we tackle the challenging problem of providing
self-driving car market will expand at a CAGR of 50.8% task-level performance guarantees to a stream of computing
with a global revenue of $49.79 billions by 2024 [2]. Thus, tasks generated by an airborne MAS. Specifically, we impose a
it is no wonder that Mobile Autonomous Systems (MASs) bound on the maximum time between data acquisition and the
have captured the interest of academia and industry, now completion of the corresponding analysis task. We remark how
rushing to research and develop MASs-related devices and a task-level perspective is necessary in this class of systems,
technologies across many different facets [3]. Characterized where temporally local degradation of task delay can severely
by the abundance of rich sensors (e.g., cameras, radars, and harm control loops in MASs. Figure 1 shows the temporal
GPS), coupled with fifth generation (5G) wireless networking pattern of the end-to-end application delay (the different curves
and advanced mobility, MASs are unique devices that can are different edge servers) obtained through our experimental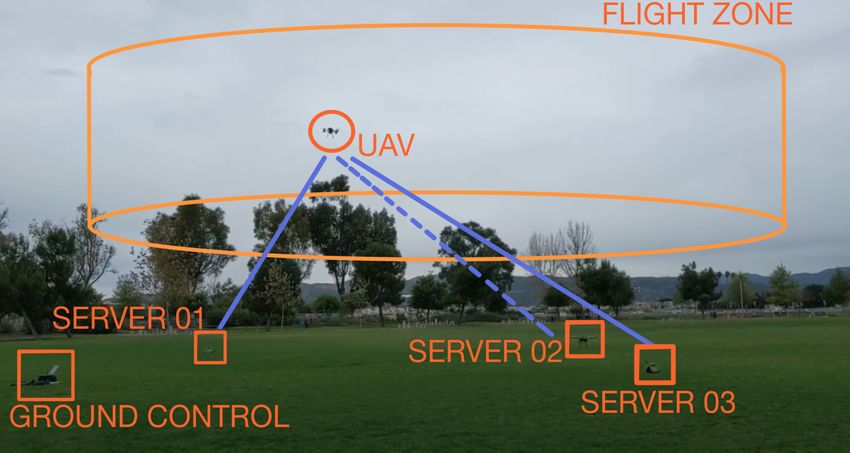
drone testbed described in Section V-A. We can observe that
the delay exhibits significantly time-varying patterns, with a
standard deviation 0.14 and a peak-to-peak difference reaching
0.43, which is 241% of the average value of 0.178s. We
note that the experimental setting is in Line Of Sight (LOS),
and that more convoluted propagation environments would
just aggravate this problem. A bound on the average delay
would not guarantee that the task-level delay will be below
a certain threshold for each of the tasks belonging to the
task stream, which is key to guarantee correct functionality of
stream-oriented edge-based MASs.
                                                                      Fig. 2: Our Architecture for Task Offloading in MASs.
   Our vision is simple: the seamless usage of edge resources
by MASs necessarily requires techniques able to mitigate the capture. Some of the features – e.g., application and most
impairments and erratic temporal patterns induced by the network-related features – become available only if a resource
surrounding communication and computing ecosystems and is used. For instance, if a channel/edge server pipeline is not
the physics of the system itself. Existing work – discussed in selected for a task, then the corresponding delay is not observed,
detail in Section VI – has tackled the issue of MASs reliability which motivates the adoption of a DRL-based approach. By
in a piecemeal and often highly abstract fashion, by focusing including future rewards in action selection and taking as
on static optimization of either mobile device’s trajectory [5–8] input unprocessed features such as RSSI, end-to-end delay,
or communication resources [9–11]. In Sec. V-A, we show that inertial measurement unit (IMU) and global positioning system
edge selection methodologies based on channel quality would (GPS) coordinates, the DRL algorithm will implicitly embed the
fail, and we conclude that new task offloading strategies are impact of current computing pipelines selection on the efficacy
needed to stabilize task completion delay in MASs.                of future decisions, as well as real-world phenomena that can
   To address this challenging problem, we developed SeRe- be hardly modeled through explicit mathematical terms.
MAS – Self-Resilient Mobile Autonomous Systems – a Novel Contributions
framework whose core is a dynamic task replication mechanism,
                                                                     ‚ We design SeReMAS, a framework for the dynamic
where individual tasks are replicated and sent over multiple
                                                                  control of task offloading in MASs with extreme temporal
channel/edge server resources. The key intuition is that the
                                                                  variations (Section III). SeReMAS is based on a preliminary
task delay experienced by the MAS will be the minimum delay
                                                                  experimental analysis (Section II-A), which indicates that there
of each replica. Thus, the larger the number of channel/edge
                                                                  is no dominant feature, including obvious features such as
couples, the greater the probability that one task will satisfy
                                                                  channel quality, and that prediction necessitates an ensemble
the delay requirement, which however also implies increased
                                                                  of weaker features. We first mathematically formulate (Section
resource usage. The objective of SeReMAS is to minimize
                                                                  III-B) a Redundant Task Offloading Problem (RTOP). Then,
resource usage under the constraint that the probability that
                                                                  we create predictors that can help managing the resource
the task-level delay bound will be met.
                                                                  usage/performance trade-off. Specifically, we propose a myopic
   Our Approach. To drive our design, we implemented a predictor as baseline (Section III-C) and a DRL-based approach,
testbed composed by an airborne MAS and multiple ground which operates on a set of features from application, network
servers (Section II). Specifically, we extracted a rich dataset and device-level components (Section III-D). To the best of
from the system (Section V-A), whose analysis demonstrates our knowledge, SeReMAS is the first framework addressing the
a lack of variables strongly correlated with the delay (Section problem of redundant task offloading in MAS with a data-driven
II-A). We show that the received signal strength indicator approach which efficacy is verified in a real-world testbed and
(RSSI), one of the key variables used to control connectivity with replicable dataset-based experiments.
and offloading, has limited influence on the delay. The dataset      ‚ We prototype SeReMAS on a drone-based experimental
illustrates how in real-world MAS systems the delay pattern testbed (Section IV). The platform embeds a module for the
is the result of a wide variety of complex cross-variable real-time analysis of features, including the flight controller,
interactions at various temporal scales. Importantly, influential tied to internal data routing control. As part of our prototype,
variables are outside the network layers, and include physical we design a strategy to make the state representation compact
variables such as orientation, acceleration and tilt.             (Section IV-B), and thus lower the complexity of the DRL agent,
   Based on this considerations, SeReMAS embeds a predic- using an iterative feature selection procedure. We consider
tive core based on Deep Reinforcement Learning (DRL) to a real-time image analysis application through state-of-the-
determine a compact set of computing pipelines dynamically art edge-assisted object detection algorithms where a drone
assigned task-by-task based on the perceived state of the system. periodically acquires from onboard sensors data whose analysis
Fig. 2 depicts the high-level schematics of SeReMAS. The key is offloaded to edge servers on the ground (Section V-A). We
intuition is that the selected set of channel/computing resources let the drone perform task offloading through multiple WiFi
will influence future decision making, which DRL is able to interfaces, and collect a total of 140 minutes of flying. The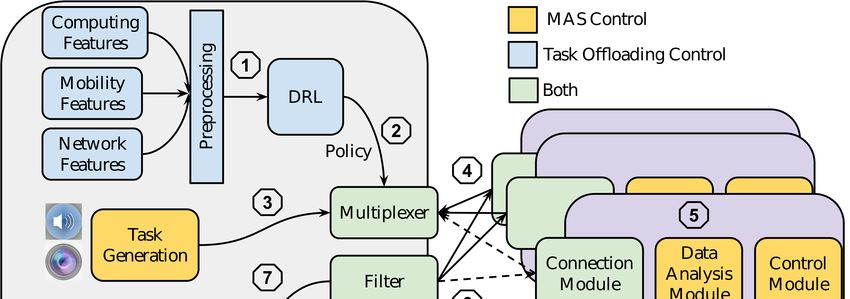
dataset and the code produced as part of this paper can be                                  1.0                                                                               1.0

                                                                   Cumulative Density Function

                                                                                                                                                     Cumulative Density Function
found at [12].                                                                              0.8                                                                               0.8
                                                                                            0.6                                                                               0.6
   ‚ Through experiments, we show how different subsets                                     0.4                                                                               0.4
of features appear dominant at different time-scales (Section                               0.2
                                                                                                                                       Edge 0
                                                                                                                                       Edge 1                                 0.2
                                                                                                                                                                                                                       Min delay
                                                                                                                                                                                                                       Max RSSI
V-B). We also show in Section V-C how the DRL approach                                      0.0
                                                                                                                                       Edge 2
                                                                                                                                                                              0.0
                                                                                                                                                                                                                       Avg. delay
                                                                                             0.100 0.125 0.150 0.175 0.200 0.225 0.250 0.275 0.300                             0.100 0.125 0.150 0.175 0.200 0.225 0.250 0.275 0.300
improves by 17% the task execution probability with respect to                                                     Delay [s]                                                                          Delay [s]

a reactive approach [13], thanks to the ability to manage state
                                                                                                                   (a)                                                                              (b)
uncertainty in the action selection problem, measured in terms
of probability of meeting a delay requirement per amount of       Fig. 3: Cumulative density function of delay (a) for each edge
resource used, with respect to a myopic controller based on a     server and (b) selecting the minimum delay, or the one with
one-shot selection of the next set of edge servers to be used.    maximum RSSI, or the average of the available delays.
                     II. P RELIMINARY E XPERIMENTS
                                                                     convoluted interdependencies between protocol variables at the
   In our setting, a MAS is connected to N edge servers various layers and the physical and hardware properties of the
es1 , es2 , . . . , esN through separate wireless channels. The system at multiple time scales.
device generates a sequence of tasks t1 , t2 , t3 , . . . with fixed    We remark this important aspect by plotting in Fig. 4 the
inter-arrival time equal to T seconds. A task is described as a (delay, RSSI) and (delay, distance) mean and one standard
chunk of data to be processed with a predetermined analysis deviation of the delay as a function of the two other variables.
algorithm to produce an output. We assume that tasks are We can see the lack of a strong correlation between the
homogeneous, meaning that the amount of data associated delay and both RSSI and distance and emphasize again how
with any task and the analysis algorithm are fixed. Let us experimental results unveil effects and interactions that are
define δn pti q as the capture-to-output delay of task ti executed rarely captured in simulations and models.
as edge server esn , defined as the time from the generation of
the task to the availability of its output at the edge server. The
                                                                                                     0.30
delay δn pti q is the composition of two delays: the transmission      0.30
          comm                                     comp                0.25                          0.25
delay δn            pti q and the computing delay δn pti q. In real-
                                                                  Delay [s]

                                                                                                                                                     Delay [s]
world settings, both components are highly stochastic, and             0.20                          0.20
                                                                       0.15
depend on a number of latent variable, parameters as well as                                         0.15
                                                                       0.10
states of protocols at various layers of the stack.                         10 15  20 25 30 35  40        40  50    60    70     80
                                                                                                              Distance from Edge [m]                                                                 Link Quality

A. Preliminary Analysis
                                                                                                                   (a)                                                                              (b)
   We motivate our study by analyzing the data obtained from
real-world experiments. We consider an experimental setting, Fig. 4: Distribution of task level delay as a function of distance
described in detail in Section V-A, where a drone is offloading from each of the edges and the RSSI.
image processing tasks to three edge servers. Fig. 1 shows
a section of the temporal pattern of the task-level delay δt                    III. T HE S E R E MAS F RAMEWORK
at the three edge servers. We observe that the delay signals         The results illustrated in the previous section emphasize
alternate low-delay (150 ´ 175ms) sections with spikes and the need for new techniques boosting the reliability of edge
higher delay sections. While some mild correlation between offloading for extreme real-time applications. In this section,
the delay signals is present, the minimum of the three signals we present SeReMAS, a data-driven framework addressing
provides the needed stability to the delay. Fig. 3.a shows the the reliability of task offloading in MAS. We first present
Cumulative Density Function (CDF) of the task-level delay δt an overview of the main system blocks and functionalities in
for the three edge servers in our experiments. Note that in our Section III-A. Then, we formalize the learning-based redundant
scenario the task execution delay δ comp is nearly deterministic. task offloading control problem in Section III-B.
We remark that all the edge servers are within coverage, and
that all the links are in Line of Sight (LoS). Most delays are A. SeReMAS: A Walkthrough
in the range 120ms to 250ms, with about 40% of the delays            SeReMAS [12] enables the data-driven control of task
below 135-145ms.                                                  offloading from the MAS to the edge servers. The architecture
   Fig. 3.b shows the distribution of the minimum delay δmin of SeReMAS is depicted in Fig. 5, where we show the modules
with respect to the cdf of the average delay and the delay performing mobility control of the MAS (yellow) and control
associated with the edge server with the maximum channel of task offloading (blue), and the modules – multiplexing and
quality index (RSSI). We observe that there is a noticeable filter – handling the communication between the section of the
difference between the minimum delay and the delay offered by platform at the MAS to the section at the various edge servers.
the edge server with the best channel quality. Therefore, even       We now provide a walk-through of the main operations
a perfect SNR-based handover would fail to provide optimal performed by SeReMAS, following the steps indicated in
performance in this context. This effect is the result of the Fig. 5. First, the framework takes computing features (e.g.,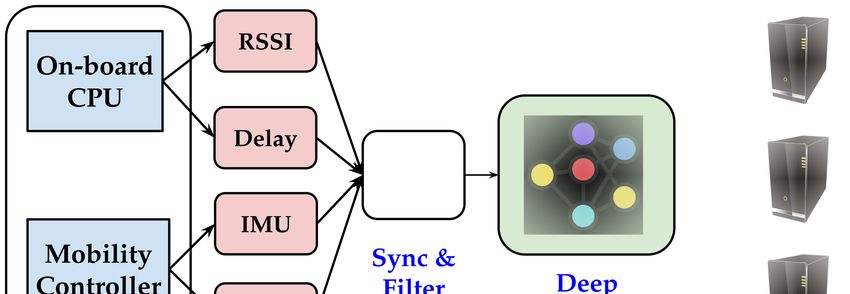
whose objective is to determine the sequence of edge servers
                                                                   φ˚ “rφ˚t1 , φ˚t2 , . . .s solving the following optimization problem:
                                                                               arg min Ei r|φi |s                                      (2)
                                                                                     φ
                                                                                    s.t. Ei rI pδmin pti q ą δ ˚ q |φi s ă ∆,          (3)
                                                                   where I p¨q is the indicator function and expectation is computed
                                                                   over the task sequence. This formulation is different than impos-
                                                                   ing a constraint on the average delay, i.e., Ei rδmin pti q|φi s ă δ ˚ .
                                                                   The latter formulation would allow a possibly large number of
                                                                   delays above δ ˚ , while our formulation is equivalent to
Fig. 5: SeReMAS system architecture: two different control                        arg min E r|φt |s                                    (4)
                                                                                         φ
cycles intersect at the communication modules, where the DRL
agent’s policy is applied by means of task replication.                                  s.t. P pδmin ptq ą δ ˚ |φt q ă ∆.             (5)
                                                                   Thus, we impose a constraint on the probability that the task
                                                                   completion time is above a threshold δ ˚ while striving to
CPU, GPU, and RAM utilization), mobility features (e.g.,           minimize resource usage.
accelerometer, gyroscope, GPS coordinates, etc), and network          Intuitively, the larger the number of edge servers selected,
features (e.g., TCP state, RSSI) and applies pre-processing        the larger the probability that the minimum of the delays
(step 1) to construct the input to a DRL model (see Section        is below the threshold. However, the inevitable limitations
III-B for details). The extracted features and the composition     on channel access and maximum edge server load leads
of the state space are described in Section IV-B. Then, the DRL    to a task-level selection problem, where the number and
state is given as input to the DRL algorithm, which outputs φ,     members of the chosen set is informed by the uncertainty
the set of edge servers to be used as task executors (step 2).     regarding future delays and their expected values. In real-
   Tasks are generated (step 3) according to the current MAS       world settings, the resolution of the RTOP defined above
needs (e.g., multimedia classification), and handled by module     necessitates the consideration of complex inter-variable and
called multiplexer (step 4) which handles task replication         temporal interdependencies. For this reason, we resort to data-
across multiple edge servers. Specifically, the multiplexer is     driven solutions methodologies decomposing the problem into
responsible for replicating and forwarding the tasks to the edge   sequences of local problems.
servers, and is directly controlled by the output φ of the DRL
algorithm. The tasks are sent to the edges specified by φ, which   C. Myopic-based Baseline for RTOP
are then executed (step 5). The knowledge produced by the             First, we formulate a myopic predictive solution to address
task execution can be used to drive control decisions on the       the RTOP. We introduce the notion of state of the system
MAS. For example, in our prototype we use the task result to       si “ tsi,n un“1,...,N , where si,n is the feature matrix
control the mobility of the MAS, as explained in Section IV.                      »                                       fi
                                                                                    ψ1,i´L`1,n . . . ψ1,i´1,n ψ1,i,n
The related control messages generated by the edge server(s)                      — ψ2,i´L`1,n . . . ψ2,i´1,n ψ2,i,n ffi
are sent back to the MAS, and processed by the filter module               si,n “ —                                   .. ffi , (6)
                                                                                  —                                       ffi
                                                                                           ..       ..
(step 6), which eliminates replicated messages when more than                     –         .        .      ...        . fl
one edge server is selected to avoid the re-execution of flight                      ψF,i´L`1,n         ...   ψF,i´1,n   ψF,i,n
commands. Finally, the control messages are fed to the control
                                                                   of F ˆL features, and ψf,j,n is f ´th feature referring to task j
actuator (step 7), which takes care of implementing the control
                                                                   and computing pipeline n. We describe the specific features and
action, if needed (e.g., flight control).
                                                                   dataset in the Section IV-B. We train a probabilistic predictor
                                                                   as the function pi`1,n “ σpsi,n q, where
B. Redundant Task Offloading Problem (RTOP)
                                                                                     pi`1,n “ P pδn pti`1 q ą δ ˚ q .                  (7)
   As part of the SeReMAS framework, we investigate the
problem of redundant task offloading to replicate tasks and          We find the set φi`1 with minimum cardinality such that
send them over multiple channel-edge server pipelines for                            `                  ˘
                                                                                   P δti`1 pφi`1 q ą δ ˚ ă ∆,             (8)
increased reliability, which we call RTOP. This problem will
drive our DRL design. We define the capture-to-output delay        where the left-hand term is computed as
as the minimum of the delays associated with the task replicas:                            ź
                                                                                       1´       p1´pi`1,n q.                           (9)
                                                                                               nPφi`1
                δti pφi q “ mintδn pti q : nPφi u,           (1)
                                                                   When more than one set with the same cardinality satisfies the
where φi Ďt1, . . . , N u is the subset of edge servers to which   constraint, then the one with the smaller probability is chosen.
a replica of task ti is sent. Then, we define a controller         We note that stronger predictors σp¨q may lead to a reduced
resource usage, as they would lead to reduced uncertainty in the
class of the next delay (above and below threshold), and thus
would allow the controller to bet on fewer remote computing
pipelines. For example, let us assume that at least one of the
pipelines has a next delay below threshold: an accurate and
confident predictor returning probability 1 would allow the
selection of only one edge server.
   We extend the predictor to larger temporal windows to
evaluate the predictive power of features blocks. We define
                           pW,y
                            i`1,n “ σpsi,n q                    (10)
where
                          ˜                             ¸
                            W ´1
                             ÿ                                          Fig. 6: Training architecture using Double Deep Q-Learning.
            pW,y
             i`1,n   “P                           ˚
                                    I pδn pti`` q ą δ qěy ,     (11)
                              `“0
                                                                        current policy. The Q-values guide the selection of the actions
that is  pW,y is the probability that at least y tasks will be
          i`1,n                                                         according to the rule:
completed with delay larger than δ ˚ in a window of W future                         #
tasks. We build a binary classifier from σp¨q by setting                                argminφi Qpsi , φi q with prob. 1 ´ t
                                                                             φi`1 “                                                (18)
                                                                                        UpPpφqzHq            with prob. t
                                       C1   1
                              pW,y
                               i`1,n ż                          (12)         where the best action (that is, subset of servers) is selected as
                                       C0   2
                                                                             the one maximizing the future reward with probability 1 ´ ,
D. Deep Q-Learning Approach for RTOP                                         and selected uniformly at random with probability . This is
   The formulation above produces suboptimal control se- commonly known as a -greedy strategy, it is often used in
quences. Thus, we adopt a Deep Q-Learning formulation to practical problems to balance exploration/exploitation in DRL
resolve the optimization problem. This formulation implicitly problems.
accounts for the impact of current decisions on the distribution
of future states (and thus on the accuracy of control). In this                                  IV. S E R E MAS P ROTOTYPE
case, the predictive function is defined to return the Q-values                 We first describe the platform experimental components in
based on the state, that is,                                                 Section IV-A, and then describe our feature selection process
                                                                             in Section IV-B. Finally, we explain how we implemented the
                   Qpsi`1 , φi`1 q “ σDRL psi q,                        (13) SeReMAS predictors for the RTOP, both myopic and DRL, in
                                                                             Section IV-C.
where
                             “                                             ‰  Network Interfaces   GPS module
  Qpsi , φi q “ Esi`1 |si ,φi Eri`1 |si`1 ,φi ,si rri`1 |si`1 , φi , si |s
                                     “               ‰
              ` γ max
                    1
                        Esi`1 |si ,φi Qpsi`1 , φ1 q .                   (14)
                     φ

The cost variable ci includes weighted penalties for the delay
being above threshold and the cardinality of the selected set,
that is
                 ci “ λ cdelay
                          i    ` p1´λq cset
                                         i ,              (15)
with
       cdelay
        i     “I pδmin pti q ą δ ˚ qS pαdelay δmin ´ κdelay q   (16)      Onboard
                                                                              FLIGHT Flight
                                                                                     CONTROLLER Camera
                                                                          Computer   Controller
                                                                                     (hidden)
and
                                                                                        (a)                                (b)
                         cset  set       set
                          i “ α |φi | ´ κ ,                     (17)
                                                                        Fig. 7: (a) Drone prototype; (b) NVidia Jetson Xavier acting
where αdelay , αset , κdelay and κset are normalization and offset
                                                                        as edge server.
parameters. S pxq“1{p1 ` e´x q is the sigmoid function, here
used to generate a smooth delay cost function which is 0 until
δ ˚ and then progressively penalizing higher delay without              A. Platform Components
overpenalizing tasks with poor channel conditions. Figure 6               Figure 7 shows our experimental setup. Specifically, we use
shows the training procedure for our DRL-based approach.                a Tarot650 quadcopter mounting a PixHawk flight controller.
   We remark that the recursive formulation of the Q-values             We connect Telem2 port on the PixHawk to a serial interface
embeds the distribution of future states and costs given the            on a NVidia Jetson Nano board with 4GB of RAM. We use
Feature                   Normalized Correlation
three NVidia Jetson Xavier development boards, operating in                  Round Trip Time average             1
performance mode with 8 core ARM 64-bit processor, 32GB                      Transmission timeout              -0.83
of main memory, 512-core Volta GPU. We use three IEEE                        Packets Received                  -0.80
                                                                             Channel Level                     -0.48
802.11n WiFi cards to interconnect the drone to the edge                     Inclination (magnitude)           -0.17
servers. These boards act as access points on different channels             Position w.r.t Edge               0.16
in the 2.4GHz WiFi spectrum.                                                 Altitude                          0.16
                                                                             Last Sent                         -0.15
                                                                             Heading                           0.13
B. DRL State Space and Feature Selection                                     Speed                             0.08
                                                                             Congestion Window                 0.08
   We discuss how we create the input state for the DRL
algorithm. We consider features at the application, network TABLE I: Normalized feature relevance to a linear model
stack and device level as follows:                                  predicting the number of high-delay tasks in a 1 s window.
   ‚ Application and Onboard Computer: We track relevant
      application variables such as past capture-to-control delays, features include gyroscope and the increment of TCP fast
      number of samples in the intermediate buffers, and retransmissions, failures, RSSI, and retries. The complete trend
      selected actions. These will include real-time statistics within the window is selected for these features. The selection
      relative to power consumption and resource allocation of shows how both vehicle and network parameters are relevant
      CPU, GPU, and RAM.                                            to characterize the state of the system and its future behavior,
   ‚ Telemetry and Position: We use MAVLink [14] protocol           but their influence is expressed at different time scales.
      messages to register a listener to the flight controller.
      The onboard computer receives monitoring statistics from C. Myopic Predictor and DRL Implementation
      the Inertial Measurement Unit (IMU), Global Positioning          We provide the details of the myopic and DRL controllers.
      System (GPS) and the power consumption of the vehicle.                                                                  W,y
      We include the edge servers’ position, by including the Myopic Predictor - To implement the predictor pi`1,n “
      distance from the drone using polar coordinates (Dis- σpsi,n q we train a series of dense DNNs (with two hidden layers
      tance, Azimuth, Elevation) centered in the reference edge at r150, 50s nodes) using the Adam optimizer and trained for
      server. Distance is computed using the Harvesine formula. 100 epochs, with softmax output), which returns the probability
      Moreover, we add the relative heading by computing that the next delay will belong to the predicted class.
      the orientation of the drone with respect to the position Deep Q-Learning Agent - Naive implementations of Deep
      of the edge server. Furthermore, we consider the L2- Q-Learning use one DNN function. However as demonstrated
      norm of multi-dimensional vectors (such as accelerometer in [16], this approach may cause instability during training
      and gyroscope data) and compute speed with respect to if the Q-values presents sudden changes. Due to the erratic
      absolute reference frame and edge servers. All the features behavior of the system we consider, we then take a Double
      are synchronized at 5Hz.                                      Deep Q-Learning (DDQL) approach to build our DRL agent. In
   ‚ Network: We select relevant parameters such as TCP             DDQL, two separate Deep Neural Networks (DNN) are used.
      window and retransmissions, RSSI, and modulation/coding Referring to Eq. (14), one network is trained to approximate
      scheme (MCS) of the IEEE 802.11n protocol. We do Qp¨q “ Qpsi , φi q, and the other one to approximate the future
      so separately for each network interface available, so to Q-value term in the expectation, that is Q̂p¨q “ Qpsi`1 , φ1 q
      isolate features relative to each edge server.                   Fig. 6 illustrates the DDQN architecture and the training
   The details of the features are available in [12].               procedure.  We use a fully connected DNN, with [200, 100, 50]
                                                                    hidden nodes, ReLu activation, and Huber Loss. During training,
   Feature Selection. We use feature importance methods such
                                                                    we apply backpropagation to Qp¨q over the epochs e “ 1, ..., N .
as Logistic Regression, Support Vector Machines and Random
                                                                    We periodically copy DNN’s parameters so that Q̂ Ð Q, as
Forest as implemented in [15] and selected Logistic Regression
                                                                    a mean to reduce noise in during training. Note that we still
with L1 regularizer due to the bias that Random Trees have
                                                                    choose the best action to learn on φ using the most updated
towards features with high support’s cardinality and the hybrid
                                                                    Qp¨q, and in fact the decoupling between action selection and
nature of the features, which include continuous and categorical
                                                                    q-value function evaluation further stabilizes learning. We use
variables. We then used a recursive algorithm, where at each
                                                                    a replay buffer during training, where the experiences in the
iteration we train a predictor and discard the least influential
                                                                    form of psi , φi , ri , si`1 q are stored and sampled randomly to
features. We reduce the initial pool of 360 features to 73,
                                                                    avoid forgetting, which may occur if only the most recent
maximizing accuracy on the validation set. Table I shows the
                                                                    experiences are used [17].
normalized feature relevance predicting the number of high-
delay tasks in a 1 s window.
                                                                                       V. E XPERIMENTAL R ESULTS
   Interestingly, while all available past delays are selected
in the prediction (with L “ 3 in Eq. 6), acceleration and              We first present the experimental setting in Section V-A,
inclination features are selected with a lag of 0.6s indicating then the prediction performance in Section V-B, and the task
a longer range dependency with the delay. Other relevant offloading results in Section V-C.
A. Experimental setting the myopic predictors pW,yi`1,n “ σpsi q and associated binary
We consider a testbed illustrated in Fig. 8, which is composed classifier. In other words, the predictor determines whether at
of an airborne drone and N “3 ground edge servers in LOS. least half of the delay in the future window is below a given
We consider an object tracking application where the MAS threshold, which we set to δ ˚ “175ms. We use the Area Under
uses a camera to follow a predefined object at a certain distance. the Curve (AUC), integral of the ROC with respect to false
Specifically, the MAS captures images that are analyzed to positives, as performance metric, commonly used to evaluate
extract the bounding box of the closest object of a certain class algorithms predicting an imbalanced target.
(e.g., a person).
1.0
Area Under Curve
0.9
0.8
Network Telemetry Application All
0 0.5 1 1.5 2 2.5
Prediction window time interval [s]
Fig. 9: Performance of future delay classification for different
sets of features. Length of the prediction window is expressed
in seconds.
Fig. 8: Schematic representation of the system setting: three
ground edge servers, connected to the drone. Not all connec- Fig. 9 shows the performance of the predictor trained on
tions are continuously actively used (unused is dashed). different feature blocks as a function of the window W
The controller steers the vehicle in the appropriate direction (where we set y “ W {2). The results highlight how semantic
to (i) center the bounding box in the field of vision and (ii) differences across subsets of features influence their predictive
obtain a bounding box of a predefined size by controlling the power in the short and long term. When the prediction window
distance with respect to the object. In our testbed, the drone is small, most of the predictive power lies in networking
generates a regular stream of images to be analyzed using features, which capture short-term correlations between high
object detection. Specifically, the drone emits 15 images of delay events. However, network variables struggle to capture
size 19.5 kB per second. SSD-MobileNet-v2 model is used to longer-term trends, which are, instead predicted by telemetry
analyze the images. In our measurements, the NVidia Jetson variables. Indeed, the latter directly influence the distribution
Xavier board takes 10 ms to execute the algorithm. Note that of fine-grain network events.
the onboard NVIDIA Jetson Nano takes 87 ms to complete the
execution, however, power expenditure increases from 1.6 W
Area Under the Curve
to 4.2 W when the GPU is processing the images, that is, 11% 0.90
of the power needed to fly.
To acquire a dataset for a wide-spectrum of flight parameters,
0.85
we set the drone on a semi-random flight pattern around the
All features
edge servers. The pattern is defined by assigning uniformly 1 no offload
distributed GPS way-points to the drone in a cylinder of radius 0.80 2 no offload
4 no offload
equal to 30m centered on the edge server constellation and
confining the altitude in the r5, 15sm range. The maximum 0 1 2 3 4
Prediction window time interval [s]
speed is randomly chosen for every new GPS waypoint between
r1, 4sm{s. A new waypoint is set as soon as the drone reaches Fig. 10: Performance in future delay classification in presence
3 meters from the current one, to obtain a smooth flight as of partial information for recent time slots. Length of the
similar as possible to a real application. In drone applications, prediction window is expressed in seconds.
the outcome of the object detection analysis is promptly needed
to take control action and adjust the trajectory. While the action As noticed earlier, part of the network information is
taken after the image analysis is beyond the scope of the current available only when offloading to a particular edge server.
manuscript, we mention target tracking [18], object avoidance We now analyze how prediction performance is affected when
[19] as possible applications. several recent samples lack such information for one server.
Fig. 10 shows how the lack of full state information (which is
B. Prediction Performance available only if the edge server is used) in recent samples (last
All results are based on an experimental dataset [12] one, last two, etc.) affects the ability of the myopic classifier
collected using the randomized flight patterns described in to accurately predict future pipeline performance as a function
Section V-A. We first evaluate the prediction performance of of the prediction window W expressed in seconds. Missinginformation in one or few recent input samples, has a noticeable myopic approach. We explain this trend by observing that the
effect on classification in the short term, as the AUC reduces by DRL agent optimizes the information available to make future
5% for one sample and 10% for just two samples. On the other decisions, thus maximizing the overall prediction accuracy
hand, as expected, the influence of recent samples fades out when resources are scarce and selection needs to be precise.
when predicting further points in the future. As the decisions of To further illustrate the behavior of the proposed approach,
the DRL agent embed the future performance beyond the next we show in Figure 12 a time series of delays and decisions
delay sample, they also consider the availability of information (selected edge servers) of the DRL-based approach for two
in future decision instances. different λ (0.1 and 0.2) used in Eq. 15. We can see that the
DRL agent can stabilize delay, where a larger use of resources
C. Redundant Offloading leads to the avoidance of more delay peaks. We note how
Fig. 11 shows the performance of the myopic and DRL the DRL agent rotates the edge servers periodically to harvest
selectors in terms of delay (percentage below threshold) and information for more informed future decisions.
resource usage (average number of edge servers used). The 0.30
different points for the myopic approach are obtained by
varying the parameter ∆, i.e., the bound on the probability that 0.25
End-to-end Delay [s]
the delay is below threshold.
0.20
0.15
97.5
% delay below threshold
95.0 0.10
0 2 4 6 8 10
Time [s]
92.5 λ = 0.1 λ = 0.2
Number of Active Servers
3
90.0
87.5 Myopic 2
Deep-RL
85.0 1
1.00 1.25 1.50 1.75 2.00 2.25 2.50 2.75 3.00 0 2 4 6 8 10
Average # of Edge Servers used Time [s]
λ = 0.1 λ = 0.2
Fig. 11: Delay performance and resource utilization trend of 2
Active Servers
the myopic and DRL-based selector.
1
The DRL approach, as described in Section III-B, generates
different points in the plot for different values of the weight λ 0
0 2 4 6 8 10
in the cost function, where a larger λ favors low delay over Time [s]
resource usage. For comparison, we include a selector which
uses all the available edge servers for all the tasks, and a selector Fig. 12: DRL agent improving delay by using task replication.
which uses the edge server with the best channel quality index. We plot in grey the traces of the non-selected delays.
When using all the three edge servers all the time, the myopic
selector achieves maximum performance („ 97%), whereas VI. R ELATED W ORK
when using only one edge server, it achieves „ 85.5%. We note Edge computing can significantly improve reliability and
that a selector that chooses the edge server with the best channel performance in mobile applications [4]. Different frameworks
quality achieves 75% of tasks with delays below threshold, perform a multi-layer optimization to exploit the full potential
w.r.t. which we improve 17%. Thus, predictive control greatly of edge computing [5, 20]. To fully exploit the edge servers,
improves performance compared to traditional options, even the user equipment needs to periodically make a decision on
when idealized to task-level granularity without connection whether to process tasks locally, or to offload. In the latter case,
delay. As we make the bound on ∆ more tight, the myopic there might be multiple technologies or networks available,
approach uses more and more resources. e.g. [21], and a link must be chosen for each transmission.
We observe that using two edge servers, the myopic Convex optimization has been proven to be ineffective due to
controller already achieves a performance roughly 2% worse the presence of complex factors such as user’s mobility [3].
than the three edge server option, demonstrating that prediction Classic approaches are shown to perform better with coarser
can reduce resource usage. However, when using a small granularity settings and when considerable prior knowledge
amount of resources, the myopic controller’s effectiveness is available. For example, in [22] the authors develop an
sharply decreases. Conversely, the DRL is capable of effectively online multi-decision making scheme, solving a task offloading
select small sets of computing pipelines while preserving problem while jointly optimizing caching, communication and
delay performance. Using 1.1 edge servers on average, the computation resources in the Internet of Vehicles, exploiting
DRL approach achieves „ 92%, that is, 7% more than the the proximity of users to roadside units.Fast-changing mobile networks usually employ data-driven [8] Q. Hu, Y. Cai, G. Yu, Z. Qin, M. Zhao, and G. Y. Li, “Joint Offloading and
approaches, using Markov Decision Processes (MDP), Q- Trajectory Design for UAV-enabled Mobile Edge Computing Systems,”
IEEE Internet of Things Journal, vol. 6, no. 2, pp. 1879–1892, 2018.
Learning or DRL. MDPs achieve a good tradeoff between the [9] Z. Yang, C. Pan, K. Wang, and M. Shikh-Bahaei, “Energy Efficient
flexibility of learning and the data efficiency of a model-based Resource Allocation in UAV-enabled Mobile Edge Computing Networks,”
solution [23, 24]. However, MDP-based solutions often lead IEEE Transactions on Wireless Communications, vol. 18, no. 9, pp.
4576–4589, 2019.
to exceedingly large state spaces, and require vast amounts [10] T. Zhang, Y. Xu, J. Loo, D. Yang, and L. Xiao, “Joint Computation and
of data to find the correct transitions for each state-action Communication Design for UAV-Assisted Mobile Edge Computing in
pair during training. Finally, they are very memory intensive IoT,” IEEE Transactions on Industrial Informatics, vol. 16, no. 8, pp.
5505–5516, 2020.
both in training and execution time. For these reasons, DRL [11] L. Bertizzolo, S. D’Oro, L. Ferranti et al., “SwarmControl: An Automated
approaches have been proposed. Cao et. al [3] present a Distributed Control Framework for Self-Optimizing Drone Networks,”
general framework for intelligent offloading in multi-access in IEEE Conference on Computer Communications (INFOCOM), 2020,
pp. 1768–1777.
edge computing composed by observation tier, analysis tier, [12] D. Callegaro, “SeReMAS: Resilience Through Task Replication in
prediction tier and policy tier. In this paper, we consider a Mobile Autonomous Systems with Predictive Capabilities,” 2021.
much more complicated problem where the trade-off is beyond [Online]. Available: https://github.com/uci-iasl/SeReMAS
[13] A. Awang, S. Agarwal, and M. Drieberg, “Data Aggregation Using
power efficiency and link performance. Recently, researchers RSSI for Multihop Wireless Sensor Networks: Energy and Delay
have worked towards simulation environments for drones, for Performance,” in 2013 IEEE 11th Malaysia International Conference on
example, OpenUAV [25] and FlyNetSim [26]. However, neither Communications (MICC), 2013, pp. 422–426.
[14] A. Koubâa, A. Allouch, M. Alajlan, Y. Javed, A. Belghith, and
of the two environments can capture the interactions between M. Khalgui, “Micro Air Vehicle Link (MAVlink) in a Nutshell: A Survey,”
mobility and application delay that are key in this paper. Thus, IEEE Access, vol. 7, pp. 87 658–87 680, 2019.
we are sharing our dataset with the community to further allow [15] F. Pedregosa, G. Varoquaux, A. Gramfort, V. Michel, B. Thirion, O. Grisel,
M. Blondel, P. Prettenhofer, R. Weiss, V. Dubourg et al., “Scikit-learn:
research that can explain and exploit these interactions. Machine Learning in Python,” The Journal of Machine Learning Research,
vol. 12, pp. 2825–2830, 2011.
VII. C ONCLUSIONS [16] H. van Hasselt, A. Guez, and D. Silver, “Deep Reinforcement Learning
with Double Q-learning,” CoRR, vol. abs/1509.06461, 2015. [Online].
This paper has proposed SeReMAS, a data-driven optimiza- Available: http://arxiv.org/abs/1509.06461
tion framework for predictive task offloading in edge-assisted [17] J. Kirkpatrick, R. Pascanu et al., “Overcoming Catastrophic Forgetting
in Neural Networks,” Proceedings of the National Academy of Sciences,
Mobile Autonomous Systems (MASs). We have formulated vol. 114, no. 13, pp. 3521–3526, 2017.
a Redundant Task Offloading Problem (RTOP) and created a [18] M. Mueller, N. Smith, and B. Ghanem, “A Benchmark and Simulator for
predictor based on Deep Reinforcement Learning (DRL), which UAV Tracking,” in European Conference on Computer Vision. Springer,
2016, pp. 445–461.
produces the optimum task assignment based on application-, [19] D. Wang, W. Li, X. Liu, N. Li, and C. Zhang, “UAV Environmental
network- and telemetry-based features. We have prototyped Perception and Autonomous Obstacle Avoidance: A Deep Learning
SeReMAS on a real-world testbed, and extensively evaluated and Depth Camera Combined Solution,” Computers and Electronics in
Agriculture, vol. 175, p. 105523, 2020.
SeReMAS by considering an application where one drone [20] N. Cheng, F. Lyu, W. Quan, C. Zhou, H. He, W. Shi, and X. Shen,
offloads high-resolution images for real-time analysis to three “Space/Aerial-Assisted Computing Offloading for IoT Applications: A
edge servers on the ground. Experimental results show that Learning-Based Approach,” IEEE J. on Sel. Areas in Communications,
vol. 37, no. 5, pp. 1117–1129, 2019.
SeReMAS improves the task execution probability by 17% [21] D. Callegaro, S. Baidya, and M. Levorato, “Dynamic Distributed Com-
with respect to existing reactive-based approaches. puting for Infrastructure-Assisted Autonomous UAVs,” in Proceedings of
the IEEE International Conference on Communications (ICC), Dublin,
R EFERENCES Ireland, Jun. 2020, sAC Tactile Internet Track.
[1] M. Mazur, A. Wisniewski, and J. McMillan, “Clarity from Above: PwC [22] Z. Ning, K. Zhang, X. Wang, L. Guo, X. Hu, J. Huang, B. Hu, and
Global Report on the Commercial Applications of Drone Technology,” R. Y. K. Kwok, “Intelligent Edge Computing in Internet of Vehicles: A
Warsaw: Drone Powered Solutions, PriceWater house Coopers, 2016. Joint Computation Offloading and Caching Solution,” IEEE Transactions
[2] Market Watch, “North America Self-driving Car Market - Global Industry on Intelligent Transportation Systems, pp. 1–14, 2020.
Analysis, Size, Share, Growth, Trends, and Forecast,” https://tinyurl.com/ [23] D. Callegaro and M. Levorato, “Optimal Edge Computing for
w64u9jwn, 2020. Infrastructure-Assisted UAV Systems,” IEEE Transactions on Vehicular
[3] B. Cao, L. Zhang, Y. Li, D. Feng, and W. Cao, “Intelligent Offloading in Technology, vol. 70, no. 2, pp. 1782–1792, 2021.
Multi-access Edge Computing: A State-of-the-art Review and Framework,” [24] B. Zhang, G. Zhang, W. Sun, and K. Yang, “Task Offloading with Power
IEEE Communications Magazine, vol. 57, no. 3, pp. 56–62, 2019. Ccontrol for Mobile Edge Computing Using Reinforcement Learning-
[4] F. Bonomi, R. Milito, J. Zhu, and S. Addepalli, “Fog Computing and Based Markov Decision Process,” Mobile Information Systems, vol. 2020,
Its Role in the Internet of Things,” in Proceedings of the First Edition 2020.
of the MCC Workshop on Mobile Cloud Computing. ACM, 2012, pp. [25] M. Schmittle, A. Lukina, L. Vacek, J. Das, C. P. Buskirk, S. Rees,
13–16. J. Sztipanovits, R. Grosu, and V. Kumar, “OpenUAV: A UAV Testbed
[5] F. Zhou, Y. Wu, R. Q. Hu, and Y. Qian, “Computation Rate Maximization for the CPS and Robotics Community,” in 2018 ACM/IEEE 9th Int.
in UAV-Enabled Wireless-Powered Mobile-Edge Computing Systems,” Conference on Cyber-Physical Systems (ICCPS). IEEE, 2018, pp.
IEEE Journal on Selected Areas in Communications, vol. 36, no. 9, pp. 130–139.
1927–1941, 2018. [26] S. Baidya, Z. Shaikh, and M. Levorato, “FlyNetSim: An Open Source
[6] F. Cheng, S. Zhang, Li et al., “UAV Trajectory Optimization for Data Synchronized UAV Network Simulator Based on NS-3 and Ardupilot,”
Offloading at the Edge of Multiple Cells,” IEEE Transactions on Vehicular in Proceedings of the 21st ACM International Conference on Modeling,
Technology, vol. 67, no. 7, pp. 6732–6736, 2018. Analysis and Simulation of Wireless and Mobile Systems, 2018, pp. 37–45.
[7] J. Zhang, L. Zhou, Q. Tang, E. C.-H. Ngai, X. Hu, H. Zhao, and J. Wei,
“Stochastic Computation Offloading and Trajectory Scheduling for UAV-
assisted Mobile Edge Computing,” IEEE Internet of Things Journal,
vol. 6, no. 2, pp. 3688–3699, 2018.You can also read