Shock and Awe? COVID-19, Vaccines and the Recovery

Page created by Richard Hodges
 
CONTINUE READING
Shock and Awe? COVID-19, Vaccines and the Recovery
Shock and Awe?
COVID-19, Vaccines
  and the Recovery
Shock and Awe? COVID-19, Vaccines and the Recovery
SHOCK AND AWE? COVID-19, VACCINES AND THE RECOVERY
                                                                              I have therefore determined, not only to inoculate all the Troops now here, that have not had it, but shall order Doctor
                                                                              Shippen to inoculate the Recruits as fast as they come into Philadelphia.
                                                                              – Gen. George Washington, Feb. 5, 1777

U
                        pon taking command of the Continental Army in 1775, Gen. George Washington faced two foes: the British and smallpox. As the Continental Army
                        laid siege to British-held Boston, smallpox ravaged its troops and evidence mounted that the British, who were largely immune due to the endemic nature
                        of the disease in England, were working to infect soldiers and civilians alike. Washington ordered infected soldiers and civilians be held in quarantine,
                        but as the battlefield broadened, smallpox continued to spread. At the Battle of Quebec in December 1775, the Continental Army was so weakened
    by smallpox that it had to retreat from the field of battle. By February 1777, Washington had seen enough. He wrote to John Hancock, president of the Second
    Continental Congress, that he was ordering the inoculation of troops under his command.1 The need was palpable. John Adams estimated in 1777 that for every
    soldier killed in battle, disease killed 10.

    Washington ordered vaccination preparations to begin in secret because the                                           COVID-19 vaccinations dramatically reduced infections, hospitalizations
    political and social climate was not conducive to a public campaign. In 1776,                                        and deaths in Hampton Roads, Virginia and the United States in the first six
    at the height of the smallpox epidemic, the Continental Congress had passed                                          months of 2021. Yet, vaccine hesitancy and resistance continue to challenge
    an ordinance prohibiting Continental Army surgeons from inoculating soldiers.                                        public health efforts and the economic recovery. Disinformation, amplified by
    A number of states and localities had also passed laws prohibiting vaccination                                       social media and certain cable news networks, not only undermines efforts
    of soldiers and civilians. As the Washington-ordered inoculations continued in                                       to improve public health, but also threatens the core tenets of the American
    1777 and into 1778 (almost always in secret, as soldiers required a month of                                         experiment in democracy. Even with these challenges, however, Hampton
    convalescence), smallpox mortality rates in the Continental Army dropped from                                        Roads is poised to grow faster in 2021 than at any time in the previous
    between 10% and 60% to less than 2%. Dr. Benjamin Rush, surgeon general                                              decade, and conditions are favorable for continued growth in 2022.
    to the Continental Army and a signer of the Declaration of Independence,
                                                                                                                         Over the last 18 months, our region experienced a historical
    observed in 1781: “The small-pox which once proved equally fatal to
                                                                                                                         economic shock that, at its peak, left 1 in 10 workers
    thousands, has been checked in its career, and in a great degree subdued by
                                                                                                                         unemployed, 4 in 10 small businesses reducing hours and
    the practice of inoculation.”1
                                                                                                                         many schools shifting to virtual instruction. These challenges
    Jean-Baptiste Alphonse Karr, a 19th-century French critic, journalist and                                            sparked difficult conversations about why Hampton Roads
    novelist, noted, “The more things change, the more they are the same.”                                               failed to keep pace with the Commonwealth and the nation
    1 S
       mallpox inoculation at the time required a surgeon to lance a smallpox pustule and then insert the infected      over the previous decade. Would a recovery find Hampton
      blade underneath the skin of an uninfected person. This crude form of inoculation typically resulted in a milder
      form of smallpox; however, some inoculated individuals contracted a more severe form of the disease and            Roads again in envy of its peers?
      died as a result of the inoculation. See: https://www.ncbi.nlm.nih.gov/pmc/articles/PMC5463674/.

4                  THE STATE OF THE REGION | HAMPTON ROADS 2021
Shock and Awe? COVID-19, Vaccines and the Recovery
Now, with an economic recovery before us, will we move                               In late summer, booster shots were available for the immunocompromised and
beyond meetings to boost economic growth, or will we return                          would soon be available for those 12 and older.
to the behaviors of the past? As the pandemic has so aptly
                                                                                     In Hampton Roads, the seven-day rolling average of positive COVID-19 tests
shown us, we will rise or fall together.
                                                                                     fell from 1,437 on Jan. 20, 2021, to 65 on June 1, 2021, a decline of 95%.
In this chapter, we examine Hampton Roads’ recovery from the COVID-19                By the end of June, the seven-day average had fallen further to 36. However,
pandemic and the prospects for continued growth in 2022. We highlight the            the good news would not last as the COVID-19 delta variant gained traction
rebound in labor markets, the benefits of increasing vaccination rates in the        in the region, Commonwealth and nation. By the end of July, the seven-day
region and the emergence of the COVID-19 delta variant, which has led to             rolling average of cases in Hampton Roads had risen to 226.
rising infections, primarily among the unvaccinated. We explore the impacts
                                                                                     A continuing (and unfortunate) theme of the COVID-19 pandemic is that
of COVID-19 on the region’s residents and discuss whether the plans for
                                                                                     Black residents of Hampton Roads have borne a disproportionate burden of
recovery are sufficient. Lastly, we consider how changes in the national security
                                                                                     the public health crisis. While Black residents comprised 30% of the region’s
environment may pose the next challenge for growth in Hampton Roads.
                                                                                     population in 2019, they accounted for 33.8% of positive COVID-19 tests,
                                                                                     50.9% of hospitalizations and 44.6% of COVID-19 deaths (Graph 2). White
                                                                                     residents, who made up 55% of the Hampton Roads population in 2019,
The Pandemic, Variants                                                               accounted for approximately 40.8%, 37.6% and 48.4% of the region’s positive

And Vaccines
                                                                                     tests, hospitalizations and deaths, respectively, from COVID-19.

                                                                                     Why have we observed a high toll among Black residents in the region
In October 2020, Hampton Roads and Virginia appeared to have weathered               and Commonwealth? First, Black workers are more likely to be employed in
the summer surge in COVID-19 infections, hospitalizations and deaths. Within         occupations that are at higher risk of exposure. Second, as we note below,
two months, however, the region, Commonwealth and nation would enter a               Black vaccination rates through the first eight months of 2021 lagged those of
dark winter, with deaths surging nationally to an average of 3,000 a day. In         other races in the region and Virginia. Third, inequities in access and provision
Hampton Roads, the seven-day rolling average of residents testing positive for       of health care can also negatively influence the course of the disease in Black
COVID-19 peaked at 1,437 on Jan. 20, 2021, more than three times that of             residents.2
the previous peak observed in July 2020 (Graph 1).
                                                                                     There was, however, a significant difference from the previous wave that
Yet, even as infections surged in the fall of 2020, clinical trials of the Pfizer/   peaked in January 2021: the availability of safe and effective vaccines.
BioNTech and Moderna COVID-19 vaccines provided hope. With emergency                 While COVID-19 vaccines are fiercely debated on social media and have
use authorization from the U.S. Food and Drug Administration, vaccinations           become conflated in the minds of some with political identity, data provide a
started in late December 2020, although demand far outstripped initial supply.       stark picture of the impact of the virus on the vaccinated and unvaccinated
An aggressive pivot toward greater production and distribution of these              populations.
vaccines (and eventually the Johnson & Johnson vaccine) in early 2021 marked
an inflection point in the course of the pandemic. By late spring, Americans         Data from the Virginia Department of Health illustrate these
12 and older could go to pharmacies, doctors’ offices, vaccination clinics and       stark differences. Between Jan. 17 and Aug. 13, 2021,
even public schools to receive a free COVID-19 shot without significant delay.
                                                                                     2 S
                                                                                        ee our discussion of vaccinations and employment by race in this chapter. For a national perspective, see
                                                                                       https://www.kff.org/coronavirus-covid-19/issue-brief/latest-data-on-covid-19-vaccinations-race-ethnicity.

SHOCK AND AWE? COVID-19, VACCINES AND THE RECOVERY                                                                                                                                                   5
Shock and Awe? COVID-19, Vaccines and the Recovery
fully vaccinated individuals accounted for 0.09%, 0.005%                            Given the proven benefits of the vaccines to individual and
    and 0.001% of reported cases, hospitalizations and deaths                           public health, working to educate residents and reduce vaccine
    in the Commonwealth. In July, the rates of infection and                            hesitancy and resistance is key to sustaining a regional
    hospitalization from COVID-19 in Virginia were 35 times lower                       recovery. Unvaccinated people represent an opportunity for
    among the fully vaccinated. Rates of hospitalization were 20                        the virus to mutate and undermine vaccine efficacy, especially
    times lower among the fully vaccinated when compared to the                         with the rise of more infectious variants of the virus. Those
    not fully vaccinated.                                                               who remain unvaccinated by choice also present a challenge
                                                                                        to employers, since they pose an undue risk to co-workers and
    While vaccinations can reduce future inequities from COVID-19, there have           customers who cannot be vaccinated. One need only recall
    been troubling lags in vaccination rates across Hampton Roads. Graph 3              the impact of COVID-19 on our tourism industry to understand
    displays the percentage of the population in Virginia and selected Hampton          how a sustained outbreak among the unvaccinated could
    Roads cities and counties who were fully vaccinated as of March 1, June 1 and       undermine the prospects for a sustained recovery in Hampton
    Aug. 1, 2021. Of the 16 cities and counties in the Virginia portion of Hampton      Roads.
    Roads, four (Mathews County, Poquoson, James City County and York County)
    had vaccination rates that were higher than the Commonwealth average.               The good news is that as the number of vaccinations has
                                                                                        increased, public opinion polls have seen robust declines
    Graph 4 illustrates the share of the population by race in Hampton Roads            in vaccine hesitancy. However, there is a fraction of the
    and Virginia that were fully vaccinated by Aug. 6, 2021. Asian residents            population that has hardened its hostility. Disinformation
    were more likely to be vaccinated than their counterparts in the region but         persists through social media and certain cable news
    lagged the Commonwealth average. White residents of Hampton Roads were              networks, which have served as platforms for anti-vaccination
    almost as likely to be fully vaccinated as the average for whites across the        rhetoric. Breaching these walls of mistrust requires concerted
    Commonwealth, while Black residents of the region were approximately 5              and sustained effort from trusted agents in the community.
    percentage points behind the state’s average. Hispanic residents of the region      Unfortunately, we have ample evidence of Jonathan Swift’s
    were far less likely to be fully vaccinated relative to the share of the Hispanic   observation: “Falsehood flies, and truth comes limping
    population in Virginia.                                                             after it.”
    In the early phases of the vaccination campaign, a likely explanation for the
    disparity in vaccination rates had to do with differences in median household
    income as well as personal and professional networks. However, given that the
    COVID-19 vaccines are free, the lower rates of vaccinations in Hampton Roads
    are a matter of concern. If vaccination rates continue to lag among residents,
    they remain vulnerable to the scourge of COVID-19.

6              THE STATE OF THE REGION | HAMPTON ROADS 2021
Shock and Awe? COVID-19, Vaccines and the Recovery
ECONOMY CHAPTER GRAPHS

                                                                                                         GRAPH 1
                                                                                                         GRAPH 1
                                                    Seven-Day Rolling Average of Positive Tests for COVID-19: Hampton Roads
                                                 SEVEN-DAY ROLLING AVERAGE OF POSITIVE TESTS FOR COVID-19: HAMPTON ROADS
                                                                          APRIL 1, 2020-JULY
                                                                          April 1,           31, 2021
                                                                                   2020-July 31,  2021

                       1,600
                                                                                                                                       1,437

                       1,400

                       1,200
  Positive PCR Tests

                       1,000

                        800

                        600                                         474

                                                                                                                                                                                                                226
                        400

                        200                                                                                                                                                                           36
                                  41

                          0

                                                                                                                                                                                    May-21
                                        May-20

                                                                                                                                                                                                       Jul-21
                                                           Jul-20

                                                                                  Sep-20
                               Apr-20

                                                  Jun-20

                                                                      Aug-20

                                                                                                                                                            Mar-21

                                                                                                                                                                        Apr-21

                                                                                                                                                                                             Jun-21
                                                                                               Oct-20

                                                                                                           Nov-20

                                                                                                                       Dec-20

                                                                                                                                    Jan-21

                                                                                                                                                Feb-21
Sources: Virginia Department of Health and the Dragas Center for Economic Analysis and Policy, Old Dominion University. Virginia portion of the Virginia Beach-Norfolk-

Newport News MSA.

 Sources:
Note:     Virginia
       only   the Department of Health
                   graphic has   beenand the Dragas
                                       updated      Center for
                                                 through       Economic
                                                             the  end ofAnalysis
                                                                         July, and  Policy,as
                                                                                 as well    Oldthe
                                                                                                 Dominion University. Virginia portion of the Virginia Beach-Norfolk-Newport News MSA.
                                                                                                   title dates

 SHOCK AND AWE? COVID-19, VACCINES AND THE RECOVERY                                                                                                                                                                   7
Shock and Awe? COVID-19, Vaccines and the Recovery
GRAPH 2
                                                                                    GRAPH 2
                                                           Distribution
                                                   DISTRIBUTION         of Population
                                                                 OF POPULATION   AND and COVID-19
                                                                                      COVID-19     Deaths
                                                                                               DEATHS:    By Race:
                                                                                                       HAMPTON   ROADS,*
                                                                         JUNE 15, 2020-JULY 31, 2021
                                                                 Hampton Roads, June 15, 2020-July 31, 2021*

              60%
                                                                                                                                                                                               55.0%

              50%                                                                                                                                                                                             48.4%
                                                                                                     44.6%

              40%
    Percent

                                                                                      30.0%
              30%

              20%

              10%                                                                                                                           7.0%
                                   4.0%           4.0%
                                                                                                                                                           2.0%
              0%
                         Asian or Pacific Islander                                             Black                                               Latino                                              White

                                                                                 ■ 2019 Population                         COVID-19 Deaths

Sources: Virginia Department of Health and the Dragas Center for Economic Analysis and Policy, Old Dominion University. Population data are from the 2019 American Community

Survey 1-year estimates. COVID-19 data, from the Virginia Department of Health, cover the health districts of Chesapeake, Hampton, Norfolk, the Peninsula, Portsmouth, Virginia Beach

Sources:
and      VirginiaTidewater.
     Western      Department of*Data
                                Health and  the Dragas
                                        at the   city and Center for Economic
                                                              county          Analysis
                                                                       level are  notand Policy, Old
                                                                                       available     Dominion
                                                                                                   prior        University.
                                                                                                           to June          Population data are from the 2019 American Community Survey 1-year estimates. COVID-19 data, from the
                                                                                                                     15, 2020.
Virginia Department of Health, cover the health districts of Chesapeake, Hampton, Norfolk, the Peninsula, Portsmouth, Virginia Beach and Western Tidewater. *Data at the city and county level are not available prior to June 15, 2020.

8               THE STATE OF THE REGION | HAMPTON ROADS 2021
Shock and Awe? COVID-19, Vaccines and the Recovery
Percentage of Population Fully Vaccinated: Virginia and Selected Cities in Hampton Roads,
                                                                                                                GRAPH 3
                                                                   March 1, 2021, June 1, 2021, and Aug. 1, 2021
                             PERCENTAGE OF POPULATION FULLY VACCINATED: VIRGINIA AND SELECTED CITIES IN HAMPTON ROADS,
                                                   MARCH 1, 2021, JUNE 1, 2021, AND AUG. 1, 2021

              60%

              50%                                                                                                                                                                                                        48.1%
                                                                                                                                                                                               45.7%
                                                                                                                                                                     43.2%
                                                                                                                40.9%                     41.6%
                                                                                      40.3%                                                                                                                    39.6%
              40%                                                                                                                                                                      37.3%
                                                            35.7%                                                                                          35.2%
                                 34.6%                                                                                           33.6%
                                                                             32.5%                     32.5%
    Percent

                        28.2%                     28.3%
              30%

              20%

              10%                                                                                                                                                                 8.0%                      7.9%
                                                                          6.4%                     6.7%                                                6.5%
                     4.3%                                                                                                     5.6%
                                               3.9%

              0%
                           Norfolk                Portsmouth                  Newport                   Hampton                     Suffolk               Chesapeake Virginia Beach                               Virginia
                                                                               News

                                                                                           ■ 01-Mar              01-Jun            01-Aug

Sources: Virginia Department of Health, COVID-19 Vaccine Summary; U.S. Census Bureau 2019 Population Estimates; and the Dragas Center for Economic Analysis and Policy, Old Dominion University. Doses administered

by federal agencies within Virginia are not included, since the federal government does not provide information regarding location and demographics. “Fully vaccinated” equates to one dose of the Johnson & Johnson
  Sources:
vaccine  or Virginia
            two shotsDepartment
                       of either of
                                 theHealth, COVID-19 Vaccine
                                     Pfizer/BioNTech            Summary;
                                                         or Moderna      U.S. Census
                                                                      vaccine.        Bureau 2019
                                                                                The percentage     Population
                                                                                                 fully         Estimates;
                                                                                                       vaccinated         and the Dragas
                                                                                                                    is estimated         Center
                                                                                                                                  using the totalfor Economic Analysis
                                                                                                                                                  population  of each and Policy, Old area.
                                                                                                                                                                       geographical   Dominion University. Doses administered by federal
  agencies within Virginia are not included, since the federal government does not provide information regarding location and demographics. “Fully vaccinated” equates to one dose of the Johnson & Johnson vaccine or two shots of either
  the Pfizer/BioNTech or Moderna vaccine. The percentage fully vaccinated is estimated using the total population of each geographical area.

  SHOCK AND AWE? COVID-19, VACCINES AND THE RECOVERY                                                                                                                                                                                         9
Shock and Awe? COVID-19, Vaccines and the Recovery
GRAPH 4
                                                                                                          GRAPH 4
                                                                        Share of Population Fully Vaccinated by Race:
                                                                        SHARE OF POPULATION FULLY VACCINATED:
                                                                   VIRGINIA AND
                                                                      Virginia   HAMPTON
                                                                               and HamptonROADS,
                                                                                             Roads, AS
                                                                                                    as OF  AUG.6,
                                                                                                        of Aug. 6, 2021
                                                                                                                   2021

               80%

               70%                                                                                                                                                                                     67.7%

                                                                                                                                                                                         59.0%
               60%

               50%
                                                 45.1%
                                                                                                                                       40.2% 41.6%
     Percent

                                                                                                   38.5%
               40%
                                                                                     33.4%
                                   29.5%
               30%

               20%

               10%

               0%
                                          Latino                                             Black                                            White                             Asian or Pacific Islander

                                                                                         ■ Hampton Roads                       Virginia

  Sources: U.S. Census Bureau 2019 Population Estimates, Virginia Department of Health and the Dragas Center for Economic Analysis and Policy, Old Dominion University. The data do

  not include doses administered by federal agencies or out-of-state residents; 326,154 out of 4,431,177 observations do not include race information and are excluded from the analysis.
 Sources: U.S. Census Bureau 2019 Population Estimates, Virginia Department of Health and the Dragas Center for Economic Analysis and Policy, Old Dominion University. The data do not include doses administered by federal agencies or
 out-of-state residents; 326,154
  The percentage                 out of 4,431,177
                         fully vaccinated         observations
                                             is estimated      do notthe
                                                            using     include race
                                                                          total    information and
                                                                                population         are excluded
                                                                                               of each          from the analysis.
                                                                                                         geographical     area. The percentage fully vaccinated is estimated using the total population of each geographical area.

10              THE STATE OF THE REGION | HAMPTON ROADS 2021
Shock and Awe? COVID-19, Vaccines and the Recovery
A Weak Recovery? Labor                                                             The decline in the unemployment rate in Hampton Roads in 2021 is the result
                                                                                   of two factors: an increase in individual employment (good) and a decline

Force And Employment In                                                            in the civilian labor force (bad). From January to June 2021, unemployment
                                                                                   has fallen by 10,417 individuals but only 4,448 individuals were gainfully
Hampton Roads                                                                      employed. The remaining 5,969 left the labor force. A declining labor force is
                                                                                   not a sign of a robust regional economic recovery.
The labor market in Hampton Roads is typically seasonal; that is, the number
of people in the labor force looking for work or actively employed peaks in        If the 50,057 workers who left the labor force since February
the summer and reaches its lowest point in the winter. In 2019, however, labor     2020 had remained in it as unemployed individuals, the
markets appeared to be gaining steam by the fall and into the winter of 2020.      region’s unemployment rate in June 2021 would have been
As illustrated in Graph 5, the civilian labor force and individual employment in   10.9%, 2.2 times higher than the reported unemployment rate.
Hampton Roads peaked at 874,900 and 852,600 individuals, respectively, in
February 2020.

This positive upswing was soon dashed, however, by the
emergence of the COVID-19 pandemic, social distancing
measures and a rapid decline in domestic and international
tourism. By May 2020, the civilian labor force was 5%
smaller than in February 2020, while individual employment
had declined by approximately 12.2%. The labor force and
employment rebounded to some extent during the summer of
2020, but the recovery plateaued in the fall. At the beginning
of 2021, the civilian labor force and individual employment in
Hampton Roads were 5% and 8.5% lower, respectively, than in
February 2020. Even though economic expectations improved
in the spring of 2021, the civilian labor force continued to
contract – a troubling development.

The headline unemployment rate is equal to the ratio of the number of
unemployed people in the labor force to the overall labor force. The number
of unemployed in Hampton Roads declined from a high of 109,046 in April
2020 to 40,191 in June 2021. Over the same period, the civilian labor force
declined from 853,762 to 824,884. After peaking at 12.8% in April 2020,
the unemployment rate in Hampton Roads steadily declined, falling to 4.9% in
June 2021 (Graph 6).

SHOCK AND AWE? COVID-19, VACCINES AND THE RECOVERY                                                                                                              11
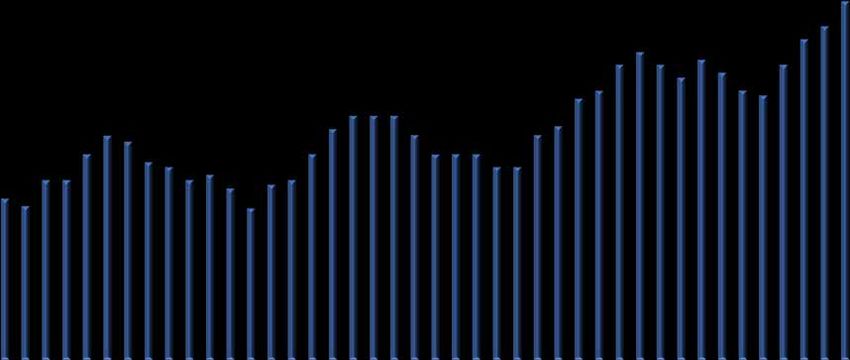
Shock and Awe? COVID-19, Vaccines and the Recovery
GRAPH 5
                                                                                                                                                   GRAPH 5
                                                                                                    Civilian
                                                                                                 CIVILIAN    Labor
                                                                                                           LABOR   ForceAND
                                                                                                                 FORCE   and INDIVIDUAL
                                                                                                                              Individual Employment:
                                                                                                                                          EMPLOYMENT:
                                                                                                     HAMPTON ROADS, JANUARY 2019-JUNE 2021
                                                                                                        Hampton Roads, January 2019-June 2021

                            900
                                                                                                                                              874.9
                                    862.3
                            880

                            860                                                                                                                                                   831.4
                                                                                                                                                                                                                                                                                         824.9
 Thousands of Individuals

                            840
                                                                                                                                       852.6
                            820
                                       834.7
                            800

                            780

                            760
                                                                                                                                                                                                                                                                                       784.7

                            740
                                                                                                                                                744.7
                            720
                                                                      May-19

                                                                                        Jul-19

                                                                                                          Sep-19

                                                                                                                            Nov-19

                                                                                                                                                                                  May-20

                                                                                                                                                                                                    Jul-20

                                                                                                                                                                                                                      Sep-20

                                                                                                                                                                                                                                        Nov-20

                                                                                                                                                                                                                                                                                              May-21
                                                                                                                   Oct-19

                                                                                                                                                                                                                               Oct-20
                                                                               Jun-19

                                                                                                 Aug-19

                                                                                                                                                                                           Jun-20

                                                                                                                                                                                                             Aug-20
                                  Jan-19
                                           Feb-19
                                                    Mar-19
                                                             Apr-19

                                                                                                                                     Dec-19
                                                                                                                                              Jan-20
                                                                                                                                                       Feb-20
                                                                                                                                                                Mar-20
                                                                                                                                                                         Apr-20

                                                                                                                                                                                                                                                 Dec-20

                                                                                                                                                                                                                                                                                                       Jun-21
                                                                                                                                                                                                                                                          Jan-21
                                                                                                                                                                                                                                                                   Feb-21
                                                                                                                                                                                                                                                                            Mar-21
                                                                                                                                                                                                                                                                                     Apr-21
                                                                                         -         Civilian Labor Force
                                                                                                                                                            -            Individual Employment

Sources: Bureau of Labor Statistics and the Dragas Center for Economic Analysis and Policy, Old Dominion University. Data are seasonally adjusted.

 Sources: Bureau of Labor Statistics and the Dragas Center for Economic Analysis and Policy, Old Dominion University. Data are seasonally adjusted.

12                            THE STATE OF THE REGION | HAMPTON ROADS 2021
GRAPH 6
                                                                                                                   GRAPH 6
                                                                                                        Headline Unemployment Rate (U3):
                                                                                                       HEADLINE UNEMPLOYMENT RATE (U3):
                                                                                                    HAMPTON
                                                                                                     HamptonROADS,
                                                                                                              Roads, JANUARY  2019-JUNE2021
                                                                                                                      January 2019-June 2021

                      14%
                                                                                                                                                              12.8%

                      12%

                      10%
  Unemployment Rate

                      8%

                      6%
                                                                                                                                                                                                                                                                                         4.9%
                              3.2%
                      4%                                                                                                                  2.6%

                      2%

                      0%

                                                                                                                                                                                                                                                                                        May-21
                                                                                                                                                                            May-20
                                                                May-19

                                                                                                                                                                                              Jul-20

                                                                                                                                                                                                                Sep-20
                                                                                  Jul-19

                                                                                                    Sep-19

                                                                                                                                                                                                                                                                                                 Jun-21
                                                       Apr-19

                                                                                                                                                                                                                                                    Jan-21

                                                                                                                                                                                                                                                                      Mar-21
                                                                                                                                                                                                                                                                               Apr-21
                                                                         Jun-19

                                                                                           Aug-19

                                                                                                                                                          Mar-20
                                                                                                                                                                   Apr-20

                                                                                                                                                                                     Jun-20

                                                                                                                                                                                                       Aug-20

                                                                                                                                                                                                                                                             Feb-21
                            Jan-19

                                              Mar-19

                                                                                                                      Nov-19
                                                                                                                               Dec-19
                                                                                                                                        Jan-20
                                                                                                                                                 Feb-20

                                                                                                                                                                                                                         Oct-20
                                                                                                                                                                                                                                  Nov-20
                                                                                                                                                                                                                                           Dec-20
                                     Feb-19

                                                                                                             Oct-19

Sources: Bureau of Labor Statistics and the Dragas Center for Economic Analysis and Policy, Old Dominion University. Data are seasonally adjusted.

 Sources: Bureau of Labor Statistics and the Dragas Center for Economic Analysis and Policy, Old Dominion University. Data are seasonally adjusted.

 SHOCK AND AWE? COVID-19, VACCINES AND THE RECOVERY                                                                                                                                                                                                                                                       13
Did Expanded                                                                       or more jobs a week. As one might have expected, states that discontinued
                                                                                    expanded unemployment saw declines in unemployment insurance claims.

 Unemployment Cause                                                                 Yet, anecdotal complaints from employers in these states continued regarding
                                                                                    difficulties in attracting and retaining employees in low-wage positions.
 A Labor Shortage?                                                                  Perhaps the only certainty is that this question will generate a large body of
                                                                                    academic research in the coming decade.
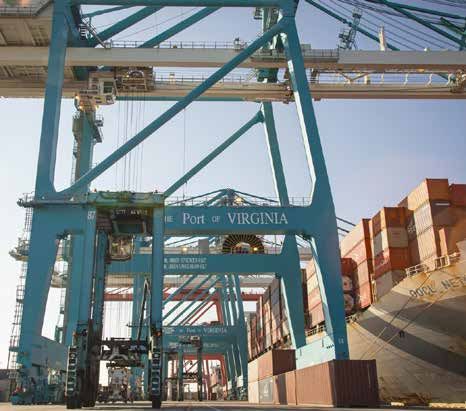
 Employers in some sectors of the region reported difficulties in finding workers
 to fill available positions in the spring and summer of 2020. The leisure and      As the unemployment rolls continue to shrink, our focus will need to shift to
 hospitality sector appeared to be the most challenged by this development.         bringing back workers who have left the labor force entirely. Fully opening
 Nationally, as well as in Virginia, online job postings surged past prepandemic    public schools, increasing child care availability and convincing the reluctant
 levels. As more people in the labor force were employed, employers faced           among us to get vaccinated will be necessary for this to occur. The recovery
 increasing difficulties to fill open positions. The question was: Where were all   may be on the way, but it is not complete.
 the workers?

 A confluence of factors likely explains the apparent shortage of workers
 in lower-wage sectors. First, some workers left the labor force entirely. The
 absence of these individuals meant that employers were competing for a
 smaller pool of labor. Second, national evidence suggests that a greater
 proportion of women left the labor force or transitioned to part-time
 employment. Remote and hybrid schooling, coupled with constraints on the
 availability of child care, limited the ability of some to work full time, if at
 all. Third, some workers were (and remain) concerned about contracting the
 coronavirus.

 Finally, expanded unemployment benefits may have influenced some workers
 on the margin. Recent findings from the National Bureau of Economic Research
 suggest that expanded unemployment benefits played a role in reducing job
 applications; a 10% increase in benefits contributed to a 3.6% decline in
 applications. For some workers, expanded benefits disincentivized work. Why?
 During the first eight months of 2021, full unemployment benefits in Virginia
 amounted to $678 a week ($378 regular plus $300 expanded) or $16.95 an
 hour.

 In the summer of 2021, some states opted out of expanded unemployment
 benefits entirely, eliminating any financial incentive to remain on
 unemployment. Other states, including Virginia, reimposed job search
 stipulations, requiring individuals receiving unemployment to apply for two

14          THE STATE OF THE REGION | HAMPTON ROADS 2021
Unemployment Claims In                                             In 2007, before the full impact of the Great Recession was felt in Hampton
                                                                   Roads, an average of 2,733 initial unemployment claims were filed monthly

Hampton Roads                                                      (Graph 7). Even though the recession was officially over in 2009, average
                                                                   monthly initial unemployment claims continued to rise in the region, reaching
                                                                   8,257 in 2010. In retrospect, while the Great Recession was significant, its
                                                                   economic shock paled in comparison to the COVID-19 pandemic. Average
When discussing unemployment claims, it is important to
                                                                   monthly claims were 3.4 times higher in 2020 than in 2010
make the distinction between initial and continued claims.         and 13.2 times higher than in 2019.
Initial claims represent the number of people who have filed
                                                                   In August 2007, 2,872 initial unemployment claims were filed in Hampton
a request for unemployment benefits after separation from
                                                                   Roads. Three years later, monthly initial unemployment claims peaked at
an employer. Continued claims, or what is known as insured         10,600. In other words, it took 36 months for the level of initial claims to rise
unemployment, reflect those who have already filed their           from its prerecessionary low to its recessionary peak. In February 2020, 1,961
initial claim, had the claim accepted by the government and        monthly initial unemployment claims were filed in Hampton Roads. Two months
                                                                   later, monthly initial claims rocketed to 76,723, an increase of 3,812% (Graph
continue to file claims to receive benefits for the current week
                                                                   8). The adjectives “unprecedented” and “historic” seem inadequate to describe
of unemployment. In other words, continued claims represent        the magnitude of the shock this had on labor markets in Hampton Roads.
the number of insured unemployed people, while initial claims
                                                                   If there is a modicum of good news, it is that initial claims and continued claims
reflect the number of initial requests for unemployment
                                                                   have generally trended downward in 2021. While one can think of initial
benefits in a given week.                                          claims as representing “turbulence” in the regional economy, continued claims
In the spring of 2020, Congress passed, and President              represent “slack.” An individual receiving continued unemployed benefits
Trump signed into law, the Pandemic Unemployment                   remains in the labor force and, as of the last week of May in Virginia, must
                                                                   actively search for employment each week.3
Assistance (PUA) and Pandemic Emergency Unemployment
Compensation (PEUC) programs. The PUA program                      Graph 9 illustrates the change in weekly continued claims for unemployment
provided up to 79 weeks of unemployment benefits for the           benefits in Hampton Roads from March 14, 2020, to July 31, 2021. Continued
                                                                   claims increased from 4,315 for the week ending March 14, 2020, to 88,436
self-employed, freelancers and independent contractors who
                                                                   for the week ending May 16, 2020. At the peak, more than 1 in 10 workers
would not typically qualify for regular state unemployment         in the region were receiving unemployment benefits. As Hampton Roads
benefits. The PEUC program provided an additional 13 weeks         reopened in the summer of 2020, continued claims fell sharply, dropping
of unemployment benefits for those who exhausted their state       to 13,936 at the end of December 2020. While continued claims remained
                                                                   above the prepandemic level during the first half of 2021, there has been
benefits. A number of states ended participation in these
                                                                   measured progress in reducing the number of workers in the region receiving
programs in the summer of 2021 and authorization for these         unemployment benefits.
programs lapsed in September 2021. Data for PUA and PEUC
                                                                   3 In March 2020, Virginia Gov. Ralph Northam temporarily waived the requirement that unemployed
filings were only available at the state and federal levels.          individuals must actively search for work. This requirement came back into force on June 1, 2021. Virginians
                                                                      receiving unemployment benefits must apply for two or more jobs a week and report the details to the Virginia
                                                                      Employment Commission.

SHOCK AND AWE? COVID-19, VACCINES AND THE RECOVERY                                                                                                                              15
Economy Chapter Graphs
                                                                                                              GRAPH 7
                                                                                                          GRAPH 7
                                                                    Average Monthly Initial Unemployment Claims:
                                                                    AVERAGE MONTHLY INITIAL UNEMPLOYMENT CLAIMS:
                                                                             Hampton   Roads,2007-2020
                                                                             HAMPTON ROADS,    2007-2020

                    35,000

                                                                                                                                                                                                             28,656
                    30,000

                    25,000
   Initial Claims

                    20,000

                    15,000

                    10,000                                              8,257

                     5,000
                              2,733                                                                                                                                                                  2,174

                        0
                                2007

                                              2008

                                                             2009

                                                                           2010

                                                                                         2011

                                                                                                       2012

                                                                                                                     2013

                                                                                                                                   2014

                                                                                                                                                 2015

                                                                                                                                                               2016

                                                                                                                                                                              2017

                                                                                                                                                                                            2018

                                                                                                                                                                                                      2019

                                                                                                                                                                                                                2020
 Sources: Virginia Employment Commission and the Dragas Center for Economic Analysis and Policy, Old Dominion University. Data are not seasonally adjusted and do not include PUA and PEUC claims.
 Sources: Virginia Employment Commission and the Dragas Center for Economic Analysis and Policy, Old Dominion University. Data are not seasonally adjusted and do not include PUA and PEUC claims.

16                   THE STATE OF THE REGION | HAMPTON ROADS 2021
GRAPH 8
                                                                                                                                        GRAPH 8
                                                                                                Monthly Initial Unemployment Claims:
                                                                                            MONTHLY INITIAL UNEMPLOYMENT CLAIMS:
                                                                                           HAMPTON ROADS,
                                                                                           Hampton  Roads,JANUARY
                                                                                                             January2019-JUNE
                                                                                                                     2019-June2021
                                                                                                                                2021

                   90,000
                                                                                                                                                               76,723
                   80,000

                   70,000

                   60,000
  Initial Claims

                   50,000

                   40,000
                                                                                                                                                                                                                                                                                 8,113
                   30,000

                   20,000

                   10,000                                                                                                 1,961

                       0
                                                       Apr-19
                                                                May-19

                                                                                  Jul-19

                                                                                                    Sep-19

                                                                                                                      Nov-19
                                                                                                                               Dec-19
                                                                                                             Oct-19

                                                                                                                                                                   Apr-20
                                                                                                                                                                            May-20

                                                                                                                                                                                              Jul-20

                                                                                                                                                                                                                Sep-20

                                                                                                                                                                                                                                  Nov-20
                                                                                                                                                                                                                                           Dec-20
                                                                                                                                                                                                                         Oct-20

                                                                                                                                                                                                                                                                               Apr-21
                                                                                                                                                                                                                                                                                        May-21
                            Jan-19
                                     Feb-19
                                              Mar-19

                                                                         Jun-19

                                                                                           Aug-19

                                                                                                                                        Jan-20
                                                                                                                                                 Feb-20
                                                                                                                                                          Mar-20

                                                                                                                                                                                     Jun-20

                                                                                                                                                                                                       Aug-20

                                                                                                                                                                                                                                                    Jan-21
                                                                                                                                                                                                                                                             Feb-21
                                                                                                                                                                                                                                                                      Mar-21

                                                                                                                                                                                                                                                                                                 Jun-21
Sources: Virginia Employment Commission and the Dragas Center for Economic Analysis and Policy, Old Dominion University. Data are not seasonally adjusted and do not include PUA and PEUC claims.

Sources: Virginia Employment Commission and the Dragas Center for Economic Analysis and Policy, Old Dominion University. Data are not seasonally adjusted and do not include PUA and PEUC claims.

                                                                                                                                                    8

SHOCK AND AWE? COVID-19, VACCINES AND THE RECOVERY                                                                                                                                                                                                                                                        17
GRAPH 9
                                                                                                                          GRAPH 9
                                                                                               Continued Unemployment Claims:
                                                                              CONTINUED UNEMPLOYMENT CLAIMS:
                                                                    HAMPTON ROADS, WEEK ENDING MARCH 14, 2020-JULY 31, 2021
                                                              Hampton Roads, Week Ending March 14, 2020-July 31, 2021

                      100,000
                                                  88,436
                       90,000

                       80,000

                       70,000
   Continued Claims

                       60,000

                       50,000

                       40,000

                       30,000
                                                                                                                                                          13,936
                       20,000
                                                                                                                                                                                                                                      7,771

                       10,000
                                            4,315
                           0
                                         Apr-20

                                                  Apr-20

                                                           May-20

                                                                                      Jul-20

                                                                                                                 Sep-20

                                                                                                                                            Nov-20

                                                                                                                                                     Dec-20
                                                                                                                          Oct-20

                                                                                                                                   Oct-20

                                                                                                                                                                                                           Apr-21

                                                                                                                                                                                                                    May-21

                                                                                                                                                                                                                             May-21

                                                                                                                                                                                                                                               Jul-21

                                                                                                                                                                                                                                                        Jul-21
                                Mar-20

                                                                    Jun-20

                                                                             Jun-20

                                                                                               Aug-20

                                                                                                        Aug-20

                                                                                                                                                              Jan-21

                                                                                                                                                                       Jan-21

                                                                                                                                                                                Feb-21

                                                                                                                                                                                         Mar-21

                                                                                                                                                                                                  Mar-21

                                                                                                                                                                                                                                      Jun-21
Sources: Virginia Employment Commission and the Dragas Center for Economic Analysis and Policy, Old Dominion University. Data are not seasonally adjusted and do not include PUA and PEUC claims.
  Sources: Virginia Employment Commission and the Dragas Center for Economic Analysis and Policy, Old Dominion University. Data are not seasonally adjusted and do not include PUA and PEUC claims.

18                       THE STATE OF THE REGION | HAMPTON ROADS 2021
Will The Lost Jobs                                                                 in the second half of 2021 as schools reopen fully and hospitals return to
                                                                                   the normal pattern of elective surgeries. While the delta variant may require

Come Back?                                                                         masking in public schools and hospitals, limiting outbreaks is key to a
                                                                                   sustained economic recovery. Local government payrolls may lag other sectors
In January 2020, there were a record 804,500 jobs in                               due to the nature of the public budget cycle. Cities and counties typically hold
Hampton Roads (Graph 10). Prospects for the region were                            budget meetings in winter and spring and start the new budget year on July
improving: defense spending was projected to increase,                             1. There is a lag between improving economic conditions, tax revenues and
travel and tourism looked forward to another banner year                           government hiring.
and global trade volumes were expected to recover from the
                                                                                   The open question is whether Hampton Roads will better its record from the
effects of ill-conceived trade conflicts with China and Europe.
                                                                                   previous economic expansion. From February 2010, which represents the
Three months later, however, employers had cut 1 in 10 jobs in
                                                                                   trough in nonfarm payrolls following the Great Recession, to the end of the
the region as the COVID-19 pandemic continued to extract its
                                                                                   expansion in February 2020, the United States increased nonfarm payrolls
economic toll.
                                                                                   by 17.6% (Graph 12). Over the same period, nonfarm payrolls in Hampton
Thankfully, the region did not remain at the nadir of job losses for long, but     Roads increased by 9.5%. At the lowest point of the COVID-19 recession,
the climb back to the prepandemic peak has been arduous and is not yet             the U.S. had shed almost all the jobs created over the previous economic
complete. By October 2020, almost 65,000 of the lost jobs had returned, but        expansion. For Hampton Roads, the experience was more traumatic. The
progress has been slow in 2021. From January to June 2021, the region shed         region not only shed all the jobs gained over the previous decade, but it
jobs while job growth accelerated at the national level. The erosion in payrolls   bottomed out with 5% fewer jobs than at the worst point following the Great
finally halted in June 2020, but the region still remains 42,100 jobs below the    Recession.
peak observed in January 2020.
                                                                                   It seems that Hampton Roads is playing the same, sad song.
To understand why, we can gain perspective by diving into the numbers. We          While job growth accelerated at the national level, the region
ask: Which sectors have grown since 2019 and which have shrunk? We                 (again) fell behind. The Hampton Roads economy may pick
compare the number of jobs from each sector in Hampton Roads to the same           up speed in the coming months as travel and tourism and
month in 2019; otherwise, we might bias our conclusions given the significant      defense spending increase, but the question remains: Have
declines in nonfarm payrolls in the first half of 2020.                            we addressed the causes of our relatively tepid growth in the
                                                                                   previous economic expansion, or have we grown increasingly
While there were 33,000 fewer jobs in June 2021 than in June                       reliant and complacent, ignoring the real possibility that the
2019, 84.4% (28,100) of the job losses were concentrated in                        largess of the federal government could one day come to an
three sectors: leisure and hospitality, education and health                       end?
services, and local government (Graph 11).

Two of the three sectors, leisure and hospitality and education and health
services, should ameliorate the losses in 2021. As domestic travel increases,
demand for hotels, restaurants, bars and other leisure and hospitality services
will rise. We should observe increased hiring in education and health services

SHOCK AND AWE? COVID-19, VACCINES AND THE RECOVERY                                                                                                               19
GRAPH 10
                                                                                                               GRAPH 10
                                                                                 Nonfarm Payrolls in Hampton Roads,
                                                                           NONFARM PAYROLLS (JOBS) IN HAMPTON ROADS:
                                                                                  January
                                                                                   JANUARY2020-May      2021
                                                                                            2020-JUNE 2021

                        820
                              804.5
                        800

                        780
                                                                                                                                764.5                            767
                                                                                                                                                                                                              762.4
                        760
    Thousands of Jobs

                        740

                        720

                                                          699.8
                        700

                        680

                        660

                        640

                                                                                                                                                                                                     May-21
                                                                        May-20

                                                                                                                       Sep-20

                                                                                                                                                        Dec-20

                                                                                                                                                                                   Mar-21

                                                                                                                                                                                            Apr-21
                                                 Mar-20

                                                             Apr-20

                                                                                                Jul-20

                                                                                                            Aug-20

                                                                                                                                   Oct-20

                                                                                                                                               Nov-20

                                                                                                                                                                 Jan-21
                               Jan-20

                                                                                                                                                                          Feb-21

                                                                                                                                                                                                               Jun-21
                                        Feb-20

                                                                                    Jun-20

Sources: Bureau of Labor Statistics and the Dragas Center for Economic Analysis and Policy, Old Dominion University. Data are seasonally adjusted.

  Sources: Bureau of Labor Statistics and the Dragas Center for Economic Analysis and Policy, Old Dominion University. Data are seasonally adjusted.

                                                                                                                     10

20                        THE STATE OF THE REGION | HAMPTON ROADS 2021
GRAPH 11
                                                                                                           GRAPH 11
                                                                       Change in Nonfarm Payrolls: Hampton Roads,
                                                             CHANGE IN NONFARM PAYROLLS (JOBS) IN HAMPTON ROADS:
                                                                            JUNE 2019-JUNE
                                                                            June 2019-June 2021
                                                                                             2021

       Transport, Warehouse, Utilities                                                                                                                                                    3,300

              Prof. and Business Services                                                                                                                                             1,500

 Mining, Logging, and Construction                                                                                                                                                    1,300

                         Federal Government                                                                                                                                     800

                                Wholesale Trade                                                                                                                     -300    I
                                        Retail Trade                                                                                                         -1,100

                             Financial Activities                                                                                                           -1,300

                                         Information                                                                                                        -1,500

                              State Government                                                                                                           -2,300

                                    Manufacturing                                                                                                       -2,700

                                    Other Services                                                                                                                    -29

                              Local Government                                                                                             -4,800

         Education and Health Services                                                                             -8,400

                     Leisure and Hospitality                         -14,900

                                                         -18,000                    -14,000                    -10,000                     -6,000                -2,000         2,000             6,000

Sources: Bureau of Labor Statistics and the Dragas Center for Economic Analysis and Policy, Old Dominion University. Data are nonseasonally adjusted.

Sources: Bureau of Labor Statistics and the Dragas Center for Economic Analysis and Policy, Old Dominion University. Data are nonseasonally adjusted.

                                                                                                                     11

SHOCK AND AWE? COVID-19, VACCINES AND THE RECOVERY                                                                                                                                                        21
GRAPH 12

                                                                                            GRAPH
                                                                             Cumulative Growth     12
                                                                                               in Nonfarm Payrolls (Jobs):

                                                                     CUMULATIVE GROWTH
                                                                          Hampton Roads,INFebruary
                                                                                           NONFARM   PAYROLLS2021
                                                                                                   2010-June  (JOBS):
                                                                        HAMPTON ROADS, FEBRUARY 2010-JUNE 2021

                               120
                                                                                                                                                                                          117.6

                                                                                                                                                                                                                       112.4
                               115
 Index (February 2010 = 100)

                               110

                                                                                                                                                                                                  109.5
                               105

                                                                                                                                                                                                                          103.9
                               100

                               95                                                                                                                                                   95.3

                               90
                                     Feb-10

                                              Feb-11

                                                       Feb-12

                                                                          Feb-13

                                                                                            Feb-14

                                                                                                               Feb-15

                                                                                                                                 Feb-16

                                                                                                                                                    Feb-17

                                                                                                                                                                      Feb-18

                                                                                                                                                                                         Feb-19

                                                                                                                                                                                                            Feb-20

                                                                                                                                                                                                                              Feb-21
                                                                                    -       United States
                                                                                                                        -    Hampton Roads

Sources: U.S. Bureau of Labor Statistics and the Dragas Center for Economic Analysis and Policy, Old Dominion University. Data are seasonally adjusted. The trough in nonfarm payrolls following the Great

Recession was February 2010.
 Sources: U.S. Bureau of Labor Statistics and the Dragas Center for Economic Analysis and Policy, Old Dominion University. Data are seasonally adjusted. The trough in nonfarm payrolls following the Great Recession was February 2010.

22                               THE STATE OF THE REGION | HAMPTON ROADS 2021
Can Hampton Roads Rely                                                                                       The Office of Management and Budget (OMB) projects the DOD budget will
                                                                                                             grow at (or more likely below) the rate of inflation for the next five years. After

On Defense Spending?                                                                                         several years of increasing budgets, the base budget is flat in real terms, and
                                                                                                             it is likely that future direct spending in Hampton Roads will remain near FY
In an age when investors jump into “meme stocks” like GameStop and AMC or                                    2022 levels as a result.
invest in cryptocurrencies like Bitcoin and Dogecoin, the idiom that one should
                                                                                                             Even the relatively modest increases in the DOD budget in the coming years
not put all their eggs in one basket continues to apply. While we may read
                                                                                                             could well be constrained by the unbridled spending habits of Congress
about the lucky investor who can now retire thanks to a fortuitous investment
                                                                                                             and the president. The last time the federal government ran a surplus was
(gamble) in GameStop, we cannot forget that there are two sides to every
                                                                                                             FY 2000, and that was quickly undone by tax cuts in 2001 and 2003, as
trade. When fortunes turn, those who bet their life savings on an unlikely stock
                                                                                                             well as the fiscal impact of wars in Iraq and Afghanistan (Graph 15). After
or cleverly named cryptocurrency can suddenly find themselves adrift.
                                                                                                             the fiscal response to the Great Recession, budget discipline (to some extent)
The Department of Defense (DOD) has fueled the Hampton Roads economy for                                     and economic growth reduced the deficit to $442 billion in FY 2015. By FY
decades. As illustrated in Graph 13, from 2000 to 2008, DOD spending in the                                  2019, the deficit had reached $984 billion as the Tax Cuts and Jobs Act of
region increased by almost 73%. It should be no surprise that economic activity                              2017 reduced revenue growth, and the discretionary spending caps were
flourished during this period. When the Budget Control Act of 2011 and                                       abandoned. The fiscal response to the COVID-19 pandemic was relatively
subsequent modifications moderated the growth in defense spending, however,                                  swift and large in magnitude and likely staved off an ever-greater economic
our economy faltered. In the latter half of the last decade, Congress lifted and                             shock. However, the deficit rocketed to $3.1 trillion in FY 2020. While the
finally eliminated the discretionary spending caps that constrained the DOD                                  federal deficit may also approach $3 trillion in FY 2021, the passage of a
base budget. Concurrently, direct DOD spending in the region increased,                                      large infrastructure bill and proposed increases in nondefense discretionary
powering economic activity and job growth.                                                                   spending would certainly yield higher deficits in the future.

We estimate that direct DOD spending in Hampton Roads                                                        While we cannot say for certain when markets will demand
will reach almost $25 billion in 2021. If one includes the                                                   higher rates of return for U.S. treasuries, we do know that the
ripple effects of this spending, 4 of every 10 dollars spent in                                              federal debt exceeded 100% of U.S. gross domestic product in
Hampton Roads can be traced back to the DOD. It should be no                                                 FY 2020. Even if we exclude holdings of the Federal Reserve,
surprise that defense spending is one of the pillars (if not the                                             the federal government owes the public $17 trillion. By mid-
central pillar) of the regional economy.                                                                     decade, this debt will certainly top $20 trillion. At some point,
                                                                                                             the butcher’s bill will come due, and when it does, the federal
President Joe Biden proposed a base DOD budget of $715 billion for FY                                        government will find itself having to raise taxes and cut
2022, a 1.6% increase from FY 2021 (Graph 14).4 In inflation-adjusted terms,                                 expenditures. The DOD, as the largest discretionary program
this represents a real decline in the DOD base budget, and that assumes this                                 in the federal government, is an obvious target in such a
modest nominal increase makes it past opposition from some in the president’s                                scenario.
own party in Congress.

4 W
   e note that the DOD now presents the base budget as the combination of what used to be the base budget
  and the overseas contingency operations (OCO) budgets.

SHOCK AND AWE? COVID-19, VACCINES AND THE RECOVERY                                                                                                                                            23
GRAPH 13
                                                                                                           GRAPH 13
                                                      Estimated Direct Department of Defense Spending in Hampton Roads,
                                                           ESTIMATED DIRECT DEPARTMENT OF DEFENSE SPENDING IN HAMPTON ROADS,
                                                                                        2000-2021
                                                                                        2000-2021

                                $30

                                                                                                                                                                                                                           $24.8
                                $25
                                                                                                                                                                                                                 $23.5
  Billions of Nominal Dollars

                                                                                                                                     $19.8
                                $20

                                                                                                $17.3

                                $15

                                      $10.0
                                $10

                                 $5
                                      2000

                                             2001

                                                    2002

                                                           2003

                                                                  2004

                                                                         2005

                                                                                2006

                                                                                         2007

                                                                                                  2008

                                                                                                            2009

                                                                                                                     2010

                                                                                                                              2011

                                                                                                                                        2012

                                                                                                                                                 2013

                                                                                                                                                           2014

                                                                                                                                                                    2015

                                                                                                                                                                              2016

                                                                                                                                                                                       2017

                                                                                                                                                                                                 2018

                                                                                                                                                                                                          2019

                                                                                                                                                                                                                    2020

                                                                                                                                                                                                                             2021
Sources: Department of Defense and the Dragas Center for Economic Analysis and Policy, Old Dominion University. Includes federal civilian and military personnel and procurement. Data for 2020 and 2021 are estimates.

Last updated on Dec. 19, 2020. Procurement data updated on May 18, 2021.

 Sources: Department of Defense and the Dragas Center for Economic Analysis and Policy, Old Dominion University. Includes federal civilian and military personnel and procurement. Data for 2020 and 2021 are estimates. Last updated on
 Dec. 19, 2020. Procurement data updated on May 18, 2021.
                                                                                                                      1

24                                THE STATE OF THE REGION | HAMPTON ROADS 2021
GRAPH 14
                                                                                                           GRAPH 14
                                                                 Department of Defense Discretionary Budget Authority,
                                                                  DEPARTMENT OF DEFENSE DISCRETIONARY BUDGET AUTHORITY,
                                                                            FISCAL Year
                                                                           Fiscal  YEAR 2010-FISCAL
                                                                                        2010-Fiscal YEAR 2026*
                                                                                                      Year 2026

                                $900

                                $800                                                                                                                                                                                    $780
                                                                                                                                                                                                            $763
                                                                                                                                                                                                $747
                                                                                                                                                               $730
                                       $691 $687                                                                                                $704 $704 $715
                                                                                                                                    $685
                                $700                                                                                       $665
                                                        $645
  Billions of Nominal Dollars

                                                                                                            $605
                                $600                             $577 $581                      $580
                                                                                    $560

                                $500

                                $400

                                $300

                                $200

                                $100

                                 $0
                                        FY 10

                                                FY 11

                                                         FY 12

                                                                  FY 13

                                                                           FY 14

                                                                                       FY 15

                                                                                                   FY 16

                                                                                                              FY 17

                                                                                                                            FY 18

                                                                                                                                      FY 19

                                                                                                                                                  FY 20

                                                                                                                                                              FY 21

                                                                                                                                                                          FY 22

                                                                                                                                                                                      FY 23

                                                                                                                                                                                                  FY 24

                                                                                                                                                                                                              FY 25

                                                                                                                                                                                                                          FY 26
Sources: Dragas Center for Economic Analysis and Policy, Old Dominion University; Office of Management and Budget FY 2022 Presidential Budget (Table 20-1 Policy); and Office of the Secretary of Defense (Comptroller)

Department of Defense Fiscal Year 2022 Budget Request (May 2021). The FY 2022 budget presentation includes overseas contingency operations (OCO) in the DOD base budget. For backwards comparison, we present
 Sources:
the DOD Dragas
          base asCenter  for Economic
                    the sum           Analysis and
                             of base funding   and OCO
                                                   Policy, funding.
                                                           Old Dominion
                                                                    DoesUniversity;
                                                                         not includeOffice of Management
                                                                                       emergency   budgetand Budget FY 2022 Presidential Budget (Table 20-1 Policy); and Office of the Secretary of Defense (Comptroller) Department of
                                                                                                          authority.
 Defense Fiscal Year 2022 Budget Request (May 2021). The FY 2022 budget presentation includes overseas contingency operations (OCO) in the DOD base budget. For backwards comparison, we present the DOD base as the sum of base
 funding and OCO funding. Does not include emergency budget authority. *FY 2022 to FY 2026 data are projections.
                                                                                                                      14

SHOCK AND AWE? COVID-19, VACCINES AND THE RECOVERY                                                                                                                                                                                  25
GRAPH 15
                                                                                                            GRAPH 15
                                                 Federal Budget Surplus or Deficit in Millions of Nominal Dollars,
                                                      FEDERAL BUDGET SURPLUS OR DEFICIT IN MILLIONS OF NOMINAL DOLLARS,

                           $500,000
                                       '                           Fiscal  Year
                                                                      FISCAL YEAR2000-Fiscal   Year2021
                                                                                  2000-FISCAL YEAR  2021

                                              $236,241

                                 $0

                          -$500,000

                         -$1,000,000                                                                                                                              -$441,960
    Surplus or Deficit

                         -$1,500,000
                                                                                                            -$1,412,688

                         -$2,000,000

                         -$2,500,000

                         -$3,000,000
                                                                                                                                                                                   -$3,129,234

                         -$3,500,000

                                                                                                                                                                                                            -$3,668,679
                         -$4,000,000
                                       2000

                                               2001

                                                        2002

                                                                 2003

                                                                          2004

                                                                                  2005

                                                                                           2006

                                                                                                    2007

                                                                                                            2008

                                                                                                                     2009

                                                                                                                              2010

                                                                                                                                       2011

                                                                                                                                               2012

                                                                                                                                                        2013

                                                                                                                                                                 2014

                                                                                                                                                                          2015

                                                                                                                                                                                  2016

                                                                                                                                                                                           2017

                                                                                                                                                                                                    2018

                                                                                                                                                                                                            2019

                                                                                                                                                                                                                     2020

                                                                                                                                                                                                                              2021
Sources: Dragas Center for Economic Analysis and Policy, Old Dominion University, and Office of Management and Budget FY 2022 Presidential Budget (Table 1.1 – Summary of Receipts, Outlays, and Surpluses or

Deficits: 1789 - 2026). Estimated deficit for FY 2021.

   Sources: Dragas Center for Economic Analysis and Policy, Old Dominion University, and Office of Management and Budget FY 2022 Presidential Budget (Table 1.1 – Summary of Receipts, Outlays, and Surpluses or Deficits: 1789 - 2026).
   Estimated deficit for FY 2021.

                                                                                                                   15

26                         THE STATE OF THE REGION | HAMPTON ROADS 2021
Cybersecurity And Budgets:                                                                                  Cost and schedule overruns impact current and future capabilities. To pay
                                                                                                            for modernization efforts, the Marine Corps is planning to eliminate tanks,

Two Immediate Challenges                                                                                    nine helicopter squadrons, three infantry battalions and three military police
                                                                                                            battalions, among others. The Army has come to a similar realization that it
Even if the Department of Defense budget remains constant in real terms, there                              can either increase end strength or modernize the force, but not both.
are strategic challenges that, if left unaddressed, will lead to unacceptable
                                                                                                            In its FY 2022 budget proposal, the Air Force proposed cutting 200 aircraft
levels of risk. The ransomware infection of Colonial Pipeline on May 7, 2021,
                                                                                                            from the current fleet to redirect resources to research and development.8
illustrated the vulnerability of critical infrastructure to cyberattack. The U.S.
military is increasingly reliant on networked systems to achieve battlefield
superiority – networks that may be vulnerable to intrusion and attack. Even if
the military networks are secure, if hackers were to attack civilian firms that
supply the DOD, could the U.S. military be rendered impotent and find itself
                                                                                                            The Battlefield Is Changing:
unable to fight protracted battles? Without aggressive investments in offensive                             Can The DOD Respond?
and defensive cyber capabilities, the nation and its armed forces will remain
vulnerable to cyberattack.                                                                                  U.S. forces have long enjoyed air superiority on the battlefield. Air superiority
                                                                                                            not only allows soldiers to maneuver without fear of reprisal, but it also
A more immediate challenge that hits closer to home is the rising cost of                                   provides them the security to build large bases and operate sophisticated
weapons systems. The Congressional Research Service noted that the estimated                                supply chains, as well as the luxury of planning when and where to strike the
procurement costs of the Ford-class carriers remain an area of concern.                                     enemy. The Gulf War of 1991 illustrated how air superiority and the ability
Relative to the procurement costs of the FY 2008 budget, the estimated                                      to maneuver ground forces in secret can create significant tactical advantage.
procurement costs of nuclear aircraft carriers CVN 78, CVN 79 and CVN                                       While Iraqi forces hunkered down in Kuwait anticipating an amphibious
80 have grown 27%, 29.8% and 15.8%, respectively.5 Even if the carriers                                     invasion, the coalition forces used airpower to help ground forces “swing
represent a significant leap in capabilities, can the U.S. Navy afford to put                               around” Iraqi defense in Kuwait (see photo on page 28).
these multibillion-dollar assets at risk in the South China Sea or Persian Gulf?
Or will it have to surround these carriers with an increasing number of other                               The 2nd Armored Cavalry Regiment (2nd ACR) provided the punch to the
ships and submarines to lower vulnerability?                                                                campaign against Iraqi forces. During an 82-hour span, the 2nd ACR moved
                                                                                                            120 miles and engaged elements of five different Iraqi divisions. At the
The Navy is not the only military service with programs that have run over                                  Battle of 73 Easting on Feb. 26, 1991, the 2nd ACR fought alongside the 1st
schedule and budget. For the Air Force, the F-35 program’s lifecycle program                                Infantry Division’s (1st ID) two leading brigades against elements of the Iraqi
cost is likely to exceed $1.7 trillion.6 Also, the Air Force’s KC-46 tanker is                              12th Armored Division and the Tawakalna Division of the Iraqi Republican
restricted in the operations it can perform, has cost Boeing $5 billion in                                  Guard. Even though the U.S. forces were outnumbered, the 2nd ACR and 1st
unanticipated fixes and was characterized as a $226 million “lemon” by Rep.                                 ID destroyed 160 tanks, 180 personnel carriers, 12 artillery pieces and more
Rob Wittman, R-Virginia, in a June 2021 Armed Services Committee hearing.7                                  than 80 wheeled vehicles, effectively wiping out several Iraqi brigades.
5 Congressional Research Service, “Navy Ford (CVN-78) Class Aircraft Carrier Program: Background and
   Issues for Congress,” June 7, 2021.
6 https://www.stripes.com/news/us/pentagon-reportedly-estimates-that-the-f-35-budget-plan-is-running-10-
   billion-short-through-2025-1.644700.
7 https://www.defensenews.com/air/2021/06/17/more-cost-overruns-are-coming-down-the-line-for-boeing-       8 https://www.msn.com/en-us/news/us/the-commandant-of-the-marine-corps-is-charging-into-the-future-but-
   as-the-kc-46-program-logs-another-two-technical-deficiencies/.                                              some-arent-ready-for-change/ar-AAMpBsS.

SHOCK AND AWE? COVID-19, VACCINES AND THE RECOVERY                                                                                                                                                            27
air defense systems and military personnel. The widespread use of drones
                                                                                    allowed Azerbaijan to attack Armenia’s command and control and supply
                                                                                    elements, which were positioned behind the front lines. Armenian forces found
                                                                                    themselves unable to resupply, limited in maneuver and exposed to attacks on
                                                                                    a constant basis. Azerbaijani forces secured a decisive victory, in part due to
                                                                                    the widespread use of unmanned aircraft.

                                                                                    The list of countries and nonstate actors using drones continues to grow,
                                                                                    increasing the threat to U.S. forces around the globe. The Iranian Revolutionary
                                                                                    Guard aptly demonstrated this potential threat when it claimed it had
                                                                                    overflown the USS Nimitz with an unmanned aircraft as it passed through the
                                                                                    Strait of Hormuz in 2020 (see photo on page 29).9 It’s not much of a leap to
                                                                                    envision a future where the battlefield is dominated by unmanned aircraft and
                                                                                    vehicles, and large manned platforms represent targets of opportunity.

 M-1A1 ABRAMS FROM THE 3RD ARMORED DIVISION: OPERATION DESERT STORM, 1991.
 U.S. NATIONAL ARCHIVES

 The Battle of 73 Easting may well have been the last time that U.S. forces fight
 a major tank-on-tank battle. The Gulf War demonstrated the foolishness of
 engaging the U.S. military in force-on-force combat. While the U.S. continued
 to wield advanced weaponry on the battlefields of Iraq and Afghanistan into
 this century, the enemy had learned that direct engagement was an unwise,
 if not deadly, decision. During these conflicts, our forces found themselves
 engaged in a low-intensity conflict where the enemy often used cheap
 improvised explosive devices (IEDs) to counter the technological advantages of
 the U.S. military.
                                                                                    AZERBAIJAN DRONE STRIKE ON AN ARMENIAN TANK. AZERBAIJAN MINISTRY OF DEFENSE, SEPTEMBER
 A seismic shift is now underway on the modern battlefield. In the fall of 2020,    2020. HTTPS://WWW.YOUTUBE.COM/WATCH?V=0Y7IUN8UQ-U
 Armenia and Azerbaijan engaged in an armed conflict over the territory of
 Nagorno-Karabakh. What differentiated this conflict was Azerbaijan’s heavy
 use of drones against Armenian forces (see photo below). The Azerbaijanis
 procured drones from Israel and Turkey and also converted older manned
 aircraft to unmanned aircraft. This drone-centric strategy included the use
 of “kamikaze drones,” which dove into targets with an explosive load.
 These drone strikes inflicted serious losses among Armenian tanks, artillery,      9 h
                                                                                       ttps://www.express.co.uk/news/world/1426268/World-War-3-fears-iran-drone-footage-aircraft-carrier-
                                                                                      US-warship-video-vn.

28          THE STATE OF THE REGION | HAMPTON ROADS 2021
Hampton Roads has long built and maintained large ships and
                                                                                     submarines, platforms that are increasingly vulnerable to the
                                                                                     cybersecurity and drone revolutions on the modern battlefield.
                                                                                     As costs rise, the DOD is faced with the choice of maintaining
                                                                                     current weapons systems or investing in modernization
                                                                                     efforts. Currently, many of our “new” weapons programs are
                                                                                     evolutions of existing platforms: a newer carrier, submarine,
                                                                                     fighter aircraft, bomber or wheeled vehicle.

                                                                                     We are at an inflection point in military affairs. Unmanned
                                                                                     combat aircraft will be followed by unmanned ships and
                                                                                     submarines. The Turkish Bayraktar TB2 can loiter above the
                                                                                     battlefield for 27 hours without refueling and at a fraction
                                                                                     of the cost of a manned aircraft. The DOD, at some point,
                                                                                     will have to pivot toward newer weapons systems that are
IRANIAN REVOLUTIONARY GUARD DRONE PHOTO OF THE USS NIMITZ, JULY 2020. HTTPS://WWW.   cheaper, quicker to build and more autonomous. When this
THEGUARDIAN.COM/WORLD/2020/SEP/23/IRAN-DRONE-US-AIRCRAFT-CARRIER-REPORT              happens, our military services will need fewer soldiers,
                                                                                     sailors, airmen and Marines. Instead of an aircraft carrier with
The U.S. military is facing asymmetries in warfare and cost structure. Tanks
                                                                                     5,000 sailors, imagine a drone cargo carrier with hundreds
and armored personnel carriers require long supply chains and are vulnerable
                                                                                     of unmanned (and expendable) aircraft and only hundreds
to IEDs and drone attacks. The F-35 costs $36,000 an hour to operate and
                                                                                     of sailors. Hampton Roads would not fare well in such a
requires sophisticated supply chains, as well as large air bases. The Navy’s
                                                                                     transition.
carriers are increasingly expensive to procure, test and, eventually, operate
at sea. The Air Force’s MQ-9 Reaper drone is more capable than the Turkish           Change is coming. It may not be today or tomorrow, but within
Bayraktar TB2 (used by an increasing number of countries) but is also                years the force structure of the U.S. military will need to adapt
estimated to be six times more expensive than the Turkish drone.                     to the advances in technology or have change forced upon it
                                                                                     on a future battlefield. The question for us in Hampton Roads
While history generally does not repeat, when it comes to weapons systems,
                                                                                     is whether we will realize early enough that diversification of
the current U.S. warfare strategy echoes that of battleship-centric countries
                                                                                     the economic base is no longer a luxury but a necessity for the
after World War I. Once considered crucial to naval power, battleships were
                                                                                     continued vitality of the region.
soon outdated due to the rise of naval aviation. Innovation diminished the
utility of these large warships; the last one commissioned by the United States
was the USS Missouri in 1944. By 1960, the last battleship ever built, the HMS
Vanguard, was sold for scrap.

SHOCK AND AWE? COVID-19, VACCINES AND THE RECOVERY                                                                                                  29
Home Is Where The Heart Is                                                           As shown in Graph 18, the median sales price climbed from $237,300 (June
                                                                                      2018) to $245,000 (June 2019) to $254,900 (June 2020) to $289,900 (June

 (If You Can Afford It)                                                               2021). We remind the reader that Hampton Roads was just emerging from the
                                                                                      trough of the pandemic shock in May 2020, yet the real estate market barely
 Five years ago, the tale of the Hampton Roads real estate market was spun            seemed to notice the economic turmoil. The first half of 2021 was a seller’s
 around the lasting impact of the Great Recession. Foreclosures continued             market, with prices climbing through the spring and into summer.
 to retard growth in single-family home prices, and while sales of previously
                                                                                      While the real estate market has been, to borrow a term from ESPN, “en
 owned homes were increasing, there was nostalgia for the “good years” prior
                                                                                      fuego” for the last three years, we must also avoid recency bias. We need only
 to the recession. The onset of the pandemic brought a measure of worry, but
                                                                                      return to 2007, when real estate and equities were a “sure thing” and one
 this was quickly set aside as sales and valuations continued to increase in
                                                                                      could “never lose.” Rising inflation and deficits will likely lead to increasing
 2020. Now, with 2021 drawing to a close, the losses of the Great Recession
                                                                                      interest rates sooner rather than later. As capital becomes more expensive, the
 have been cast aside as the housing market continues to surge to new heights.
                                                                                      market for homes will cool and the rapid gains of recent times will retreat into
 Graph 16 illustrates the seasonal nature of the Hampton Roads housing market         memory. It may be time to be more, rather than less, cautious about how the
 and the transitory impact of the COVID-19 economic shock. Sales of existing          real estate market will perform over the coming 24 months.
 single-family homes increased from 2,810 in July 2019 to 3,175 in July 2020,
 a jump of 13%. In 2021, sales continued to bound upward, with the number of
 homes sold rising by 30.6% from April 2020 to April 2021, 38.2% from May
 2020 to May 2021 and 28.9% from June 2020 to June 2021. There were
 numerous reports of sellers receiving multiple offers above the asking price and
 entering into sales contracts within days of listing their homes.

 There are, as economists are fond of saying, two sides of a market. Low
 interest rates, coupled with a K-shaped economic shock that left salaried
 workers largely unaffected, meant that demand for single-family homes
 continued to rise during a global pandemic. On the other hand, the supply
 side of the housing market contracted as the inventory of homes for sale fell
 precipitously in 2020 and into 2021 (Graph 17). The inventory of existing
 homes declined by more than half (53.5%) between June 2019 and June
 2021. Falling inventories were largely due to brisk sales relative to new listings
 coming on the market. With demand increasing and supply falling, there was
 only one direction for median housing prices to go, and that was up.

30          THE STATE OF THE REGION | HAMPTON ROADS 2021
You can also read