Shoreline Management Challenges and Solutions in St. Johns County
←
→
Page content transcription
If your browser does not render page correctly, please read the page content below
Shoreline Management Challenges
 and Solutions in St. Johns County
                 Florida shore & Beach Preservation Association
   33rd   National Conference on Beach Preservation Technology
                                            February 5-7, 2019

                                Presented by: Stephen Hammond

                   Co-Author: Damon Douglas and Rajesh Srinivas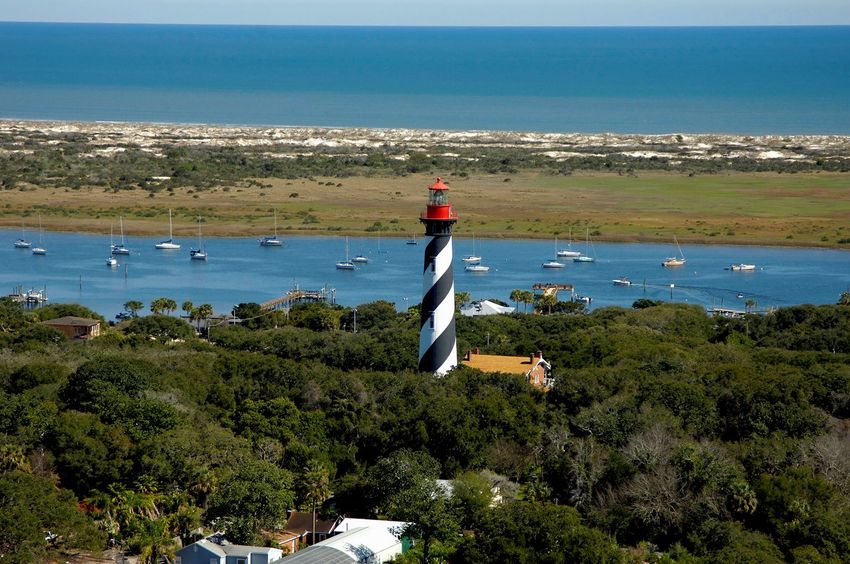
Agenda
• Background
• Project Overview
• Challenges and Solutions
• Questions

Background
• St. Johns County has 42 miles of Atlantic
  Coastline
• The County manages 32 miles of the shoreline
• FDEP designates 16.3 miles of our shoreline
  as critically eroded
• Another eight miles of non-designated beach
  also requires attention
• Primary causes of erosion:
    • Historic - St. Augustine and Matanzas
      Inlets
    • Present – Inlets, Hurricanes, Overwash,
      Seawalls
Ongoing Shoreline Management
                  Initiatives
• USACE 50-year Projects
   • Anastasia State Park and St. Augustine Beach R137-R151
       • Construction began in 2001
   • South Ponte Vedra Beach-Vilano Beach R102.5-R117.5
       • Construction in 2020
• Non-Federal Projects
   • Ponte Vedra Beach R1-R46
       • Construction planned for 2021
   • South Ponte Vedra Beach R76-R102.5
       • Construction planned for early 2021
• FEMA Emergency Projects
   • Countywide (excluding parks, USACE project areas)
• Holistic long-term planning – working towards a strategic beach
  management plan
St. Johns County Shore Protection Project
• Federal project, authorizes:
   • Extent = R137 to R150
   • Length = 2.5 miles
   • 60 ft berm extension at 9.0 ft NAVD88
   • Renourishment interval = 5 years
• Borrow Area: St. Augustine Inlet Channel
  and Ebb Shoal
• Cost Shares: Federal 80.5%, State 8.5%,
  County 11%

St. Johns County Shore Protection Project
• Initial construction 2001-2003 (in two phases)
• Renourishment in 2005 (FCCE), 2012, and 2018
• Affected by Hurricanes Frances and Jeanne in 2004, Matthew in 2016, Irma in 2017, Dorian in
  2019
    • Project area performed very well protecting upland infrastructure
• Total sand volume placed = 9.45 Mcy
                         Date      Volume Placed            Length           Segment
                            2003          3,800,000           2.7           R137-R151
                            2005          2,800,000           2.7           R137-R151
                            2012          2,100,000           1.5           R139-R147
                            2018           750,000            0.9         R139.7-R144.4

• In 2018, the amount of inlet sand allowed to be dredged by a revised IMP (2014) dictated the
  placement volume
    • Revised IMP restricts ebb shoal and navigation channel dredging to 179,000 cy/yr
St. Johns County Shore Protection Project

Pre-Initial Construction (circa 2000)   2018 Construction   2018 Post-Construction

St. Johns County SPP Pre and Post Dorian

   Pre-Dorian               Post Dorian
   08/28/2019               09/07/2019

St. Johns County SPP Performance

Note: sand remaining is relative to 1998 conditions (before initiation of beach nourishment program)

Coastal Storm Risk Management Project

• USACE Project
  • Authorized by 2018 WRDA
• Length – Three Miles
  • R102.5 to R117.5
• 50-year Project
  • Initial Nourishment: 1,310,000 cy
  • Renourishment: 866,000 cy every 12 years
• 50-year Project Cost = $145M
• Borrow Site – St. Augustine Inlet Flood Shoals
Coastal Storm Risk Management Project
• 2018 US Bipartisan Budget Act   Typical Construction Template
  appropriated $36M for initial
  construction.
• USACE just completed the JCP
  process, permit due in March
  2020.
• Project scheduled to begin
  construction in July 2020.

                                                                  Courtesy of USACE
Ponte Vedra Beach Management
Project
• Extends from R1 to R46, about nine miles.
• Currently in the project development and permitting
phase.
• Engineering Formulation
• Borrow Area Definition
• Environmental Documents Preparation
• Permitting – FDEP, USACE; BOEM Lease
• Funding – combination of state’s special
appropriations, MSTU, County tourism taxes.
• Construction anticipated to begin in 2021.South Ponte Vedra Dune and
Berm Restoration Project
• One-time project using State’s Hurricane Matthew
Recovery funding.
• Extent – R76 to R102.5, just over five miles
• South end ties-in with new federal project
• Beach volume expected to be about 20 cy/ft on
average
• Sands from borrow area in federal waters
• Requires a lease from BOEM
• Currently in design and permitting stage
• Funding – combination of State’s Post-Matthew
Recovery funds, MSTU, and County funds
• Construction anticipated to begin early 2021FEMA Emergency Berms
• Hurricanes Matthew and Irma caused tremendous erosion
Recent Storm-Related Volume Change Above MHW
Length
Beach Segment
Matthew Impact 2016 Irma Impact 2017 Total
ft cy cy/ft cy cy/ft cy cy/ft
Ponte Vedra R1-R46 46,733 -253,268 -5 -472,997 -10 -726,265 -16
South Ponte Vedra R67-R101 35,406 -363,288 -10 -117,251 -3 -480,539 -14
South Ponte Vedra and Vilano R101-R122 22,173 -290,609 -13 -113,927 -5 -404,536 -18
St. Augustine, Butler, Crescent R-151-R194 43,480 -443,276 -10 -436,380 -10 -879,657 -20
Summer Haven R-197-209 12,576 -44,191 -4 -16,108 -1 -60,299 -5
Countywide* 160,368 -1,394,632 -9 -1,156,663 -7 -2,551,295 -16
• *Excludes parks
• Matthew data for R197-R209 excludes over wash landward of
monument
• Irma data is from FDEP report
• Irma data for R151-R194 is approximateFEMA Emergency Berms • Hurricane Matthew – Countywide Sand Loss
FEMA Emergency Berms
• County applied for Category B Emergency Berms under FEMA’s Public
  Assistance Program
    • Emergency berms are meant to protect properties from a 5-year storm
• Determined eligible sand replacement volumes on a reach-by-reach
  basis countywide, excluding federal project areas and parks.
                                                                                                 Replacement Sand Volume
                                                                                         Matthew          Irma           Total
Reach                   Location                        Extents   Shoreline Length, ft     CY              CY             CY
  1     Ponte Vedra Beach I                         R1-R23                      22,822         78,358         109,181       187,539
  2     Ponte Vedra Beach II                        R23-R46                     24,106        101,338          93,152       194,490
  4     South Ponte Vedra Beach I                   R67-R84                     17,921         95,477          34,695       130,172
  5     South Ponte Vedra Beach II                  R84-R100                    16,447         45,291          32,877         78,168
  6     South Ponte Vedra Beach III, Vilano Beach   R100-R117                   17,703         43,973          34,955         78,928
  7     Vilano Beach                                R117-R122                    5,508         14,780          20,777         35,557
 10     Butler Beach                                R151-R173                   22,272         65,483          24,212         89,695
 11     Crescent Beach                              R173-R194                   20,811         95,416          61,573       156,989
 13     Summer Haven Beach                          R203-R209                   13,076         45,280          59,613       104,893
                                                                               160,666        585,396         471,035     1,056,431
FEMA Emergency Berms • Sands proposed to be obtained from upland mines • Truck hauled to the placement areas • Sand replacement costs expected to be about $30M • FEMA completed an EA on sand berms in Oct 2019 • The County is preparing to initiate construction while waiting for FEMA to complete its Project Worksheets
Strategic Beach Management Planning
• Recently hired a coastal engineer
• Currently developing estimates of shoreline changes and beach
  volume changes
   •   Really long-term – ~1870s to present (shoreline change only)
   •   Long-term – Early 1970s to present
   •   Intermediate-term – pre-2004 storm season to present
   •   Short-term – pre-2016 hurricane to present
• Shoreline change – beach volume change relationships
• Examples of some of the products we have developed so far in the
  discussion of long term planning.
Challenges and Solutions
Coastal Storm Risk Management Project
Challenge:
  • Authorization documents                      Project's Original Cost Share
    determined a huge local            Entity      Initial Construction Renourishment
    share:                             Federal            23.0%              17.7%
    • Parking was inadequate and a   Non-Federal          77.0%              82.3%
      2,200-ft segment lies in a
      CBRU                              State             13.8%              14.8%

    • County had a few beach           County             63.1%              67.5%
      accesses in the project area
      with no eligible parking
Coastal Storm Risk Management Project
Solution:
• County staff worked to improve the projects cost share by: Project's Original Cost Share
• Looking for gaps in “eligible” shorelines (FDEP and USACE)
Entity Initial Construction Renourishment
• Inventorying existing open and unopened beach accesses
• Developing potential parking improvement alternatives Federal 23.0% 17.7%
• Considering community feedback Non-Federal 77.0% 82.3%
• Actions
State 13.8% 14.8%
• Increased spaces at an existing park to convert a
secondary beach access to a primary beach access County 63.1% 67.5%
• Added two new parking lots
Project's New Cost Share
• Added bike parking at two accesses
Entity Initial Construction Renourishment
• Received clarification guidance from SAD allowing USACE
to cost share on publicly owned lands in CBRU Federal 29.0% 22.3%
• Results Non-Federal 71.0% 77.7%
• County expects to save about $4M for the initial State 24.6% 26.9%
construction, and about $20M over the three
renourishment County 46.4% 50.8%South Ponte Vedra Dune and Berm
Restoration Project
Challenge:
• How to place 10 cy/ft of sand on a severely eroded beach
• Seawalls covering majority of the project coastline
• Dry beach only present at low tideSouth Ponte Vedra Dune and Berm
Restoration ProjectSouth Ponte Vedra Dune and Berm
Restoration Project
Solution:
• Switched from a truck haul project to a dredge project.
• Moved the borrow source offshore allowing the project to go from 10
cy/lf to 20 cy/lf for the same price if not less.
• Developing a design template that manages the shoreline
irregularities.Long Term Planning
St. Johns County Beach Management
                Plan
• Analyzing historical shoreline data to develop an understanding of
  what is trending throughout the 42 miles of coastline.
   • Shoreline Change per Year
   • Volume Change per Year
• Use this and additional data to develop a plan to manage the
  coastline.
• This plan can be used as a decision making tool to develop new
  projects.
County Wide Rate of Shoreline Change
The Rate of Shoreline Change (ft/yr)
Matthew and Irma
~1870 - 2017 1972 - 2017 2003 - 2017 2016 - 2017
Reach Avg Avg Avg Avg R-Monument
County Northern Boundary
Ponte Vedra Beach 1 0 -1 -4
R-1-46
GTMNERR 1 0 -1 2
R-47-67
South Ponte Vedra Beach 0 -1 -3 -16
R-68-102
South Ponte Vedra Beach
0 -2 -2 -17
and Vilano Beach CSRM R-103-122
St. Augustine Inlet
Anastasia State Park 19 2 -5 -57
R-123-137
St. Augustine Beach SPP 1 6 -2 -65
R-138-152
Butler Beach 6 5 2 -73
R-152-173
Crescent Beach 2 2 -3 -42
R-174-194
Fort Matanzas State Park 0 -3 -10 -18
R-195-196
Matanzas Inlet
Summer Haven -2 -1 -7 0
R-197-209 County Southern Boundary
*Data in table represents preliminary data analysis resultsCrescent Beach Rate of Shoreline Change
*Data in figures represents preliminary data analysis resultsSummary • The County has been heavily impacted by recent strong storm events causing extensive damage to our coastline. • Multiple projects are emerging to help mitigate this damage along the County’s coastline. • The County is working to develop a long term beach management plan to better understand our changing coastline and position the County to address future needs.
Thank You!
You can also read