Short and long term exposure to air pollution increases the risk of ischemic heart disease
←
→
Page content transcription
If your browser does not render page correctly, please read the page content below
www.nature.com/scientificreports
OPEN Short and long term exposure
to air pollution increases the risk
of ischemic heart disease
So Young Kim1, Sang Hoon Kim2, Jee Hye Wee3, Chanyang Min4,5, Sang‑Min Han6,
Seungdo Kim7 & Hyo Geun Choi3,4,8*
Previous studies have suggested an increased risk of ischemic heart disease related to air pollution.
This study aimed to explore both the short-term and long-term effects of air pollutants on the risk
of ischemic heart disease after adjusting for meteorological factors. The Korean National Health
Insurance Service-Health Screening Cohort from 2002 to 2013 was used. Overall, 2155 participants
with ischemic heart disease and 8620 control participants were analyzed. The meteorological data and
air pollution data, including SO2 (ppm), NO2 (ppm), O3 (ppm), CO (ppm), and particulate matter (PM)10
(μg/m3), were analyzed using conditional logistic regression. Subgroup analyses were performed
according to age, sex, income, and region of residence. One-month exposure to SO2 was related
to 1.36-fold higher odds for ischemic heart disease (95% confidence interval [95% CI] 1.06–1.75).
One-year exposure to SO2, O3, and PM10 was associated with 1.58- (95% CI 1.01–2.47), 1.53- (95%
CI 1.27–1.84), and 1.14 (95% CI 1.02–1.26)-fold higher odds for ischemic heart disease. In subgroup
analyses, the ≥ 60-year-old group, men, individuals with low income, and urban groups demonstrated
higher odds associated with 1-month exposure to SO2. Short-term exposure to SO2 and long-term
exposure to SO2, O3, and PM10 were related to ischemic heart disease.
Ischemic heart disease is a fatal disease with high morbidity and mortality. The prevalence increased from the
early twentieth century to the 1960s, likely due to the increase in smoking and high fat intake, which promote
the development of coronary atherosclerosis1. Although the prevalence and mortality of ischemic heart disease
have decreased, it is still one of the leading causes of mortality worldwide2,3. Atherosclerotic and calcified plaques
in coronary arteries have been described as the main pathologies of ischemic heart disease4. Inflammation in
the cardiovascular system has been suggested to cause these changes in coronary vessels and to be linked with
systemic inflammatory d iseases5.
Although early diagnosis and intervention increase the survival rate of ischemic heart disease, the primary
prevention of ischemic heart disease might be most effective at reducing disease burden. Several modifiable
risk factors have been reported, including the lifestyle factors of obesity, alcohol consumption, and tobacco
smoking6–8. In addition to these lifestyle factors, which are largely dependent on individuals, an accumulating
number of studies has documented that environmental factors, including toxic compounds, could be modifiable
factors to prevent the risk of ischemic heart disease at the social level9.
Many previous epidemiologic studies have described an increased risk of ischemic heart disease related to air
pollution10–16, particularly long-term exposure to air p ollution11,17. On the other hand, the effect of short-term
exposure to air pollution has also been suggested, with some conflicting fi ndings10,18. A case-crossover study
reported that a 10 µg/m3 increase in exposure to fine particulate pollution (particulate matter with an aerody-
namic diameter ≤ 2.5 µm; PM2.5) was associated with a 4.5% increased risk of ischemic heart disease (95% CI
1.1–8.0)10. However, a time-series study demonstrated that increased exposure to sulfur dioxide (SO2), but not
PM2.5 or nitrogen dioxide ( NO2), for 3 days was related to an increased risk of ischemic heart disease m ortality18.
1
Department of Otorhinolaryngology‑Head and Neck Surgery, CHA Bundang Medical Center, CHA University,
Seongnam, South Korea. 2Department of Internal Medicine, CHA Bundang Medical Center, CHA University,
Seongnam, South Korea. 3Department of Otorhinolaryngology‑Head and Neck Surgery, Hallym University
College of Medicine, Anyang, South Korea. 4Hallym Data Science Laboratory, Hallym University College of
Medicine, Anyang, South Korea. 5Graduate School of Public Health, Seoul National University, Seoul, South
Korea. 6Political Science (Climate and Environmental Policy), Graduate School of Global Cooperation, Hallym
University, Chuncheon, South Korea. 7Research Center for Climate Change and Energy, Hallym University,
Chuncheon, South Korea. 8Hallym Institute for Environmental Diseases (HIED), Chuncheon, South Korea. *email:
pupen@naver.com
Scientific Reports | (2021) 11:5108 | https://doi.org/10.1038/s41598-021-84587-x 1
Vol.:(0123456789)www.nature.com/scientificreports/
Figure 1. A schematic illustration of the participant selection process used in the present study. Of 1,125,691
participants, 2155 ischemic heart disease participants were matched with 8620 control participants for age,
group, sex, income group, and region of residence. Then, ischemic heart disease patients and control participants
were matched according to the meteorological data and air pollution data before the index date.
The heterogeneous study design, regional and ethnic differences and types of measured pollutants might have
contributed to these controversial results.
Few studies have reported a wide range of air pollution exposure periods from short-term to long-term
exposure. Moreover, when exploring the effect of air pollution, meteorological factors should be concurrently
considered because the concentration and composition of air pollutants might be influenced by these factors, and
the risk of cardiovascular disease could be associated with meteorological factors, such as ambient t emperature19.
For instance, the solubility of air pollutants is increased at lower temperatures, and the photolysis reaction could
change the composition of air pollutants. Therefore, this study analyzed the effect of air pollutants on ischemic
heart disease according to exposure periods prior to the development of ischemic heart disease. To evaluate
this effect, we calculated the mean levels of air pollutants for time periods from 3 to 730 days of exposure. To
minimize the confounding effects of meteorological factors, they were concurrently analyzed for their associa-
tion with ischemic heart disease.
Materials and methods
Participant selection. This study was approved by the Ethics Committee of Hallym University (2017-
I102) and was exempt from requiring informed consent20. All procedures were followed in accordance with the
relevant guidelines. The Korean National Health Insurance Service-Health Screening Cohort (NHIS-HEALS),
meteorological, and air pollution data were used (S1 description)20–22.
Participants with ischemic heart disease were selected from 514,866 patients with 497,931,549 medical claim
codes (n = 2239)20–22. Among these participants, individuals were excluded if they were diagnosed with ischemic
heart disease before 2004 (n = 80) to track previous exposure to meteorological factors in the last 2 years. The con-
trol group included those without a history of ischemic heart disease from 2002 through 2013 (n = 512,627)20–22.
The control participants were 1:4 matched for age, sex, income, region of residence, and index date20.
The index date of ischemic heart disease participants was set as the time of diagnosis of ischemic heart
disease20–22. Some ischemic heart disease participants were excluded because there were not enough matched
control participants (n = 4). Collectively, 2155 ischemic heart disease participants were 1:4 matched with 8620
control participants (Fig. 1)20–22.
We analyzed meteorological and air pollution data over a mean of 3 days, 5 days, 10 days, 15 days, 1 month
(30 days), 2 months (60 days), 3 months (90 days), 6 months (180 days), 9 months (270 days), 1 year (365 days),
18 months (540 days), and 2 years (730 days) before the date of diagnosis or the index date in each participant
according to their region of residence.
Variables. Independent variables. Daily mean temperature (°C), daily highest temperature (°C), daily low-
est temperature (°C), relative humidity (%), ambient atmospheric pressure (hPa), S O2 (ppm), NO2 (ppm), O
3
Scientific Reports | (2021) 11:5108 | https://doi.org/10.1038/s41598-021-84587-x 2
Vol:.(1234567890)www.nature.com/scientificreports/
(ppm), CO (ppm), and P M10 (μg/m3) for 3 days, 5 days, 10 days, 15 days, 1 month (30 days), 2 months (60 days),
3 months (90 days), 6 months (180 days), 9 months (270 days), 1 year (365 days), 18 months (540 days), and
2 years (730 days) were analyzed as independent variables (S1 description)20. These data were gathered from Air
Korea, which is managed by the Ministry of Environment of Korea23. The air pollution and meteorological fac-
tors measured at the closest points to the region of residence of participants were applied for analyses.
Dependent variable. Ischemic heart disease was classified using ICD-10 codes (I20-I25). Among the partici-
pants, those who were hospitalized because of ischemic heart disease or who died because of ischemic heart
disease were included24.
Covariate. Age groups were classified in 5-year intervals: 40–44, 45–49, 50–54…, and 85 + years old. Income
groups were divided into 5 classes (class 1 [lowest income]-5 [highest income]). The region of residence was
grouped into urban and rural areas25.
Tobacco smoking, alcohol consumption, and obesity using BMI (body mass index, kg/m2) were included26.
The Charlson Comorbidity Index (CCI) was i ncluded27,28.
Statistical analyses. The general characteristics of the ischemic heart disease and control groups were
compared using the chi-square test20. The mean meteorological and air pollution data 30 days and 365 days
before the index date were compared using independent t-tests.
To analyze the odds ratios (ORs) with the 95% confidence intervals (CIs) of meteorological and air pollution
data for ischemic heart disease participants compared to control participants, a crude model (simple model),
adjusted model (all insertion model), and final model (backward selection of variables) were calculated using
conditional logistic r egression20. As ORs of independent variables were calculated as continuous variables, they
were displayed as SO2 per 0.01 ppm, N O2 per 0.1 ppm, O
3 per 0.01 ppm, CO per 1 ppm, and P M10 per 10 μg/
m3. In these analyses, age, sex, income, and region of residence were stratified. In the analyses of 3 days, 5 days,
10 days, 15 days, 30 days, 60 days, 90 days, 180 days, 270 days, 365 days, 540 days, and 730 days of exposure,
we selected 30 days as the short-term exposure and 365 days as the long-term e xposure20. The results of other
days of exposure are displayed in the supplemental file (Supplementary Tables S2–S12). To select final models,
Akaike information criterion and Baysian information criterion of air pollutants were analyzed (Supplementary
Table S13). The correlations between meteorological and air pollutants were provided as supplemental tables
(Supplementary Tables S14–S15).
For the subgroup analysis, we divided participants by age, sex, income, and region (< 60 years old
and ≥ 60 years old; men and women; low income [income 1–3] and high income [income 4–5]; urban and rural,
respectively) in the final m odel20.
Two-tailed analyses were performed, and significance was defined as P values less than 0.05. SAS version 9.4
(SAS Institute Inc., Cary, NC, USA) was used for statistical a nalyses20.
Results
Regarding meteorological and air pollution data, S O2 for 30 days, temperature (mean, highest, and lowest),
relative humidity, SO2, NO2 and CO for 365 days were different between the ischemic heart disease group and
the control group (all P < 0.05, Table 1).
For 30 days of exposure, the OR was 1.36 (95% CI 1.06–1.75, Fig. 2) for S O2 (0.01 ppm) in the ischemic heart
disease group compared with the control group using the final model (Table 2).
For one-year exposure, the ORs were 0.98 (95% CI 0.96–0.99) for relative humidity (%), 1.58 (95% CI
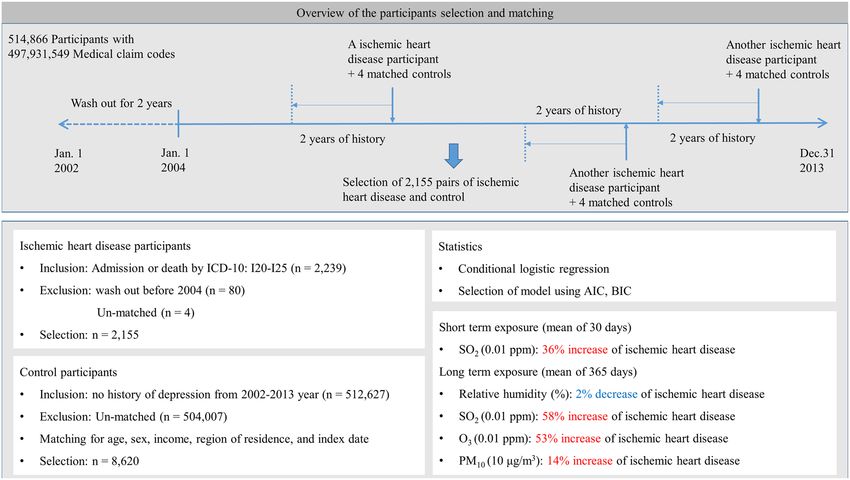
1.01–2.47, Fig. 2) for SO2 (0.01 ppm), 1.53 (95% CI 1.27–1.84, Fig. 3) for O3 (0.01 ppm), and 1.14 (95% CI
1.02–1.26, Fig. 4) for PM10 (10 μg/m3) in the ischemic heart disease group compared with the control group
using the final model (Table 3).
According to the duration of exposures, the exposure of S O2 (0.01 ppm) was positively related with ischemic
heart disease in 3 days, 5 days, 10 days, 15 days, 30 days, 60 days, 90 days, 180 days, 270 days, 365 days, and
540 days of exposure (Fig. 2 and Supplementary Table S1). For P M10 (10 μg/m3), 365 days and 730 days of P M10
3
(10 μg/m ) exposure were positively related with ischemic heart disease (Fig. 4). For O 3 (0.01 ppm), 365 days,
540 days, and 730 days of O 3 (0.01 ppm) exposure were positively related with ischemic heart disease (Fig. 3).
The exposure of N O2 (0.1 ppm) for 60 days, 90 days, 180 days, and 270 days was negatively related with ischemic
heart disease (Fig. 5).
In the subgroup analyses using the final model, in the age groups < 60 years old and ≥ 60 years old, the odds
for O3 and PM10 were higher in ischemic heart disease participants than in the control group after 1 year of
exposure. In the age ≥ 60 years group, the odds for S O2 were higher in ischemic heart disease participants than
in the control group after 30 days and one year of exposure. In men, individuals with low income, and urban
groups, the odds for SO2 for 30 days of exposure and odds for O3 and PM10 for one year of exposure were higher
in ischemic heart disease patients than in the control group. In the high-income and rural groups, the odds for
SO2 for one year of exposure were higher in ischemic heart disease patients than in the control group (Table 4).
Discussion
Both short-term and long-term exposure to air pollutants were related to ischemic heart disease in the present
study. The types of air pollutants that impacted ischemic heart disease differed according to exposure period.
Short-term (30 days) exposure to S O2 was related to higher odds of ischemic heart disease. For long-term
(365 days) exposure, higher levels of S O2, O3, and P
M10 were associated with ischemic heart disease. In addition,
Scientific Reports | (2021) 11:5108 | https://doi.org/10.1038/s41598-021-84587-x 3
Vol.:(0123456789)www.nature.com/scientificreports/
Total participants
Characteristics IHD Control P-value
Age (years old, n, %) 1.000
40–44 12 (0.6) 48 (0.6)
45–49 62 (2.9) 248 (2.9)
50–54 139 (6.5) 556 (6.5)
55–59 151 (7.0) 604 (7.0)
60–64 176 (8.2) 704 (8.2)
65–69 315 (14.6) 1260 (14.6)
70–74 408 (18.9) 1632 (18.9)
75–79 397 (18.4) 1588 (18.4)
80–84 364 (16.9) 1456 (16.9)
85 + 131 (6.1) 524 (6.1)
Sex (n, %) 1.000
Male 1447 (67.2) 5788 (67.2)
Female 708 (32.9) 2832 (32.9)
Income (n, %) 1.000
1 (lowest) 475 (22.0) 1900 (22.0)
2 304 (14.1) 1216 (14.1)
3 308 (14.3) 1232 (14.3)
4 411 (19.1) 1644 (19.1)
5 (highest) 657 (30.5) 2628 (30.5)
Region of residence (n, %) 1.000
Urban 831 (38.6) 3324 (38.6)
Rural 1324 (61.4) 5296 (61.4)
Charlson comorbidity index (n, %) < 0.001*
0 1938 (89.9) 8352 (96.9)
1 34 (1.6) 26 (0.3)
2 41 (1.9) 41 (0.5)
3 34 (1.6) 33 (0.4)
≥4 108 (5.0) 168 (2.0)
Obesity (BMI, kg/m2, n, %) < 0.001*
< 18.5 (underweight) 143 (6.6) 376 (4.4)
≥ 18.5 to < 23 (normal) 833 (38.7) 3290 (38.2)
≥ 23 to < 25 (overweight) 511 (23.7) 2224 (25.8)
≥ 25 to < 30 (obese I) 604 (28.0) 2512 (29.1)
≥ 30 (obese II) 64 (3.0) 218 (2.5)
Smoking status (n, %) < 0.001*
Nonsmoker 1310 (60.8) 5746 (66.7)
Past smoker 262 (12.2) 1242 (14.4)
Current smoker 583 (27.1) 1632 (18.9)
Alcohol consumption (n, %) < 0.001*
< 1 time a week 1682 (78.1) 6412 (74.4)
≥ 1 time a week 473 (22.0) 2208 (25.6)
Meteorological and air pollution data (mean, SD)
Mean temperature for 30 days (°C) 12.2 (9.5) 12.1 (9.5) 0.868
Highest temperature for 30 days (°C) 17.4 (9.3) 17.4 (9.3) 0.937
Lowest temperature for 30 days (°C) 7.7 (9.9) 7.6 (9.9) 0.805
Relative humidity for 30 days (%) 65.2 (10.1) 65.4 (10.0) 0.308
Ambient atmospheric pressure for 30 days (hPa) 1006.3 (7.5) 1006.3 (7.4) 0.707
SO2 for 30 days (ppb) 5.7 (1.9) 5.6 (1.9) 0.016*
NO2 for 30 days (ppb) 23.5 (8.1) 23.8 (8.2) 0.129
O3 for 30 days (ppb) 23.3 (8.2) 23.1 (8.3) 0.243
CO for 30 days (ppb) 571.4 (182.4) 571.0 (179.3) 0.940
PM10 for 30 days (μg/m3) 52.0 (14.5) 51.9 (14.8) 0.862
Mean temperature for 365 days (°C) 12.9 (1.3) 12.8 (1.2) 0.004*
Highest temperature for 365 days (°C) 18.1 (1.1) 18.0 (1.1) 0.009*
Continued
Scientific Reports | (2021) 11:5108 | https://doi.org/10.1038/s41598-021-84587-x 4
Vol:.(1234567890)www.nature.com/scientificreports/
Total participants
Characteristics IHD Control P-value
Lowest temperature for 365 days (°C) 8.4 (1.8) 8.3 (1.7) 0.009*
Relative humidity for 365 days (%) 65.7 (4.5) 65.9 (4.5) 0.020*
Ambient atmospheric pressure for 365 days (hPa) 1005.7 (4.6) 1005.8 (4.5) 0.435
SO2 for 365 days (ppb) 5.6 (1.1) 5.5 (1.2) 0.004*
NO2 for 365 days (ppb) 23.3 (6.5) 23.7 (6.7) 0.021*
O3 for 365 days (ppb) 23.7 (3.7) 23.3 (3.7) < 0.001*
CO for 365 days (ppb) 567.0 (110.2) 570.4 (105.2) 0.201
PM10 for 365 days (μg/m3) 52.3 (7.2) 52.2 (7.2) 0.713
Table 1. General characteristics of the participants. IHD ischemic heart disease, BMI body mass index (kg/
m2), ppb parts per billion, ppm part per million (= 1000 ppb), SD standard deviation. *Chi-square test or
independent t-test. Significance at P < 0.05.
Figure 2. The odds ratios (95% confidence interval) of SO2 (0.01 ppm) for 3 days, 5 days, 10 days, 15 days,
30 days, 60 days, 90 days, 180 days, 270 days, 365 days, and 540 days for ischemic heart disease.
the effects of air pollutants on ischemic heart disease were different according to the demographic factors of age
and sex and the socioeconomic factors of income level and region of residence.
Short-term exposure to S O2 was associated with higher odds of ischemic heart disease in this study. In line
with the present results, previous studies have reported elevated mortality related to short-term exposure to
SO218,29. Although some prior studies demonstrated an association between exposure to PM10, SO2, and NO2
with the disease burden of ischemic heart disease (years of life lost), one time-series study reported that SO2, but
not other air pollutants or PMs, was related to the increased mortality of ischemic heart disease (excess risk of
death = 3.18%, 95% CI 1.19–5.17)18. They found that gaseous pollutants, such as S O2, had higher impacts on the
risk of ischemic heart disease than PMs18. Oxidative stress and the inflammatory response have been suggested
as possible pathophysiologic mechanisms for the impact of SO2 on ischemic heart disease30. Sulfate exposure for
2–7 days was associated with oxidative stress markers of urinary creatinine-indexed 8-epi-prostaglandin F2α in
the Framingham heart s tudy30.
Short-term exposure to other air pollutants, including NO2 and P M10, did not show an association with
ischemic heart disease in the present study. Previous epidemiologic studies have suggested that the source or
components of PMs are crucial for their hazardous impact on ischemic heart d isease11. The P
M2.5 from wind-
blown soil or biomass combustion was not associated with ischemic heart m ortality11. The present study could
Scientific Reports | (2021) 11:5108 | https://doi.org/10.1038/s41598-021-84587-x 5
Vol.:(0123456789)www.nature.com/scientificreports/
Odds ratio for ischemic heart disease (95% CI)
Characteristics Crudea P-value Adjusteda,b P-value Finala,c P-value
Mean temperature for 30 days (°C) 1.00 (1.00–1.01) 0.864 0.90 (0.65–1.24) 0.506
Highest temperature for 30 days (°C) 1.00 (1.00–1.01) 0.935 1.04 (0.89–1.21) 0.660
Lowest temperature for 30 days (°C) 1.00 (1.00–1.01) 0.798 1.09 (0.92–1.29) 0.334
Relative humidity for 30 days (%) 1.00 (0.99–1.00) 0.271 0.99 (0.98–1.00) 0.045*
Ambient atmospheric pressure for 30 days (hPa) 1.00 (0.99–1.01) 0.697 1.00 (0.99–1.01) 0.923
SO2 for 30 days (0.01 ppm) 1.36 (1.07–1.75) 0.014* 1.74 (1.18–2.56) 0.005* 1.36 (1.06–1.75) 0.015*
NO2 for 30 days (0.1 ppm) 0.59 (0.31–1.11) 0.099 0.40 (0.15–1.07) 0.066
O3 for 30 days (0.01 ppm) 1.04 (0.98–1.10) 0.227 0.98 (0.89–1.09) 0.727
CO for 30 days (ppm) 1.01 (0.77–1.32) 0.939 1.02 (0.61–1.73) 0.935
PM10 for 30 days (10 μg/m3) 1.00 (0.97–1.04) 0.859 1.01 (0.96–1.07) 0.593
Table 2. Crude and adjusted odd ratios (95% confidence interval) of the meteorological and pollution matter
(mean of 30 days before the index date) for ischemic heart disease. *Conditional logistic regression model,
Significance at P < 0.05. a Stratified model for age, sex, income, and region of residence. b Adjusted model was
adjusted for obesity, smoking status (current smoker compared to nonsmoker or past smoker), frequency of
alcohol consumption (≥ 1 time a week compared to < 1 time a week), CCI score, mean temperature, highest
temperature, lowest temperature, relative humidity, atmospheric pressure, S O2, NO2, O3, CO, and P M10. c Final
model was adjusted for obesity, smoking status (current smoker compared to nonsmoker or past smoker),
frequency of alcohol consumption (≥ 1 time a week compared to < 1 time a week), CCI score, relative humidity,
SO2, NO2, O3, CO, and P
M10 using the backward selection method.
Figure 3. The odds ratios (95% confidence interval) of O3 (0.01 ppm) for 365 days, 540 days, and 730 days for
ischemic heart disease.
not differentiate the sources of P M10 because its heterogeneous composition could attenuate its adverse impacts
on ischemic heart disease.
Long-term exposure to S O2, O3, and P M10 was related to higher odds of ischemic heart disease in this study.
A large amount of previous epidemiologic data supports the long-term effects of air pollutants on the risk of
ischemic heart d isease31,32. The mortality of ischemic heart disease was 1.03-fold higher in patients who were
exposed to a high level of P M2.5 in the form of diesel traffic-related elemental carbon (95% CI 1.00–1.06) from
Scientific Reports | (2021) 11:5108 | https://doi.org/10.1038/s41598-021-84587-x 6
Vol:.(1234567890)www.nature.com/scientificreports/
Figure 4. The odds ratios (95% confidence interval) of PM10 (10 μg/m3) for 365 days and 730 days for ischemic
heart disease.
Odds ratio for ischemic heart disease (95% CI)
Characteristics Crudea P-value Adjusteda,b P-value Finala,c P-value
Mean temperature for 365 days (°C) 1.07 (1.03–1.12) 0.001* 0.89 (0.40–1.96) 0.768
Highest temperature for 365 days (°C) 1.06 (1.02–1.11) 0.009* 1.00 (0.70–1.43) 0.989
Lowest temperature for 365 days (°C) 1.06 (1.02–1.10) 0.001* 1.09 (0.72–1.66) 0.689
Relative humidity for 365 days (%) 0.98 (0.96–0.99) 0.002* 0.97 (0.95–0.99) 0.001* 0.98 (0.96–0.99) 0.002*
Ambient atmospheric pressure for 365 days
1.00 (0.99–1.01) 0.413 1.01 (0.99–1.02) 0.516
(hPa)
SO2 for 365 days (0.01 ppm) 1.84 (1.22–2.77) 0.004* 1.88 (1.12–3.18) 0.017* 1.58 (1.01–2.47) 0.045*
NO2 for 365 days (0.1 ppm) 0.35 (0.16–0.79) 0.011* 0.18 (0.04–0.90) 0.037*
O3 for 365 days (0.01 ppm) 1.31 (1.15–1.50) < 0.001* 1.27 (0.98–1.64) 0.070 1.53 (1.27–1.84) < 0.001*
CO for 365 days (ppm) 0.73 (0.46–1.15) 0.174 0.81 (0.38–1.70) 0.569
PM10 for 365 days (10 μg/m3) 1.01 (0.95–1.09) 0.701 1.19 (1.12–3.18) 0.001* 1.14 (1.04–1.26) 0.007*
Table 3. Crude and adjusted odd ratios (95% confidence interval) of the meteorological and pollution matter
(mean of 365 days before the index date) for ischemic heart disease. *Conditional logistic regression model,
Significance at P < 0.05. a Stratified model for age, sex, income, and region of residence. b Adjusted model was
adjusted for obesity, smoking status (current smoker compared to nonsmoker or past smoker), frequency of
alcohol consumption (≥ 1 time a week compared to < 1 time a week), CCI score, mean temperature, highest
temperature, lowest temperature, relative humidity, atmospheric pressure, S O2, NO2, O3, CO, and P M10. c Final
model was adjusted for obesity, smoking status (current smoker compared to nonsmoker or past smoker),
frequency of alcohol consumption (≥ 1 time a week compared to < 1 time a week), CCI score, relative humidity,
SO2, NO2, O3, CO, and P
M10 using the backward selection method.
2000 to 2005 in the U S11. Multiple pathophysiologic mechanisms, including the systemic inflammatory response,
prothrombotic pathway activation, oxidative stress, vascular dysfunction and remodeling, autonomic dysfunc-
tion, and epigenetic factors, have been proposed to mediate the impact of air pollutants on ischemic heart
disease12. For instance, coronary artery calcification was proposed as one of the pathophysiologic mechanisms
for the effect of air pollutants, including PMs and O3, on the risk of ischemic heart disease24,33. The coronary
artery calcium score, which is considered an atherosclerotic marker, was associated with elevated levels of P M2.5
Scientific Reports | (2021) 11:5108 | https://doi.org/10.1038/s41598-021-84587-x 7
Vol.:(0123456789)www.nature.com/scientificreports/
Figure 5. The odds ratios (95% confidence interval) of NO2 (0.1 ppm) for 60 days, 90 days, 180 days, and
270 days for ischemic heart disease.
(27.2%, 95% CI 10.8–46.1%)31. Although the pathophysiologic mechanism of the effect of O3 on ischemic heart
disease remains elusive, oxidizing activities could induce inflammation in the coronary artery, which might
result in atherosclerotic plaque formation and narrowing of the arterial lumen with increasing wall t hickness32.
To support this hypothesis, it was reported that long-term exposure to O 3 was related to increased thickness
of the common carotid artery (5.6 µm, 95% CI 1.4–9.7) and carotid plaque burden (OR 1.2, 95% CI 1.1–1.4)32.
The relative humidity for one year was negatively associated with ischemic heart disease in this study. Previ-
ous studies have suggested the contributions of meteorological factors of temperature variability with the risk
of ischemic heart disease, although no prior research investigated the association of humidity with ischemic
heart disease34,35. The potential impact of humidity on the solubility of gaseous pollutants and moisture content,
which may decrease the amount of air pollutant exposure, could mediate the decreased rate of ischemic heart
disease in high humidity conditions.
The impacts of air pollutants were prominent in the old age group and men in this study. Previous studies
have also suggested the higher susceptibility of older populations and men to the impacts of air pollutants on
ischemic heart d isease18,31. Preformed or subclinical atherosclerotic changes of the coronary artery could more
easily progress due to the impacts of air pollutants on inflammation and atherosclerosis, although the synergistic
or additive effects of air pollutants could not be determined in the current study. The high prevalence of ischemic
heart disease in men compared to that in women could strengthen the statistical power in this population. In
addition, populations with poor socioeconomic status showed a relationship between short-term exposure to
SO2 and ischemic heart disease in this study. Several previous studies investigated socioeconomic disparities and
the impact of a higher burden of air pollution on morbidities and mortalities in minorities, although the results
had some heterogeneity according to the air pollution m odels36,37. Populations with poor socioeconomic status
have been reported to be exposed to more air pollution because of the lack of availability of air conditioning and
increased industrial exposure38–41. In addition to high exposure to air pollution, poor socioeconomic groups were
reported to have increased susceptibility to air pollution due to underlying health statuses and reduced access to
medical care38. The association of short-term exposure to SO2 and ischemic heart disease in the urban subgroup
might be attributed to the higher level of air pollution in urban areas than in rural areas.
The analysis of a large, representative national cohort population strengthened the statistical power of the
present study. The large study population enabled the selection of a control population that was matched for age,
sex, income, and region of residence. Possible confounders were comprehensively considered in this study. In
addition to past medical histories, lifestyle factors of smoking, alcohol consumption, and obesity were adjusted.
Moreover, meteorological factors were concurrently considered along with air pollutants. The meteorological
factors and air pollution data were collected and validated by the Korea Meteorological Administration. Based on
these verified data, this study investigated both the short-term and long-term effects of air pollution on ischemic
heart disease. However, a few limitations existed in the current study. Possible collinearity between air pollutants
Scientific Reports | (2021) 11:5108 | https://doi.org/10.1038/s41598-021-84587-x 8
Vol:.(1234567890)www.nature.com/scientificreports/
Means of 30 days Means of 365 days
Characteristics Odd ratios (95% CI) P-value Odd ratios (95% CI) P-value
Age < 60 years old (n = 1820)
O3 (0.01 ppm) 2.21 (1.46–3.34) < 0.001*
PM10 (10 μg/m3) 1.28 (1.03–1.60) 0.027*
Age ≥ 60 years old (n = 8955)
SO2 (0.01 ppm) 1.37 (1.04–1.79) 0.025* 1.67 (1.02–2.72) 0.042*
Relative humidity (%) 0.97 (0.96–0.99) 0.001*
O3 (0.01 ppm) 1.42 (1.16–1.75) 0.001*
PM10 (10 μg/m3) 1.12 (1.01–1.25) 0.032*
Men (n = 7235)
SO2 (0.01 ppm) 1.45 (1.07–1.96) 0.016*
O3 (0.01 ppm) 1.54 (1.24–1.92) < 0.001*
PM10 (10 μg/m3) 1.19 (1.06–1.32) 0.003*
Women (n = 3540)
Relative humidity (%) 0.95 (0.93–0.98) < 0.001*
NO2 (0.1 ppm) 0.09 (0.02–0.39) 0.002*
Low income (n = 5435)
SO2 (0.01 ppm) 1.43 (1.00–2.04) 0.050*
O3 (0.01 ppm) 1.69 (1.32–2.18) < 0.001*
PM10 (10 μg/m3) 1.25 (1.10–1.41) 0.001*
High income (n = 5340)
Relative humidity (%) 0.97 (0.95–0.99) 0.001*
SO2 (0.01 ppm) 2.09 (1.13–3.88) 0.019*
NO2 (0.1 ppm) 0.22 (0.07–0.69) 0.010*
Urban (n = 4155)
SO2 (0.01 ppm) 1.62 (1.05–2.49) 0.028*
Relative humidity (%) 0.98 (0.96–0.99) 0.009*
O3 (0.01 ppm) 2.08 (1.60–2.70) < 0.001*
PM10 (10 μg/m3) 1.39 (1.21–1.60) < 0.001*
Rural (n = 6620)
Relative humidity (%) 0.97 (0.95–0.99) 0.008*
SO2 (0.01 ppm) 1.71 (1.00–2.93) 0.050*
Table 4. Adjusted odd ratios (95% confidence interval) of the meteorological and pollution matter for
ischemic heart disease according to age and sex in the final model. *Conditional logistic regression model;
Significance at P < 0.05. a Stratified model for age, sex, income, and region of residence. b Final model was
adjusted for obesity, smoking status (current smoker compared to nonsmoker or past smoker), frequency of
alcohol consumption (≥ 1 time a week compared to < 1 time a week), CCI score, relative humidity, SO2, NO2,
O3, CO, and P M10 using the backward selection method.
might exist, although we adjusted for these variables in the final models (Supplementary Tables S14–S15). The
level of exposure to P
M2.5 was not available in this cohort. Because the exposure to air pollutants was based on
the registered region of residence, the migration of participants during follow-up periods could not be accounted
for in the present study. In addition, indoor exposure to air pollutants could not be individually assessed. For
the diagnosis of ischemic heart disease, we could not differentiate the types or severity of disease because this
study was based on health claims data. Last, because this study was based on Koreans, ethnic differences should
be considered when interpreting this study.
Conclusions
Short-term exposure to S O2 and long-term exposure to S O2, O3, and PM10 were associated with an increased risk
of ischemic heart disease. The older, male, low-income, and urban groups demonstrated an apparent association
between short-term exposure to S O2 and ischemic heart disease.
Data availability
Releasing of the data by the researcher is not allowed legally. All data are available from the database of the
National health Insurance Sharing Service (NHISS; https://nhiss.nhis.or.kr/). NHISS allows data access, at a
particular cost, for any researcher who promises to follow the research ethics. Data of this article can be down-
loaded from the website after promising to follow the research ethics.
Scientific Reports | (2021) 11:5108 | https://doi.org/10.1038/s41598-021-84587-x 9
Vol.:(0123456789)www.nature.com/scientificreports/
Received: 14 October 2020; Accepted: 18 February 2021
References
1. Dalen, J. E., Alpert, J. S., Goldberg, R. J. & Weinstein, R. S. The epidemic of the 20(th) century: Coronary heart disease. Am. J. Med.
127, 807–812. https://doi.org/10.1016/j.amjmed.2014.04.015 (2014).
2. DALYs, G. B. D. & Collaborators, H. Global, regional, and national disability-adjusted life-years (DALYs) for 359 diseases and
injuries and healthy life expectancy (HALE) for 195 countries and territories, 1990–2017: A systematic analysis for the Global
Burden of Disease Study 2017. Lancet 392, 1859–1922, https://doi.org/10.1016/S0140-6736(18)32335-3 (2018).
3. Benjamin, E. J. et al. Heart disease and stroke statistics-2018 update: A report from the American Heart Association. Circulation
137, e67–e492. https://doi.org/10.1161/CIR.0000000000000558 (2018).
4. McEvoy, J. W. et al. Coronary artery calcium progression: An important clinical measurement? A review of published reports. J.
Am. Coll. Cardiol. 56, 1613–1622. https://doi.org/10.1016/j.jacc.2010.06.038 (2010).
5. Gargiulo, P. et al. Ischemic heart disease in systemic inflammatory diseases. An appraisal. Int. J. Cardiol. 170, 286–290. https://doi.
org/10.1016/j.ijcard.2013.11.048 (2014).
6. Mandviwala, T., Khalid, U. & Deswal, A. Obesity and cardiovascular disease: A risk factor or a risk marker?. Curr. Atheroscler. Rep.
18, 21. https://doi.org/10.1007/s11883-016-0575-4 (2016).
7. Roerecke, M. et al. Heavy drinking occasions in relation to ischaemic heart disease mortality—An 11–22 year follow-up of the
1984 and 1995 US National Alcohol Surveys. Int. J. Epidemiol. 40, 1401–1410. https://doi.org/10.1093/ije/dyr129 (2011).
8. Ambrose, J. A. & Barua, R. S. The pathophysiology of cigarette smoking and cardiovascular disease: An update. J. Am. Coll. Cardiol.
43, 1731–1737. https://doi.org/10.1016/j.jacc.2003.12.047 (2004).
9. Dalton, T. P. et al. Dioxin exposure is an environmental risk factor for ischemic heart disease. Cardiovasc. Toxicol. 1, 285–298.
https://doi.org/10.1385/ct:1:4:285 (2001).
10. Pope, C. A. 3rd. et al. Ischemic heart disease events triggered by short-term exposure to fine particulate air pollution. Circulation
114, 2443–2448. https://doi.org/10.1161/CIRCULATIONAHA.106.636977 (2006).
11. Thurston, G. D. et al. Ischemic heart disease mortality and long-term exposure to source-related components of U.S. fine particle
air pollution. Environ. Health Perspect. 124, 785–794. https://doi.org/10.1289/ehp.1509777 (2016).
12. Combes, A. & Franchineau, G. Fine particle environmental pollution and cardiovascular diseases. Metabolism 100S, 153944. https
://doi.org/10.1016/j.metabol.2019.07.008 (2019).
13. Lu, Y. et al. Assessing the association between fine particulate matter (PM2.5) constituents and cardiovascular diseases in a mega-
city of Pakistan. Environ. Pollut. 252, 1412–1422. https://doi.org/10.1016/j.envpol.2019.06.078 (2019).
14. Zhang, W. et al. Triggering of cardiovascular hospital admissions by fine particle concentrations in New York state: Before, dur-
ing, and after implementation of multiple environmental policies and a recession. Environ. Pollut. 242, 1404–1416. https://doi.
org/10.1016/j.envpol.2018.08.030 (2018).
15. Shamsipour, M. et al. National and sub-national exposure to ambient fine particulate matter (PM2.5) and its attributable burden
of disease in Iran from 1990 to 2016. Environ. Pollut. 255, 113173. https://doi.org/10.1016/j.envpol.2019.113173 (2019).
16. Li, J. et al. Estimation of PM2.5 mortality burden in China with new exposure estimation and local concentration-response func-
tion. Environ. Pollut. 243, 1710–1718. https://doi.org/10.1016/j.envpol.2018.09.089 (2018).
17. Ljungman, P. L. S. et al. Long-term exposure to particulate air pollution, black carbon, and their source components in relation to
ischemic heart disease and stroke. Environ. Health Perspect. 127, 107012. https://doi.org/10.1289/EHP4757 (2019).
18. Huang, J. et al. The burden of ischemic heart disease related to ambient air pollution exposure in a coastal city in South China.
Environ. Res. 164, 255–261. https://doi.org/10.1016/j.envres.2018.02.033 (2018).
19. Sun, Z., Chen, C., Xu, D. & Li, T. Effects of ambient temperature on myocardial infarction: A systematic review and meta-analysis.
Environ. Pollut. 241, 1106–1114. https://doi.org/10.1016/j.envpol.2018.06.045 (2018).
20. Choi, H. G., Min, C. & Kim, S. Y. Air pollution increases the risk of SSNHL: A nested case-control study using meteorological data
and national sample cohort data. Sci. Rep. 9, 8270. https://doi.org/10.1038/s41598-019-44618-0 (2019).
21. Kim, S. Y., Min, C., Oh, D. J. & Choi, H. G. Tobacco smoking and alcohol consumption are related to benign parotid tumor:
A nested case-control study using a national health screening cohort. Clin. Exp. Otorhinolaryngol. 12, 412–419. https://doi.
org/10.21053/ceo.2018.01774 (2019).
22. Kim, S. Y., Kong, I. G., Min, C. & Choi, H. G. Association of air pollution with increased risk of peritonsillar abscess formation.
JAMA Otolaryngol. Head Neck Surg. 145, 530–535. https://doi.org/10.1001/jamaoto.2019.0742 (2019).
23. Team, K. A. M. Air Korea.
24. Choi, S. et al. Association of obesity or weight change with coronary heart disease among young adults in South Korea. JAMA
Intern. Med. 178, 1060–1068. https://doi.org/10.1001/jamainternmed.2018.2310 (2018).
25. Kim, S. Y., Min, C., Oh, D. J. & Choi, H. G. Bidirectional association between GERD and asthma: Two longitudinal follow-up
studies using a national sample cohort. J. Allergy Clin. Immunol. Pract. 8, 1005–1013. https://doi.org/10.1016/j.jaip.2019.10.043
(2020).
26. Kim, S. Y., Oh, D. J., Park, B. & Choi, H. G. Bell’s palsy and obesity, alcohol consumption and smoking: A nested case-control study
using a national health screening cohort. Sci. Rep. 10, 4248. https://doi.org/10.1038/s41598-020-61240-7 (2020).
27. Quan, H. et al. Updating and validating the Charlson comorbidity index and score for risk adjustment in hospital discharge
abstracts using data from 6 countries. Am. J. Epidemiol. 173, 676–682. https://doi.org/10.1093/aje/kwq433 (2011).
28. Quan, H. et al. Coding algorithms for defining comorbidities in ICD-9-CM and ICD-10 administrative data. Med. Care 43,
1130–1139. https://doi.org/10.1097/01.mlr.0000182534.19832.83 (2005).
29. Li, G., Zeng, Q. & Pan, X. Disease burden of ischaemic heart disease from short-term outdoor air pollution exposure in Tianjin,
2002–2006. Eur. J. Prev. Cardiol. 23, 1774–1782. https://doi.org/10.1177/2047487316651352 (2016).
30. Li, W. et al. Short-term exposure to air pollution and biomarkers of oxidative stress: The Framingham Heart Study. J. Am. Heart
Assoc. https://doi.org/10.1161/JAHA.115.002742 (2016).
31. Wang, M. et al. Association of estimated long-term exposure to air pollution and traffic proximity with a marker for coronary
atherosclerosis in a nationwide study in China. JAMA Netw. Open 2, e196553. https: //doi.org/10.1001/jamane twork open. 2019.6553
(2019).
32. Wang, M. et al. Long-term exposure to ambient ozone and progression of subclinical arterial disease: The multi-ethnic study of
atherosclerosis and air pollution. Environ. Health Perspect. 127, 57001. https://doi.org/10.1289/EHP3325 (2019).
33. Kaufman, J. D. et al. Association between air pollution and coronary artery calcification within six metropolitan areas in the USA
(the Multi-Ethnic Study of Atherosclerosis and Air Pollution): A longitudinal cohort study. Lancet 388, 696–704. https://doi.
org/10.1016/S0140-6736(16)00378-0 (2016).
34. Tian, Y. et al. Association between temperature variability and daily hospital admissions for cause-specific cardiovascular disease
in urban China: A national time-series study. PLoS Med. 16, e1002738. https://doi.org/10.1371/journal.pmed.1002738 (2019).
35. Schwartz, J., Samet, J. M. & Patz, J. A. Hospital admissions for heart disease: The effects of temperature and humidity. Epidemiology
15, 755–761. https://doi.org/10.1097/01.ede.0000134875.15919.0f (2004).
Scientific Reports | (2021) 11:5108 | https://doi.org/10.1038/s41598-021-84587-x 10
Vol:.(1234567890)www.nature.com/scientificreports/
36. Loizeau, M. et al. Does the air pollution model influence the evidence of socio-economic disparities in exposure and susceptibil-
ity?. Environ. Res. 167, 650–661. https://doi.org/10.1016/j.envres.2018.08.002 (2018).
37. Fairburn, J., Schule, S. A., Dreger, S., Karla Hilz, L. & Bolte, G. Social inequalities in exposure to ambient air pollution: A systematic
review in the WHO European Region. Int. J. Environ. Res. Public Health. https://doi.org/10.3390/ijerph16173127 (2019).
38. Lipfert, F. W. Air pollution and poverty: Does the sword cut both ways?. J. Epidemiol. Community Health 58, 2–3. https://doi.
org/10.1136/jech.58.1.2 (2004).
39. Soleas, G. J., Diamandis, E. P. & Goldberg, D. M. Resveratrol: A molecule whose time has come? And gone?. Clin. Biochem. 30,
91–113. https://doi.org/10.1016/s0009-9120(96)00155-5 (1997).
40. Renaud, S. & de Lorgeril, M. Wine, alcohol, platelets, and the French paradox for coronary heart disease. Lancet 339, 1523–1526.
https://doi.org/10.1016/0140-6736(92)91277-f (1992).
41. Bonnefont-Rousselot, D. Resveratrol and cardiovascular diseases. Nutrients. https://doi.org/10.3390/nu8050250 (2016).
Acknowledgements
The manuscript was edited for proper English language, grammar, punctuation, spelling, and overall style by the
highly qualified native English-speaking editors at American Journal Experts (EF94-7264-5CEE-C547-665P).
Author contributions
H.G.C. designed the study; J.H.W., C.M., and H.G.C. analyzed the data; S.Y.K., S.H.K., S.M.H., S.K., and H.G.C.
drafted and revised the paper; and all authors approved the final version of the manuscript.
Funding
This work was supported in part by a research Grant (NRF-2018-R1D1A1A02085328 and 2020R1A2C4002594)
from the National Research Foundation (NRF) of Korea.
Competing interests
The authors declare no competing interests.
Additional information
Supplementary Information The online version contains supplementary material available at https://doi.
org/10.1038/s41598-021-84587-x.
Correspondence and requests for materials should be addressed to H.G.C.
Reprints and permissions information is available at www.nature.com/reprints.
Publisher’s note Springer Nature remains neutral with regard to jurisdictional claims in published maps and
institutional affiliations.
Open Access This article is licensed under a Creative Commons Attribution 4.0 International
License, which permits use, sharing, adaptation, distribution and reproduction in any medium or
format, as long as you give appropriate credit to the original author(s) and the source, provide a link to the
Creative Commons licence, and indicate if changes were made. The images or other third party material in this
article are included in the article’s Creative Commons licence, unless indicated otherwise in a credit line to the
material. If material is not included in the article’s Creative Commons licence and your intended use is not
permitted by statutory regulation or exceeds the permitted use, you will need to obtain permission directly from
the copyright holder. To view a copy of this licence, visit http://creativecommons.org/licenses/by/4.0/.
© The Author(s) 2021
Scientific Reports | (2021) 11:5108 | https://doi.org/10.1038/s41598-021-84587-x 11
Vol.:(0123456789)You can also read