Short term glucocorticoid excess blunts abaloparatide induced increase in femoral bone mass and strength in mice
←
→
Page content transcription
If your browser does not render page correctly, please read the page content below
www.nature.com/scientificreports
OPEN Short‑term glucocorticoid excess
blunts abaloparatide‑induced
increase in femoral bone mass
and strength in mice
Mikkel Bo Brent1*, Jesper Skovhus Thomsen1,2 & Annemarie Brüel1,2
Glucocorticoids (GCs), such as prednisolone, are widely used to treat inflammatory diseases.
Continuously long-term or high dose treatment with GCs is one of the most common causes
of secondary osteoporosis and is associated with sarcopenia and increased risk of debilitating
osteoporotic fragility fractures. Abaloparatide (ABL) is a potent parathyroid hormone-related peptide
analog, which can increase bone mineral density (aBMD), improve trabecular microarchitecture,
and increase bone strength. The present study aimed to investigate whether GC excess blunts the
osteoanabolic effect of ABL. Sixty 12–13-week-old female RjOrl:SWISS mice were allocated to the
following groups: Baseline, Control, ABL, GC, and GC + ABL. ABL was administered as subcutaneous
injections (100 μg/kg), while GC was delivered by subcutaneous implantation of a 60-days slow-release
prednisolone-pellet (10 mg). The study lasted four weeks. GC induced a substantial reduction in muscle
mass, trabecular mineral apposition rate (MAR) and bone formation rate (BFR/BS), and endocortical
MAR compared with Control, but did not alter the trabecular microarchitecture or bone strength.
In mice not receiving GC, ABL increased aBMD, bone mineral content (BMC), cortical and trabecular
microarchitecture, mineralizing surface (MS/BS), MAR, BFR/BS, and bone strength compared with
Control. However, when administered concomitantly with GC, the osteoanabolic effect of ABL on
BMC, cortical morphology, and cortical bone strength was blunted. In conclusion, at cortical bone
sites, the osteoanabolic effect of ABL is generally blunted by short-term GC excess.
Glucocorticoids are widely used to treat inflammatory conditions and diseases1,2. Oral glucocorticoids, such
as prednisolone, are thus a cornerstone in all phases of immunosuppression and are extensively used to treat
rheumatic3, dermatological4, vascular5, renal6, and pulmonary d iseases7 as well as c ancer8. However, continuous
long-term treatment with glucocorticoids induces a series of adverse effects including severe influences on the
musculoskeletal system like rapidly decreased muscle mass and bone density, which subsequently increases the
risk of debilitating osteoporotic fragility fractures9,10.
Glucocorticoid-induced osteoporosis is one of the most common causes of secondary osteoporosis10. It is
estimated that 1–3% of adults in the United States use glucocorticoids at any given time with a mean treatment
duration of more than 4 years11. Although oral glucocorticoids are widely used in the United States, anti-osteo-
porotic pharmaceutical treatment is only reported by less than 40% of oral glucocorticoid users, which underlines
the existence of barriers for sufficient osteoporosis management in these p atients12,13.
Several pharmaceutical countermeasures for glucocorticoid-induced osteoporosis have been investigated in
large multicenter studies of a lendronate14,15, zoledronic acid16, teriparatide (PTH [1–34])17, or denosumab and
risedronate18. Patients with severe glucocorticoid-induced osteoporosis (T-score ≤ − 3.5 or T-score ≤ − 2.5 plus a
fragility fracture) are usually candidates for treatment with teriparatide, since daily injections of 20 µg teriparatide
results in a greater increase in bone mineral density (BMD) than treatment with alendronate17. However, treat-
ment with teriparatide has been associated with an increased risk of hypercalcemia, since it not only stimulates
bone formation, but also bone resorption19. In addition, studies of rodents have suggested the osteoanabolic
effect of teriparatide is blunted by concomitant treatment with glucocorticoids20,21, therefore, alternative bone
anabolic treatment options are needed.
The parathyroid hormone-related protein analog abaloparatide (ABL) is a bone anabolic agent with proper-
ties similar to teriparatide, but entails a lower risk of inducing hypercalcemia in p atients22. Consequently, ABL
1
Department of Biomedicine, Health, Aarhus University, Wilhelm Meyers Allé 3, 8000 Aarhus C, Denmark. 2These
authors jointly supervised this work: Jesper Skovhus Thomsen and Annemarie Brüel. *email: mbb@biomed.au.dk
Scientific Reports | (2021) 11:12258 | https://doi.org/10.1038/s41598-021-91729-8 1
Vol.:(0123456789)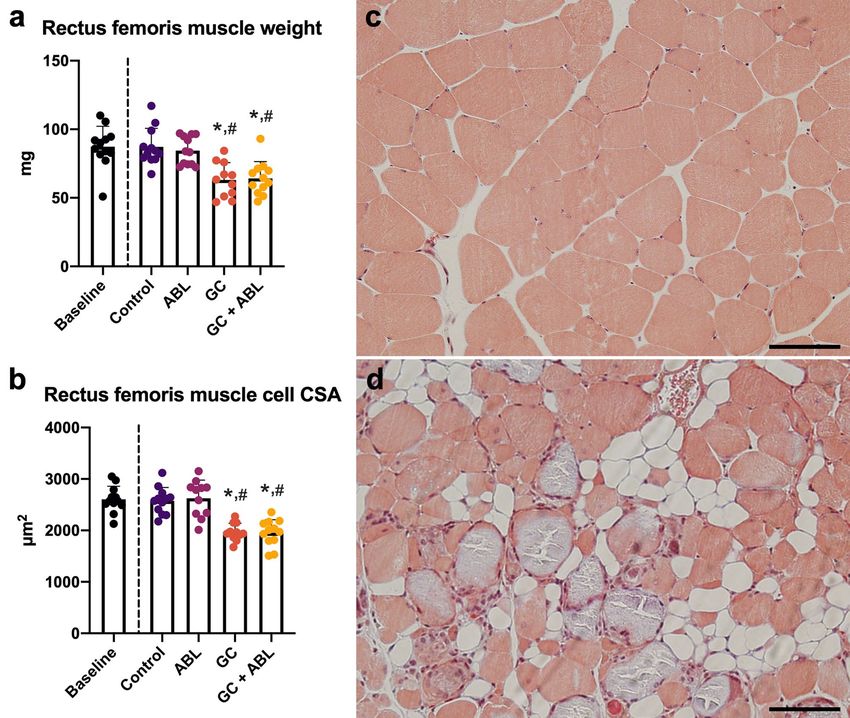
www.nature.com/scientificreports/
might be an alternative treatment option for selected patients at risk of hypercalcemia. ABL interact with the
parathyroid hormone 1 receptor (PTH1R) expressed on osteoblasts, osteocytes, bone lining cells, and other
mesenchymal-derived cells23,24. Intermittent interaction with PTH1R initiates an intracellular signaling cascade
that ultimately result in bone formation, particularly at trabecular bone sites, and to a lesser extend osteoclastic
bone resorption25–27. Since ABL and teriparatide are structurally similar and acts through the same receptor,
blunting of the osteoanabolic effect may also be a concern for ABL.
The study aimed to investigate whether GC excess blunts the osteoanabolic effect of ABL in mice.
Material and methods
Animals and treatments. Sixty female outbred RjOrl:SWISS mice were purchased from Janvier Labs (Le
Genest-Saint-Isle, France) and allowed two weeks of acclimatization before the study started. At study start,
the mice were 12–13 weeks old, had a mean bodyweight (BW) of 31.8 ± 2.3 g, were housed in standard plastic
mice cages with 5–6 animals per cage, and maintained at 21 °C with a 12:12 h light/dark cycle (6:00 am lights
on/ 6:00 pm lights off). During the study, all mice had unrestricted access to tap water and standard mice chow
(1324 maintenance diet for rats and mice; Altromin, Lage, Germany). Five days before the study start, the mice
were stratified using custom-made software into the following groups based on their BW: Baseline, Placebo-
pellet + saline (Control), Placebo-pellet + abaloparatide (ABL), glucocorticoid-pellet + saline (GC), and gluco-
corticoid-pellet + abaloparatide (GC + ABL). Animals assigned to the Baseline group were sacrificed at the study
start to enable determination of age-dependent musculoskeletal changes.
60-days slow-release glucocorticoid-pellets (prednisolone) and placebo-pellets were acquired from Innova-
tive Research of America (Sarasota, FL, USA) and inserted subcutaneously. The glucocorticoid-pellets were
designed to release 10 mg of prednisolone over a period of 60 days (equivalent to 5.4 mg/kg/d) by erosion and
diffusion, and established a local concentration gradient. Placebo-pellets contained vehicle and no active agent.
Under general anesthesia by 3% inhaled isoflurane, a 0.5-cm-long incision was made at the midline between
the shoulder blades using a surgical-grade lancet and the pellet was placed at the lateral side of the neck. The
incision was closed using resorbable multifil suture (Eickemeyer, Tuttlingen, Germany) and LiquiBand skin
adhesive (Plymouth, Devon, UK) if needed.
ABL (H-8334, Bachem, Bubendorf, Switzerland) was dissolved in 0.9% isotonic saline and administered
(100 μg/kg/day) as subcutaneous injections five days a week to animals in the ABL and GC + ABL groups for
four weeks. Likewise, mice allocated to the Control and GC groups were injected subcutaneously five days a
week with a similar amount of saline.
To assess bone resorption and formation, all mice were injected subcutaneously with tetracycline (20 mg/
kg, T3383, Sigma-Aldrich, St. Louis, MO, USA) four days before study start and with calcein (20 mg/kg, C0875,
Sigma-Aldrich, St. Louis, MO, USA) and alizarin (20 mg/kg, A3882, Sigma-Aldrich, St. Louis, MO, USA) four
and eight days before sacrifice, respectively. The tetracycline served as a baseline label enabling estimation of
bone erosion throughout the experiment as previously d escribed28,29, while the calcein and alizarin labels allowed
for the determination of conventional bone formative parameters at the end of the trial.
After four weeks of treatment, the mice were sacrificed by exsanguination under general anesthesia with
isoflurane. One mouse in the GC group was sacrificed before the study end due to infection at the incision site
and failure to thrive.
The study was carried out in compliance with the ARRIVE guidelines30 and all methods were performed
in accordance with relevant guidelines. All experimental protocols for the study were approved by the Danish
Animal Experiment Inspectorate (2018-15-0201-01436).
Tissue extraction and femoral length. Immediately after exsanguination, both femora, the right tibia,
and L4 were isolated, and soft tissue was carefully removed. The right femur, right tibia, and L4 were stored in
Ringer’s solution at − 20 °C, while the left femur was immersion-fixed in 0.1 M sodium phosphate-buffered for-
maldehyde (4% formaldehyde, pH 7.0) for 48 h and then stored in 70% ethanol.
The femoral bone length was determined using a digital sliding caliper and measured from the medial condyle
to the top of the femoral head.
Rectus femoris muscle. The right rectus femoris muscle was removed in a standardized manner, and the
wet weight was determined immediately using a digital scale (Mettler AT250, Columbus, OH, USA). Then, the
muscles were halved at the midpoint, placed with the cut surface on a flat-bed image scanner (Perfection 3200
Photo; Seiko Epson, Nagano, Japan), and scanned to determine the whole muscle cross-sectional area (CSA)31.
The halved rectus femoris muscle was then immersion-fixed in 0.1 M sodium phosphate-buffered formalde-
hyde (4% formaldehyde, pH 7.0) and embedded in plastic-based 2-hydroxyethyl methacrylate (Technovit 7100,
Heraeus Kulzer, Wehrheim, Germany). The embedded muscles were cut into 2-μm-thick sections on a microtome
(Jung RM2065; Leica Instruments, Nussloch, Germany) and stained with Masson’s trichrome to determine
muscle cell CSA. Muscle cell CSA was determined using a light microscope (Nikon Eclipse i80, Tokyo, Japan) at
escribed29.
a final magnification of × 1132 as previously d
Dual‑energy X‑ray absorptiometry (DXA). Areal bone mineral density (aBMD) and bone mineral con-
tent (BMC) were determined using a desktop DXA (pDEXA Sabre XL; Norland Stratec, Pforzheim, Germany) as
previously described32. In brief, the whole femur and tibia were scanned using a pixel size of 0.1 × 0.1 mm2 and
a scan speed of 3.0 mm/s.
Scientific Reports | (2021) 11:12258 | https://doi.org/10.1038/s41598-021-91729-8 2
Vol:.(1234567890)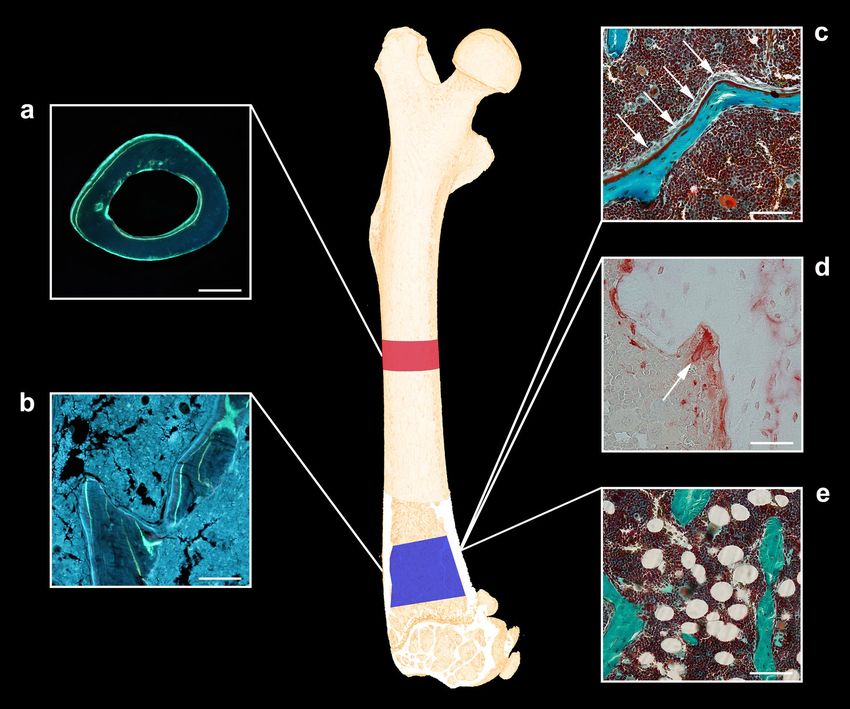
www.nature.com/scientificreports/
Figure 1. Skeletal sites investigated with μCT using a voxel size of 3.5 μm. (a) Blue represents the
1,000-μm-high volume of interest (VOI) at the distal femoral metaphysis. (b) Green represents the VOI at
the distal femoral epiphysis (approximately 490-μm-high). (c) Red represents the 820-μm-high VOI at the
femoral mid-diaphysis. (d) Purple represents the VOI at the L4 vertebral body (approximately 2000-μm-high).
Dimensions are not to scale.
Micro computed tomography (μCT). Cortical and trabecular microarchitectural bone parameters of
the distal femoral metaphysis and epiphysis and the vertebral body of L4 were determined using a desktop µCT
scanner (Scanco µCT 35; Scanco Medical, Brüttiselen, Switzerland) (Fig. 1). All scans were performed in high-
resolution mode (1000 projections/180°) with an isotropic voxel size of 3.5 μm, an X-ray tube voltage of 55 kV,
a current of 114 μA, and an integration time of 800 ms. Beam hardening artifacts were reduced using a 0.5 mm
aluminum filter.
The bone samples were analyzed using separate volumes of interest (VOIs) as previously described27 (Fig. 1). The
VOI at the femoral mid-diaphysis comprised an 820-μm-high region (234 slices) centered on the femoral mid-point,
thus containing cortical bone only. The VOI at the distal femoral metaphysis started 200 μm (57 slices) above the
point, where the mineralized cartilage from the growth plate fused and ended 1000 μm (229 slices) further above
and contained trabecular bone only. The femoral epiphysis was analyzed using a 490-μm-high (140 slices) VOI
that started just after the medial and lateral epicondyle have fused to a coherent structure and ended, where the
growth plate first appeared, thus containing trabecular bone only. Finally, L4 was analyzed using an approximately
2000-μm-high (571 slices) VOI spanning from the upper to the lower growth plate excluding primary spongiosa
containing trabecular bone only. The data were low-pass filtered using a Gaussian filter (σ = 0.8 and support = 1)
and segmented with a fixed threshold filter determined with IPL (v. 5.11, Scanco Medical AG, Switzerland). The
thresholds used for segmentation were 574 mg HA/cm3 for femoral bone and 529 mg HA/cm3 for L4.
The assessment of bone microstructure followed the current guiding principles by Bouxsein et al.33. The
following microstructural bone parameters were assessed with µCT: Ct.Th: cortical thickness, B.Ar: bone area,
M.Ar: marrow area, T: tissue area, Ct.Po: cortical porosity, BV/TV: bone volume/tissue volume, Tb.Th: trabecular
Scientific Reports | (2021) 11:12258 | https://doi.org/10.1038/s41598-021-91729-8 3
Vol.:(0123456789)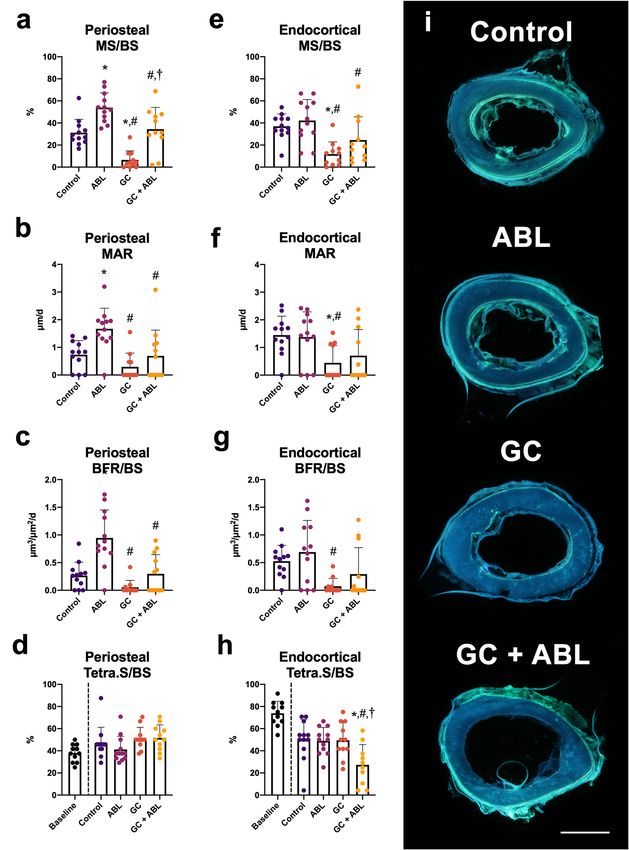
www.nature.com/scientificreports/
thickness, Tb.Sp: trabecular spacing, Tb.N: trabecular number, CD: connectivity density, SMI: structure model
index, vBMD: volumetric bone mineral density, and TMD: tissue mineral density.
Mechanical testing. Mechanical properties of the femoral mid-diaphysis, femoral neck, and vertebral body
of L4 were determined using a material testing machine (Instron model 5566, United Kingdom) as previously
described31,32. Maximum load to failure was the ultimate load achieved at any point during the compression
testing and was determined from the load–displacement data using in-house developed software. The femur was
placed on two rounded supporting bars separated by 7.14 mm with the anterior side facing away from the sup-
porting bars for the 3-point bending test. Load was applied with a third rounded bars at the femoral mid-point.
Then, the proximal part of the femur was placed in a custom-made fixation device exposing the femoral neck for
mechanical testing. L4 was compression tested after the vertebral disc and processi were removed. For all testing
procedures, vertical load was applied at a constant deflection rate of 2 mm/min.
Dynamic bone histomorphometry. Cortical bone. After mechanical testing, a 200-μm-thick mid-
diaphyseal cross-sectional bone slice was sawed from the distal part of the femoral bone and mounted with
Pertex on glass slides. Fluorochrome bone labels were analyzed using a brightfield microscope equipped for
fluorescence (Nikon Eclipse i80, Tokyo, Japan). Live images were projected to a computer equipped with the ste-
reological software Visiopharm (v. 2020.09, Visiopharm, Hørsholm, Denmark). A 24-arm circular grid radiating
outwards from the center of the bone marrow was superimposed on live images to quantify fluorochrome labels.
The distance between double labels was measured using a built-in measure tool in the Visiopharm Software.
Mineralizing surface/bone surface (MS/BS), mineral apposition rate (MAR), and bone formation rate (BFR/
BS) was determined as previously d escribed29. In the case of missing double labels an imputed value of zero was
34
used to calculate MAR . Tetracycline-covered surfaces (Tetra.S/BS) were used as an indicator of bone resorp-
tion throughout the e xperiment28,29. The assessment of fluorescent labels was performed at a final magnification
of × 1132.
Trabecular bone. The distal part of the femur was embedded undecalcified in methacrylate and 7-μm-thick
longitudinal sections were cut using a microtome (Jung RM2065; Leica Instruments, Nussloch, Germany). The
sections were either left unstained for dynamic bone histomorphometry, Masson–Goldner trichome-stained
for osteoblast, osteoid, and adipocyte quantification or stained for tartrate-resistant acid phosphatase (TRAP)
to identify osteoclasts (Fig. 2). Fluorochrome labels were quantified in a 1000-μm-high region of interest (ROI)
starting 300 μm below the most distal part of the growth plate. The fields of view were sampled systematically
covering 100% of the ROI with a randomly orientated line grid superimposed on the fields of view. The assess-
ment of fluorescent labels was performed at a final magnification of × 1132.
Bone cells and adipocytes. The Masson–Goldner trichome-stained sections from the distal part of the
femur were used to estimate the amount of osteoblast (Ob.S/BS), osteoid-covered surfaces (OB/BS), bone mar-
row adiposity, and adipocyte mean size. Osteoblasts were defined as cuboidal cells residing at the bone surface
and osteoid was defined as the red unmineralized region running along the edge of the bone.
Using a point grid, the bone marrow adiposity (adipocyt volume density) was estimated as the total number
of points hitting adipocytes within the bone marrow divided by total number of point hitting the bone marrow.
Adipocytes were defined as cells containing a single large lipid droplet surrounded by a layer of c ytoplasm35.
Sections stained for TRAP were used to determine the amount of osteoclast-covered surfaces (Oc.S/BS).
Osteoclasts were defined as TRAP-positive cells located at the bone surface.
A similar ROI, final magnification, and superimposed randomly orientated line grid used for trabecular
dynamic bone histomorphometry were used to analyze the sections stained with Masson–Goldner trichome
and the sections stained for TRAP.
Statistics. Statistical analysis was conducted in GraphPad Prism 9.2 (Systat Software, Chicago, IL, USA).
Differences between groups were analyzed using a parametric two-way analysis of variance (ANOVA) followed
by a post-hoc Holm-Sidak test. Normality was assessed using the D’Agostino-Pearson test. The mean of all
groups was compared to the mean of every other group, except Baseline. The two-way ANOVA is capable of
detecting interactions, wherein a significant interaction indicates a difference in the effect of treatment with ABL
between mice with a placebo-pellet (Control) or a glucocorticoid-pellet (GC) implanted. Data are presented as
means ± SD and statistical significance was considered achieved if the p-value was less than 0.05. An a priori
sample size calculation (power = 0.8) on mice showed that a 5% difference in femoral aBMD and a 15% differ-
ence in mid-diaphyseal bone strength can be demonstrated between groups with n = 12 animals27.
Results
Animals, muscle mass, and bone length. The final body weight was not affected by injections with
ABL or insertion of subcutaneous GC-pellets compared with Control (Table 1).
As expected, treatment with ABL did not affect rectus femoris muscle weight, rectus femoris muscle CSA, or
rectus femoris muscle cell CSA (Table 1, Fig. 3a,b). GC alone or in combination with ABL reduced rectus femoris
muscle mass (− 28% and − 26%), rectus femoris muscle CSA (− 16% and − 25%), and muscle cell CSA (− 24%
and − 24%) compared with Control, respectively. In addition, GC not only resulted in muscle cell atrophy, but
also in muscle cell destruction and infiltration of adipocytes into the muscle (Fig. 3c,d).
Neither ABL nor GC affected femoral bone length (Table 1).
Scientific Reports | (2021) 11:12258 | https://doi.org/10.1038/s41598-021-91729-8 4
Vol:.(1234567890)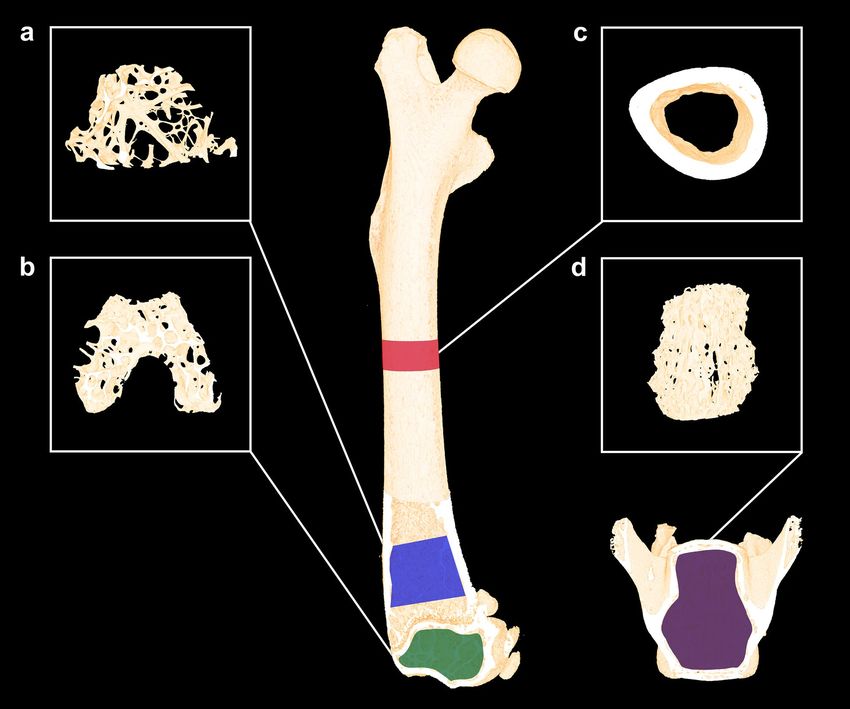
www.nature.com/scientificreports/
Figure 2. (a) Dynamic bone histomorphometry at the femoral mid-diaphysis. Bar = 0.5 mm. (b) Dynamic bone
histomorphometry at the distal femoral metaphysis. Bar = 50 μm. (c) Osteoblasts (white arrows) residing on red
osteoid at the distal femoral metaphysis. Masson–Goldner trichrome. Bar = 50 μm. (d) TRAP-stained osteoclast
in a Howship’s lacuna at the distal femoral metaphysis. Bar = 100 μm. (e) Unilocular adipocytes in the bone
marrow at the distal femoral metaphysis. Masson–Goldner trichrome. Bar = 50 μm.
Baseline Control ABL GC GC + ABL Interaction
Animals 12 12 12 11 12 No
Initial BW (g) 31.5 ± 2.27 31.3 ± 2.30 31.9 ± 2.20 32.5 ± 2.97 31.7 ± 2.07 No
Final BW (g) 31.5 ± 2.3 30.9 ± 2.21 32.9 ± 2.18 30.7 ± 2.83 29.5 ± 2.91# No
Rectus femoris muscle CSA (cm2) 1.46 ± 0.18 1.40 ± 0.14 1.39 ± 0.14 1.18 ± 0.26*,# 1.05 ± 0.23*,# No
Femoral bone length (mm) 15.7 ± 0.44 15.8 ± 0.49 16.1 ± 0.51 16.0 ± 0.26 15.8 ± 0.57 No
Femoral aBMD (mg/cm2) 79.3 ± 7.75 79.4 ± 5.91 88.9 ± 9.46* 73.1 ± 6.53# 77.6 ± 6.30# No
Femoral BMC (mg) 29.9 ± 3.12 30.4 ± 2.74 36.9 ± 4.00* 28.8 ± 3.38# 31.0 ± 2.03# Yes p = 0.023
Tibial aBMD (mg/cm2) 65.9 ± 5.10 69.9 ± 5.59 79.1 ± 8.18* 66.7 ± 6.83# 70.2 ± 4.10# No
Tibial BMC (mg) 22.5 ± 2.90 23.9 ± 3.33 29.0 ± 3.55* 23.1 ± 2.43# 24.9 ± 1.63# No
Table 1. Number of animals, initial and final bodyweight (BW), rectus femoris cross-sectional area (CSA),
femoral bone length, aBMD (areal bone mineral density), and BMC (bone mineral content) of mice subjected
to subcutaneous slow-release glucocorticoid (GC) pellets and treated with abaloparatide (ABL) for four weeks.
Mean ± SD. *p < 0.05 vs. Control. #p < 0.05 vs. ABL.
Scientific Reports | (2021) 11:12258 | https://doi.org/10.1038/s41598-021-91729-8 5
Vol.:(0123456789)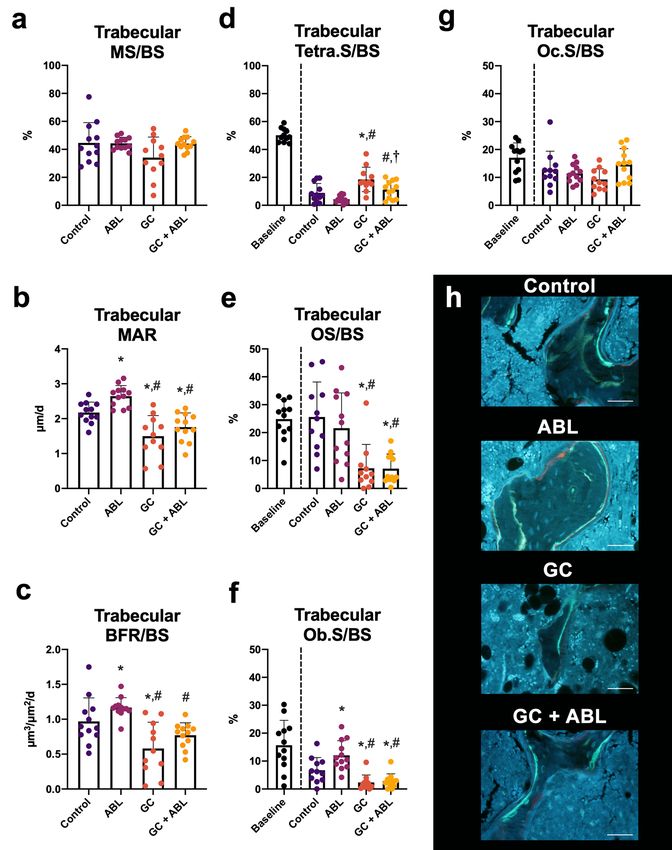
www.nature.com/scientificreports/

                                            Figure 3.  (a) Rectus femoris muscle mass and (b) rectus femoris cross-sectional area (CSA) of mice subjected
                                            to subcutaneous slow-release glucocorticoid (GC) pellets and treated with abaloparatide (ABL) for four weeks.
                                            (c) Representative cross-section of the rectus femoris muscle cells from a mouse in the Control group. (d)
                                            Representative cross-section of the rectus femoris muscle from a mouse in the GC group. Bar = 100 µm and
                                            stained with Masson trichrome. Mean ± SD. *p < 0.05 vs. Control. #p < 0.05 vs. ABL.

                                            Dual‑energy X‑ray absorptiometry. Treatment with ABL increased both femoral and tibial aBMD
                                            (+ 12% and + 13%) and BMC (+ 21% and + 21%) compared with Control, respectively (Table 1). GC did not
                                            reduce aBMD or BMC compared with Control. However, aBMD and BMC were lower at both femur and tibia
                                            in animals treated with both ABL and GC compared to animals treated with ABL only, demonstrating that GC
                                            excess blunted the osteoanabolic effect of ABL on femoral and tibial aBMD and BMC. In addition, an interaction
                                            between treatment with ABL and GC was found for femoral BMC.

                                            Micro‑computed tomography. Cortical bone. At the femoral mid-diaphysis, ABL increased B.Ar
                                            (+ 21%) and T.Ar (+ 10%) compared with Control. GC alone decreased B.Ar with 5% compared with Control, as
                                            the only observable negative effect (Table 2). An interaction between treatment with ABL and GC was found for
                                            B.Ar. Treatment with GC + ABL resulted in lower B.Ar compared with ABL indicating that the effect of ABL on
                                            mid-diaphyseal B.Ar was blunted by GC. Neither GC nor ABL had any effects on mid-diaphyseal M.Ar, Ct.Po,
                                            or TMD.

                                            Trabecular bone. At the distal femoral metaphysis, treatment with ABL increased BV/TV (+ 140%), CD
                                            (+ 287%), and vBMD (+ 126%), whereas SMI (− 63%) and TMD (− 3%) decreased compared with Control. GC
                                            did not influence any microstructural parameters compared with Control. Animals in the GC group treated
                                            with ABL showed an increased BV/TV (+ 136%) and vBMD (+ 126%) and decreased SMI (− 80%) compared
                                            with Control. In the GC + ABL group, TMD was increased (+ 3%) compared with ABL and SMI was decreased

          Scientific Reports |   (2021) 11:12258 |              https://doi.org/10.1038/s41598-021-91729-8                                                  6

Vol:.(1234567890)
www.nature.com/scientificreports/
Baseline Control ABL GC GC + ABL Interaction
Ct.Th (μm) 207 ± 12.7 213 ± 11.3 215 ± 29.8 207 ± 15.2 198 ± 21.8 No
B.Ar (mm2) 1.01 ± 0.07 1.02 ± 0.06 1.23 ± 0.14* 0.97 ± 0.08*# 1.04 ± 0.13#,† Yes p = 0.031
2
M.Ar (mm ) 0.98 ± 0.10 1.09 ± 0.13 1.01 ± 0.20 1.02 ± 0.16 1.08 ± 0.12 No
T.Ar (mm2) 2.00 ± 0.14 2.03 ± 0.17 2.24 ± 0.23* 1.99 ± 0.21# 2.12 ± 0.15 No
Ct.Po (%) 3.14 ± 0.23 3.00 ± 0.25 3.56 ± 1.35 3.10 ± 0.24 3.53 ± 0.62 No
TMD (mg/cm3) 1178 ± 15.2 1213 ± 15.5 1200 ± 15.7 1214 ± 15.9 1213 ± 21.3 No
Table 2. Morphology of the right femoral mid-diaphysis of mice subjected to subcutaneous slow-release
glucocorticoid (GC) pellets and treated with abaloparatide (ABL) for four weeks. Ct.Th cortical thickness,
B.Ar bone area, M.Ar marrow area, T.Ar tissue area, Ct.Po cortical porosity, and TMD tissue mineral density.
Mean ± SD. *p < 0.05 vs. Control. #p < 0.05 vs. ABL. †p < 0.05 vs. GC.
Baseline Control ABL GC GC + ABL Interaction
Femoral metaphysis
BV/TV (%) 13.8 ± 3.68 6.47 ± 4.32 15.5 ± 11.5* 9.84 ± 2.77 15.3 ± 5.51* No
Tb.Th (μm) 44.2 ± 2.84 44.5 ± 7.48 42.6 ± 6.47 41.9 ± 3.91 41.2 ± 4.07 No
Tb.Sp (μm) 262 ± 50.6 396 ± 93.5 298 ± 102 384 ± 82.8 294 ± 87.4 No
Tb.N (mm−1) 4.23 ± 0.80 2.76 ± 0.80 4.38 ± 2.44 3.16 ± 0.64 4.01 ± 1.17 No
CD (mm−3) 447 ± 200 161 ± 79.0 623 ± 551* 237 ± 78.1 532 ± 385 No
SMI 1.02 ± 0.49 1.86 ± 0.68 0.68 ± 0.95* 1.17 ± 0.41 0.36 ± 0.63*,† No
vBMD (mg/cm3) 169 ± 43.5 81.9 ± 52.8 185 ± 129* 122 ± 35.6 185 ± 63.1* No
TMD (mg/cm3) 962 ± 16.1 985 ± 16.5 951 ± 28.5* 996 ± 19.1# 983 ± 10.7# No
Femoral epiphysis
BV/TV (%) 29.9 ± 4.05 23.3 ± 6.78 30.1 ± 7.84* 26.3 ± 4.09 32.6 ± 4.24* No
Tb.Th (μm) 61.0 ± 3.75 60.0 ± 6.73 58.7 ± 8.79 58.5 ± 4.66 59.2 ± 4.81 No
Tb.Sp (μm) 207 ± 18.1 236 ± 39.4 190 ± 21.9* 223 ± 28.6# 189 ± 20.9*,† No
−1 #
Tb.N (mm ) 5.89 ± 0.66 5.17 ± 1.04 6.59 ± 1.03* 5.40 ± 0.76 6.66 ± 0.85*,† No
CD (mm−3) 314 ± 77.3 229 ± 62.6 400 ± 78.8* 243 ± 57.3# 356 ± 142*,† No
SMI − 0.21 ± 0.23 0.15 ± 0.52 − 0.39 ± 0.84 − 0.11 ± 0.30 − 0.66 ± 0.46* No
vBMD (mg/cm3) 366 ± 47.7 293 ± 81.7 367 ± 90.8* 330 ± 49.5 399 ± 46.0* No
TMD (mg/cm3) 1038 ± 15.2 1049 ± 18.1 1028 ± 23.8 1059 ± 14.5# 1050 ± 11.7# No
Table 3. Microstructural properties of femoral metaphyseal and epiphyseal bone of mice subjected to
subcutaneous slow-release glucocorticoid (GC) pellets and treated with abaloparatide (ABL) for four weeks.
BV/TV bone volume/tissue volume, Tb.Th trabecular thickness, Tb.Sp trabecular spacing, Tb.N trabecular
number, CD connectivity density, SMI structure model index, vBMD volumetric bone mineral density, TMD
tissue mineral density. Mean ± SD. *p < 0.05 vs. Control. #p < 0.05 vs. ABL. †p < 0.05 vs. GC.
(− 69%) compared with GC. No other differences in trabecular microstructure were observed between these
groups (Table 3).
At the distal femoral epiphysis, treatment with ABL increased BV/TV (+ 29%), Tb.N (+ 27%), CD (+ 75%), and
vBMD (+ 25%) and decreased Tb.Sp (− 19%) compared with Control. GC alone had no observable negative effects
on the trabecular microstructure compared to Control. Animals receiving GC and ABL had an increased BV/
TV (+ 40%), Tb.N (+ 29%), CD (+ 55%), and vBMD (+ 36%) compared with Control. In addition, ABL decreased
Tb.Sp (− 20%) and SMI in GC-animals compared with Control. In the GC + ABL group, TMD increased (+ 2%)
compared with ABL, whereas Tb.Sp decreased (− 15%) and Tb.N and CD increased (+ 23% and + 47%) compared
with GC. No other differences in trabecular microstructure were observed between these groups (Table 3).
At L4, treatment with ABL increased BV/TV (+ 45%), Tb.Th (+ 10%), CD (+ 101%), and vBMD (+ 41%) and
decreased SMI. As the only observable effect compared with Control, GC increased TMD (+ 4%). In animals
receiving GC, treatment with ABL increased BV/TV (+ 65%), Tb.N (+ 35%), CD (+ 63%), vBMD (+ 63%), and
TMD (+ 5%) and decreased Tb.Sp (− 21%) and SMI compared with Control. In the GC + ABL group, SMI and
TMD increased (+ 450% and + 5%) compared with ABL, whereas BV/TV (+ 51%), Tb.Th (+ 11%), Tb.N (+ 27%),
CD (+ 64%), and vBMD (+ 46%) increased and SMI decreased compared with GC (Table 4). An interaction
between treatment with ABL and GC was found for SMI.
These findings, from three different trabecular bone sites, suggest that GC excess blunted the osteoanabolic
effect of ABL for only a few of the trabecular microstructural parameters.
Mechanical testing. Treatment with ABL increased femoral mid-diaphyseal bone strength (+ 21%) com-
pared to Control, while GC did not affect mid-diaphyseal bone strength compared to Control. In animals receiv-
Scientific Reports | (2021) 11:12258 | https://doi.org/10.1038/s41598-021-91729-8 7
Vol.:(0123456789)www.nature.com/scientificreports/
Baseline Control ABL GC GC + ABL Interaction
BV/TV (%) 23.5 ± 5.47 18.5 ± 5.41 26.8 ± 7.36* 20.2 ± 2.88# 30.5 ± 4.40*,† No
Tb.Th (μm) 46.5 ± 3.86 44.0 ± 3.80 48.4 ± 5.47* 43.2 ± 2.59# 47.9 ± 4.03† No
Tb.Sp (μm) 231 ± 33.9 274 ± 53.3 244 ± 51.8 251 ± 34.4 217 ± 3.71* No
Tb.N (mm−1) 4.87 ± 0.82 4.09 ± 0.88 4.94 ± 1.12 4.35 ± 0.55 5.54 ± 0.96*,† No
CD (mm−3) 380 ± 78.2 264 ± 85.5 531 ± 162* 263 ± 53.6# 431 ± 145*,† No
SMI 0.09 ± 050 0.40 ± 0.46 − 0.18 ± 0.59* 0.22 ± 0.26 − 0.99 ± 0.52*,#,† Yes p = 0.030
3 #
vBMD (mg/cm ) 266 ± 60.1 212 ± 61.7 298 ± 80.2* 236 ± 34.1 345 ± 47.2*,† No
TMD (mg/cm3) 946 ± 16.7 940 ± 24.9 937 ± 28.6 974 ± 15.9*,# 983 ± 20.0*,# No
Table 4. Microstructural properties of L4 of mice subjected to subcutaneous slow-release glucocorticoid
(GC) pellets and treated with abaloparatide (ABL) for four weeks. BV/TV bone volume/tissue volume, Tb.
Th trabecular thickness, Tb.Sp trabecular spacing, Tb.N trabecular number, CD connectivity density, SMI
structure model index, vBMD volumetric bone mineral density, and TMD tissue mineral density. Mean ± SD.
*p < 0.05 vs. Control. #p < 0.05 vs. ABL. †p < 0.05 vs. GC.
Baseline Control ABL GC GC + ABL Interaction
Femoral mid-diaphysis (N) 18.8 ± 1.93 21.6 ± 2.32 26.2 ± 3.44* 18.9 ± 2.95# 19.5 ± 3.64# Yes p = 0.038
Femoral neck (N) 19.3 ± 2.86 18.3 ± 3.74 18.3 ± 3.37 15.9 ± 3.69 16.9 ± 3.84 No
Vertebral body (N) 26.9 ± 7.93 23.7 ± 7.11 36.0 ± 8.73* 20.5 ± 5.30# 39.4 ± 9.73*,† No
Table 5. Bone strength of the femoral mid-diaphysis, femoral neck, and vertebral body of L4 of mice subjected
to subcutaneous slow-release glucocorticoid (GC) pellets and treated with abaloparatide (ABL) for four weeks.
Mean ± SD. *p < 0.05 vs. Control. #p < 0.05 vs. ABL. †p < 0.05 vs. GC.
ing GC alone or in combination with ABL, the mid-diaphyseal bone strength was lower (− 28% and − 26%) than
in those treated with ABL alone, respectively (Table 5). An interaction between treatment with ABL and GC was
found for mid-diaphyseal bone strength.
At the femoral neck, the bone strength did not differ between any of the groups (Table 5).
Mechanical compression testing revealed that ABL increased vertebral bone strength in both ABL (+ 52%)
and GC + ABL (+ 66%) animals compared to Control. In the GC + ABL group, no difference was observed in
vertebral compression strength compared with ABL. Moreover, ABL increased bone strength in GC animals
(+ 92%) compared with GC animals that was not treated with ABL (Table 5).
These findings indicate that the anabolic effect of ABL on bone strength was blunted by GC at the femoral
mid-diaphysis, but not at the vertebral body.
Dynamic bone histomorphometry and histological assessment of bone cells. Trabecular bone
at the distal femoral metaphysis. Treatment with ABL increased MAR (+ 22%) and Ob.S/BS (+ 79%) compared
with Control (Fig. 4). GC decreased MAR (− 31%), BFR/BS (− 40%), OS/BS (− 74%), and Ob.S/BS (− 66%) and
increased Tetra.S/BS (+ 109%) compared with Control (Fig. 4). Animals in the GC group treated with ABL had
lower MAR (− 19%), OS/BS (− 72%), and Ob.S/BS (− 57%) compared with Control (Fig. 4). Neither ABL nor
GC affected Oc.S/BS. Furthermore, MAR (− 34%), BFR/BS (− 34%), OS/BS (− 76%), and Ob.S/BS (− 67%) were
lower and Tetra.S/BS (+ 155%) was higher in mice treated with GC + ABL compared with mice treated with ABL
only (Fig. 4). An interaction between treatment with ABL and GC was found for Ob.S/BS and Oc.S/BS. This
suggests that GC blunted the effect of ABL on the resorptive parameters and hence blunted the bone turnover
in trabecular bone.
The lower bone turnover in the CG and GC + ABL mice compared to the ABL mice resulted in a more min-
eralized bone in these animals, which is consistent with the higher TMD in these mice (Table 3).
Cortical bone at the femoral mid‑diaphysis. At the periosteal bone surface, ABL increased MS/BS (+ 73%),
MAR (+ 128%), and BFR/BS (+ 255%) compared with Control. GC decreased periosteal MS/BS (− 79%), but did
not affect either MAR or BFR/BS (Fig. 5). Animals in the GC group treated with ABL did not increase any of the
formative bone parameters compared with Control. In addition, an interaction between treatment with ABL and
GC was found for BFR/BS and animals in the GC + ABL group had lower MS/BS (− 36%), MAR (− 59%), and
BFR/BS (− 69%) compared with animals in the ABL group suggesting that GC blunted the effect of ABL on the
bone formative parameters at the periosteal femoral mid-diaphyseal bone surface.
Neither GC nor ABL had any influence on the resorptive indicator Tetra.S/BS at the periosteal surface at the
femoral mid-diaphysis (Fig. 4).
At the endocortical bone surface, treatment with ABL did not influence any of the formative bone parameters
assessed with dynamic bone histomorphometry in either Control or GC animals. Animals in the GC group had
Scientific Reports | (2021) 11:12258 | https://doi.org/10.1038/s41598-021-91729-8 8
Vol:.(1234567890)www.nature.com/scientificreports/
Figure 4. Distal femoral metaphyseal trabecular bone parameters determined by dynamic bone
histomorphometry and histological assessment of osteoid, osteoblasts, and osteoclasts. (a) MS/BS: mineralizing
surface, (b) MAR: mineral apposition rate, (c) BFR/BS: bone formation rate, (d) Tetra.S/BS: tetracycline-covered
surfaces, (e) OS/BS: osteoid-covered surfaces, (f) Ob.S/BS: osteoblast-covered surfaces, (g) Oc.S/BS: osteoclast-
covered surfaces, and (h) Representative histological sections from the four treatment groups. Bar = 50 μm.
Mean ± SD. An interaction was found between treatment with ABL and GC for Ob.S/BS (p = 0.045) and Oc.S/BS
(p = 0.027). *p < 0.05 vs. Control. #p < 0.05 vs. ABL. †p < 0.05 vs. GC.
lower MS/BS (− 68%) and MAR (− 69%) compared with Control indicating that GC inhibited bone formation
at the endocortical bone surface. An interaction between treatment with ABL and GC was found for Tetra.S/BS.
The lower Tetra.S/BS indicated that endocortical bone resorption was elevated in GC + ABL-treated mice
compared with Control, ABL, and GC mice (Fig. 5).
Scientific Reports | (2021) 11:12258 | https://doi.org/10.1038/s41598-021-91729-8 9
Vol.:(0123456789)www.nature.com/scientificreports/
Figure 5. Mid-diaphyseal femoral cortical bone parameters determined by dynamic bone histomorphometry.
(a–d) Periosteal envelope. (e–h) Endosteal envelope. (i) Representative histological sections from the four
treatment groups. Bar = 0.5 mm. MS/BS mineralizing surface, MAR mineral apposition rate, BFR/BS bone
formation rate, and Tetra.S/BS Tetracycline-covered surfaces. Mean ± SD. An interaction was found between
treatment with ABL and GC for periosteal BFR/BS (p = 0.033) and endocortical Tetra.S/BS (p = 0.012). *p < 0.05
vs. Control. #p < 0.05 vs. ABL. †p < 0.05 vs. GC.
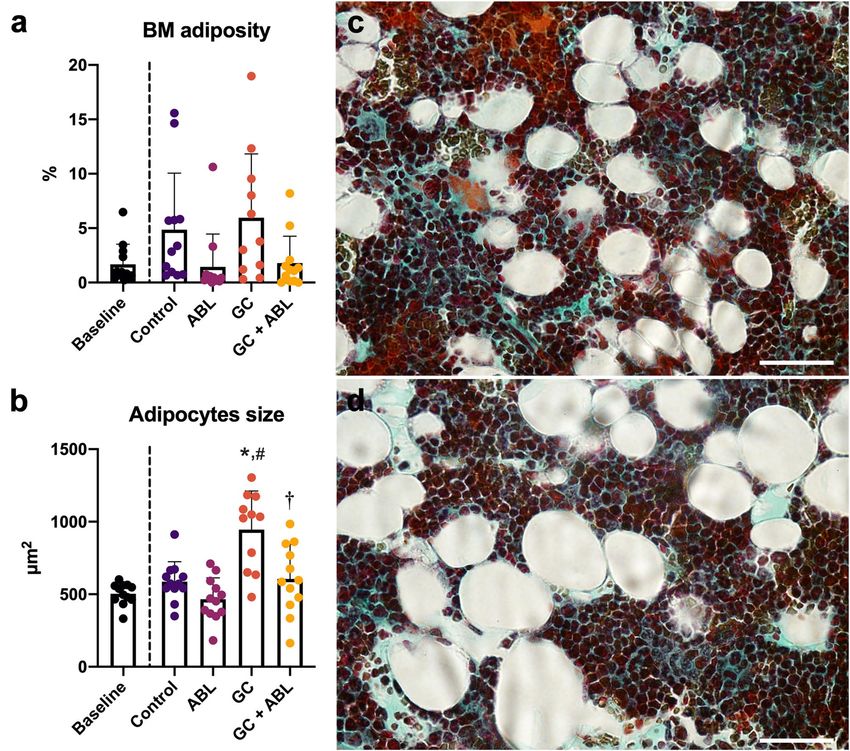
Adipocytes. A non-significant trend towards lower bone marrow adiposity in ABL treated animals com-
pared with Control was observed. GC did not affect bone marrow adiposity, but increased adipocyte size (+ 48%)
compared with Control (Fig. 6). ABL prevented the GC-induced increase in adipocyte size.
Scientific Reports | (2021) 11:12258 | https://doi.org/10.1038/s41598-021-91729-8 10
Vol:.(1234567890)www.nature.com/scientificreports/
Figure 6. (a) Bone marrow (BM) adiposity, (b) average size of adipocytes, and (c,d) representative Masson–
Goldner trichrome-stained histological sections from the distal femoral metaphysis showing adipocyte size
from an animal in the Control group and GC group, respectively. Bar = 100 µm. Mean ± SD. *p < 0.05 vs. Control.
#
p < 0.05 vs. ABL. †p < 0.05 vs. GC.
Discussion
The purpose of the study was to investigate whether the osteoanabolic effect of ABL was affected by short-term
GC excess in mice. The main finding of the study was that GC mainly blunted the osteoanabolic effect of ABL
in cortical bone.
In mice not receiving GC, the potent osteoanabolic effect of ABL materialized as a substantial increase in bone
mineral density, cortical and trabecular microarchitecture, and bone strength. These findings are in accordance
with the results of previous studies performed in mice36,37. In addition, ABL increased the amount of osteoblast-
covered surfaces and trended to reduce bone marrow adiposity. This suggests a possible differentiation of bone
marrow mesenchymal stem cells towards osteoblasts instead of bone marrow adipocytes38, and is consistent with
ice39,40. Similar decrease in bone marrow adiposity has been reported
the observed lipolytic effect of PTHrP in m
for two other osteoanabolic agents teriparatide and romosozumab in r ats41.
As expected, treatment with ABL did not influence muscles mass, while muscle wasting is a well-established
effect of treatment with GC42. In accordance with that, we observed a massive reduction in muscle wet weight,
muscle cross-sectional area, and muscle cell cross-sectional area in animals subjected to GC excess.
In addition to muscle wasting, GC has been shown to induce a substantial bone loss43. Surprisingly, we found
that short-term GC excess had little or no detrimental effect on bone mineral density, trabecular microarchi-
tecture, and bone strength.
Scientific Reports | (2021) 11:12258 | https://doi.org/10.1038/s41598-021-91729-8 11
Vol.:(0123456789)www.nature.com/scientificreports/
Subcutaneously implanted pellets have been used in various mouse strains such as Swiss W ebster44–51,
CD-152,53, C57BL/654–58, Black S wiss59, and FVB/N60 to explore the skeletal effects of GC, but conflicting results
have emerged. Several studies have reported a substantial loss of trabecular bone volume fraction or aBMD in
long bones after only 21–28 days using GC doses of 2–15 mg/kg/day44,48–50,52,54,60, while others have reported little
or no detrimental effect from implanted GC-pellets45,59,61. One might speculate whether the large heterogeneity
in the outcomes of the different studies reflects differences in strain, GC dose, and study duration. Ersek et al.
reported a GC-induced reduction in trabecular bone volume fraction, cortical thickness, and bone strength in
CD-1 and C57/BL6 mice and concluded that CD1-mice (that are derived from the same mice as the RjOrl:SWISS
mice used in the present study) are particularly susceptible to GC-induced bone loss compared to C57BL/6 mice.
They used similarly aged mice, prednisolone pellets with a four times lower dose (2.5 mg/60 days), and a longer
study duration (56 days) compared to the present s tudy53. However, their findings contrast those of the present
study, where GC excess had little or no detrimental effect on trabecular bone. One possible explanation for the
discrepancy between the two studies is that GC-induced bone loss in RjOrl:SWISS mice requires a longer time to
develop than the 28 days used in the present study or that this mouse strain is less susceptible to GC-induce bone
loss. We found that GC in general had limited effect on trabecular bone, but nevertheless resulted in decreased
bone resorption and formation indicators. This indicate that the microstructural changes are developing, but have
not yet materialized. Furthermore, the lower trabecular bone turnover caused higher trabecular tissue mineral
density in GC treated mice, signifying a more mineralized trabecular bone tissue.
In contrast to trabecular bone, GC had a noticeable effect on cortical bone. This is consistent with previous
studies in mice using either GC-releasing p ellets53,61 or subcutaneous injections with d examethasone62,63, where
the GC-induced bone loss was most pronounced at skeletal sites comprising cortical bone.
The present study clearly demonstrated that the osteoanabolic effect of ABL was blunted by concomitant
short-term exposure to GC excess. The GC-induced blunting of ABL was more pronounced at cortical bone sites
and less marked at trabecular bone sites, reflecting that GC mainly had detrimental effect on cortical bone. This
might be explained by GC predominantly target cortical bone surfaces61, thus mainly challenging the osteoana-
bolic effect of ABL at the cortical bone envelopes, but not at trabecular bone surfaces.
The effect of ABL has previously been studied in botulinum toxin-immobilized rats64, ovariectomized rats65,
rabbits66, and m onkeys26, and intact m
ice27,36,67, but the present study is the first conducted in animals subjected
to GC excess. Although no previous study has investigated the effect of ABL and GC in combination, conflicting
results have emerged from studies of rodents exposed to GC and treated with teriparatide20,62,68. Teriparatide
BL69, acts through the same receptor on osteoblasts – albeit mainly in different
is structurally very similar to A
receptor configurations70, and has, in general, the same osteoanabolic effect in intact mice27,36. One study found
that GC-induced bone loss is not prevented by simultaneous treatment with teriparatide in m ice62, while another
found teriparatide effective in increasing bone mass and strength in mice subjected to GC excess by implanta-
tion of slow-release prednisolone p ellets68. A study in rats found that GC severely blunted the anabolic effect of
simultaneous treatment with teriparatide20.
No clinical study has investigated the osteoanabolic effect of ABL in patients with glucocorticoid-induced
osteoporosis. However, one large clinical multi-center study compared the osteoanabolic effect of daily injec-
tions with teriparatide (20 μg) or ABL (80 μg) in women with post-menopausal o steoporosis22. They found that
treatment with ABL improved femoral neck, lumbar spine, and total hip aBMD compared with treatment with
placebo or teriparatide. Interestingly, the study also showed treatment with ABL entailed a lower risk of hyper-
calcemia than treatment with teriparatide.
At skeletal sites mainly composed of trabecular bone such as L4 and the distal femoral metaphysis and epiphy-
sis, treatment with ABL resulted in higher BV/TV and vBMD values in both non-GC and GC exposed animals
compared with Control. This suggests that GC does not blunt the osteoanabolic effect of ABL on trabecular bone
density at these skeletal sites. Moreover, the increased trabecular bone density was accompanied by higher bone
strength, although it was statistically significant for L4 only.
Despite GCs blunting effect on cortical bone, ABL is nevertheless a suitable candidate for counteracting GC-
induced bone loss, especially when it is taken into consideration that the anabolic effect of teriparatide is similarly
blunted by GC. Moreover, as treatment with ABL has shown a decreased risk of hypercalcemia, ABL provides an
alternative to teriparatide and an attractive treatment option for glucocorticoid-induced osteoporosis to selected
patients at risk of hypercalcemia. In addition, blunting of the osteoanabolic effect of ABL may be alleviated by
increasing the dose, an option not available for teriparatide, since ABL is approved by the U.S. Food and Drug
Administration to be administered at four times higher doses than t eriparatide71.
The present study has some limitations. The assessment of bone marrow adipocytes was performed on Mas-
son–Goldner trichrome-stained sections using cell morphology to identify adipocytes instead of using immu-
nohistochemical staining for lipid‐associated proteins like perilipin or adipophilin. However, we have previously
conducted an unpublished pilot study comparing bone marrow adiposity assessed by cell morphology on Mas-
son–Goldner trichrome stained sections and immunohistochemical staining for perilipin and found the two
methods to provide similar results. In addition, the International Bone Marrow Adiposity Society states that
Masson–Goldner trichrome staining can be used to identify mature adipocytes, while immunohistochemical
staining for perilipin may be used to more easily discriminate between blood vessels and a dipocytes72.
ABL was injected five days a week due to staff conveniences, whereas in a clinical setting ABL is administrated
seven days a week. It cannot be precluded that this difference may influence the anabolic effect of the ABL treat-
ment regimen. In addition, the study was designed as a prevention study where treatment with ABL commenced
when the GC pellets were implanted instead of as an intervention study where a bone loss had been allowed to
develop before starting the ABL treatment.
Another limitation of the study is that GC excess was not unequivocally established by the serum prednisolone
or corticosterone levels, but only bona fide established by subcutaneous implantation of prednisolone releasing
Scientific Reports | (2021) 11:12258 | https://doi.org/10.1038/s41598-021-91729-8 12
Vol:.(1234567890)www.nature.com/scientificreports/
pellets and the observable pronounced negative effect on skeletal muscle tissue. A study by Herrmann et al. used
mice with the same genetic background and dosage of GC pellets as in the present study, and did not find any
increase in serum corticosterone after two and three weeks of pellet implantation, suggesting serum measure-
ments might not establish the presence of GC excess52.
The present study investigated short-term treatment with GC and lasted four weeks and, surprisingly, only a
relatively limited detrimental effect of GC was observed for both cortical and trabecular bone. If the study had
lasted longer or the dosage of GC had been higher, a more pronounced bone loss and reduction in bone strength
might have occurred.
We used mice to model glucocorticoid-induced bone loss since previous studies have shown subcutaneously
inserted prednisolone pellets can induce osteopenia in m ice46,57. Mice do not show Haversian-like remodeling,
but this can be achieved using rabbits, which undergo intracortical remodeling73. Moreover, glucocorticoid-
excess in rabbits might be combined with estrogen deficiency because of the narrow therapeutic w indow74,75.
In conclusion, the osteoanabolic effect of ABL is generally blunted by short-term glucocorticoid excess in
particular at cortical bone sites.
Received: 1 April 2021; Accepted: 31 May 2021
References
1. Arafah, B. M. Pharmacology of glucocorticoids. In Contemporary Endocrinology 67–81 (Humana Press Inc., 2018). https://doi.
org/10.1007/978-3-319-62470-9_3.
2. Williams, D. M. Clinical pharmacology of corticosteroids. Respir. Care 63, 655–670 (2018).
3. Hoes, J. N. et al. EULAR evidence-based recommendations on the management of systemic glucocorticoid therapy in rheumatic
diseases. Ann. Rheum. Dis. 66, 1560–1567 (2007).
4. Greaves, M. W. & Gatti, S. The use of glucocorticoids in dermatology. J. Dermatol. Treat. 10, 83–91 (1999).
5. Neumann, I. Immunosuppressive and glucocorticoid therapy for the treatment of ANCA-asssociated vasculitis. Rheumatology
(Oxford) 59, 60–67 (2020).
6. Lv, J. et al. Corticosteroid therapy in IgA nephropathy. J. Am. Soc. Nephrol. 23, 1108–1116 (2012).
7. Janahi, I. A., Rehman, A. & Baloch, N. A. Corticosteroids and their use in respiratory disorders. In Corticosteroids (InTech, 2018).
https://doi.org/10.5772/intechopen.72147.
8. Pufall, M. A. Glucocorticoids and cancer. Adv. Exp. Med. Biol. 872, 315–333 (2015).
9. Payer, J., Brazdilova, K. & Jackuliak, P. Management of glucocorticoid-induced osteoporosis: Prevalence, and emerging treatment
options. Drug Healthc. Patient Saf. 2, 49–59 (2010).
10. Buckley, L. & Humphrey, M. B. Glucocorticoid-induced osteoporosis. N. Engl. J. Med. 379, 2547–2556 (2018).
11. Overman, R. A., Yeh, J. Y. & Deal, C. L. Prevalence of oral glucocorticoid usage in the United States: A general population perspec-
tive. Arthritis Care Res. 65, 294–298 (2013).
12. Curtis, J. R. et al. Longitudinal patterns in the prevention of osteoporosis in glucocorticoid-treated patients. Arthritis Rheum. 52,
2485–2494 (2005).
13. Feldstein, A. C., Elmer, P. J., Nichols, G. A. & Herson, M. Practice patterns in patients at risk for glucocorticoid-induced osteopo-
rosis. Osteoporos. Int. 16, 2168–2174 (2005).
14. Saag, K. G. et al. Alendronate for the prevention and treatment of glucocorticoid-induced osteoporosis. N. Engl. J. Med. 339,
292–299 (1998).
15. Stoch, S. A. et al. Once-weekly oral alendronate 70 mg in patients with glucocorticoid-induced bone loss: A 12-month randomized,
placebo-controlled clinical trial. J. Rheumatol. 36, 1705–1714 (2009).
16. Reid, D. M. et al. Zoledronic acid and risedronate in the prevention and treatment of glucocorticoid-induced osteoporosis (HORI-
ZON): A multicentre, double-blind, double-dummy, randomised controlled trial. Lancet 373, 1253–1263 (2009).
17. Saag, K. G. et al. Teriparatide or alendronate in glucocorticoid-induced osteoporosis. N. Engl. J. Med. 357, 2028–2039 (2007).
18. Saag, K. G. et al. Denosumab versus risedronate in glucocorticoid-induced osteoporosis: Final results of a twenty-four–month
randomized, double-blind double-dummy trial. Arthritis Rheumatol. 71, 1174–1184 (2019).
19. Neer, R. M. et al. Effect of parathyroid hormone (1–34) on fractures and bone mineral density in postmenopausal women with
osteoporosis. N. Engl. J. Med. 344, 1434–1441 (2001).
20. Oxlund, H. et al. The anabolic effect of PTH on bone is attenuated by simultaneous glucocorticoid treatment. Bone 39, 244–252
(2006).
21. Doyon, A. R., Ferries, I. K. & Li, J. Glucocorticoid attenuates the anabolic effects of parathyroid hormone on fracture repair. Calcif.
Tissue Int. 87, 68–76 (2010).
22. Miller, P. D. et al. Effect of abaloparatide vs placebo on new vertebral fractures in postmenopausal women with osteoporosis a
randomized clinical trial. JAMA - J. Am. Med. Assoc. 316, 722–733 (2016).
23. Ehrenmann, J. et al. High-resolution crystal structure of parathyroid hormone 1 receptor in complex with a peptide agonist. Nat.
Struct. Mol. Biol. 25, 1086–1092 (2018).
24. Cheloha, R. W., Gellman, S. H., Vilardaga, J. P. & Gardella, T. J. PTH receptor-1 signalling—Mechanistic insights and therapeutic
prospects. Nat. Rev. Endocrinol. 11, 712–724 (2015).
25. Vilardaga, J. P., Romero, G., Friedman, P. A. & Gardella, T. J. Molecular basis of parathyroid hormone receptor signaling and traf-
ficking: A family B GPCR paradigm. Cell. Mol. Life Sci. 68, 1–13 (2011).
26. Doyle, N. et al. Abaloparatide, a novel PTH receptor agonist, increased bone mass and strength in ovariectomized cynomolgus
monkeys by increasing bone formation without increasing bone resorption. Osteoporos. Int. 29, 685–697 (2018).
27. Brent, M. B., Stoltenborg, F. E., Brüel, A. & Thomsen, J. S. Teriparatide and abaloparatide have a similar effect on bone in mice.
Front. Endocrinol. 12, 328 (2021).
28. Lodberg, A. et al. A soluble activin type IIA receptor mitigates the loss of femoral neck bone strength and cancellous bone mass
in a mouse model of disuse osteopenia. Bone 110, 326–334 (2018).
29. Brent, M. B., Brüel, A. & Thomsen, J. S. PTH (1–34) and growth hormone in prevention of disuse osteopenia and sarcopenia in
rats. Bone 110, 244–253 (2018).
30. du Percie Sert, N. et al. The ARRIVE guidelines 2.0: Updated guidelines for reporting animal research. PLoS Biol. 18, e3000410
(2020).
31. Brent, M. B., Lodberg, A., Thomsen, J. S. & Brüel, A. Rodent model of disuse-induced bone loss by hind limb injection with
botulinum toxin A. MethodsX 7, 101079 (2020).
32. Brent, M. B., Thomsen, J. S. & Brüel, A. The effect of oral dabigatran etexilate on bone density, strength, and microstructure in
healthy mice. Bone Rep. 8, 9–17 (2018).
Scientific Reports | (2021) 11:12258 | https://doi.org/10.1038/s41598-021-91729-8 13
Vol.:(0123456789)www.nature.com/scientificreports/
33. Bouxsein, M. L. et al. Guidelines for assessment of bone microstructure in rodents using micro-computed tomography. J. Bone
Miner. Res. 25, 1468–1486 (2010).
34. Dempster, D. W. et al. Standardized nomenclature, symbols, and units for bone histomorphometry: A 2012 update of the report
of the ASBMR Histomorphometry Nomenclature Committee. J. Bone Miner. Res. 28, 2–17 (2013).
35. Bravenboer, N. et al. Standardised nomenclature, abbreviations, and units for the study of bone marrow adiposity: Report of the
Nomenclature Working Group of the International Bone Marrow Adiposity Society. Front. Endocrinol. 10, 923 (2020).
36. Le Henaff, C. et al. Abaloparatide at the same dose has the same effects on bone as PTH (1–34) in mice. J. Bone Miner. Res. 35,
714–724 (2020).
37. Makino, A. et al. Frequent administration of abaloparatide shows greater gains in bone anabolic window and bone mineral density
in mice: A comparison with teriparatide. Bone 142, 115651 (2020).
38. Chan, G. K., Deckelbaum, R. A., Bolivar, I., Goltzman, D. & Karaplis, A. C. PTHrP inhibits adipocyte differentiation by down-
regulating PPARγ activity via a MAPK-dependent pathway. Endocrinology 142, 4900–4909 (2001).
39. Larsson, S., Jones, H. A., Göransson, O., Degerman, E. & Holm, C. Parathyroid hormone induces adipocyte lipolysis via PKA-
mediated phosphorylation of hormone-sensitive lipase. Cell. Signal. 28, 204–213 (2016).
40. Fajol, A. & Komaba, H. Additional evidence for the role of parathyroid hormone in adipose tissue browning. EBioMedicine 40,
3–4 (2019).
41. Costa, S., Fairfield, H. & Reagan, M. R. Inverse correlation between trabecular bone volume and bone marrow adipose tissue in
rats treated with osteoanabolic agents. Bone 123, 211–223 (2019).
42. Braun, T. P. & Marks, D. L. The regulation of muscle mass by endogenous glucocorticoids. Front. Physiol. 6, 12 (2015).
43. Klein, G. L. The effect of glucocorticoids on bone and muscle. Osteoporos. Sarcopenia 1, 39–45 (2015).
44. Yao, W. et al. Sclerostin-antibody treatment of glucocorticoid-induced osteoporosis maintained bone mass and strength. Osteoporos.
Int. 27, 283–294 (2016).
45. Dai, W. et al. Prevention of glucocorticoid induced bone changes with beta-ecdysone. Bone 74, 48–57 (2015).
46. Li, X., Zhou, Z. Y., Zhang, Y. Y. & Yang, H. L. IL-6 contributes to the defective osteogenesis of bone marrow stromal cells from the
vertebral body of the glucocorticoid-induced osteoporotic mouse. PLoS ONE 11, e0154677 (2016).
47. Plotkin, L. I., Bivi, N. & Bellido, T. A bisphosphonate that does not affect osteoclasts prevents osteoblast and osteocyte apoptosis
and the loss of bone strength induced by glucocorticoids in mice. Bone 49, 122–127 (2011).
48. Bouvard, B., Gallois, Y., Legrand, E., Audran, M. & Chappard, D. Glucocorticoids reduce alveolar and trabecular bone in mice. Jt.
Bone Spine 80, 77–81 (2013).
49. Weinstein, R. S., Jilka, R. L., Michael Parfitt, A. & Manolagas, S. C. Inhibition of osteoblastogenesis and promotion of apoptosis
of osteoblasts end osteocytes by glucocorticoids potential mechanisms of their deleterious effects on bone. J. Clin. Invest. 102,
274–282 (1998).
50. Lane, N. E. et al. Glucocorticoid-treated mice have localized changes in trabecular bone material properties and osteocyte lacunar
size that are not observed in placebo-treated or estrogen-deficient mice. J. Bone Miner. Res. 21, 466–476 (2006).
51. Jia, J. et al. Glucocorticoid dose determines osteocyte cell fate. FASEB J. 25, 3366–3376 (2011).
52. Herrmann, M. et al. The challenge of continuous exogenous glucocorticoid administration in mice. Steroids 74, 245–249 (2009).
53. Ersek, A. et al. Strain dependent differences in glucocorticoid-induced bone loss between C57BL/6J and CD-1 mice. Sci. Rep. 6,
1–10 (2016).
54. Tamura, Y. et al. Role of plasminogen activator inhibitor-1 in glucocorticoid-induced diabetes and osteopenia in mice. Diabetes
64, 2194–2206 (2015).
55. Sato, A. Y. et al. Protection from glucocorticoid-induced osteoporosis by anti-catabolic signaling in the absence of sost/sclerostin.
J. Bone Miner. Res. 31, 1791–1802 (2016).
56. Fumoto, T. et al. Mineralocorticoid receptor function in bone metabolism and its role in glucocorticoid-induced osteopenia.
Biochem. Biophys. Res. Commun. 447, 407–412 (2014).
57. Weinstein, R. S. et al. Osteoprotegerin prevents glucocorticoid-induced osteocyte apoptosis in mice. Endocrinology 152, 3323–3331
(2011).
58. Piemontese, M., Xiong, J., Fujiwara, Y., Thostenson, J. D. & O’Brien, C. A. Cortical bone loss caused by glucocorticoid excess
requires RANKL production by osteocytes and is associated with reduced OPG expression in mice. Am. J. Physiol. Endocrinol.
Metab. 311, E587–E593 (2016).
59. Hofbauer, L. C. et al. Prevention of glucocorticoid-induced bone loss in mice by inhibition of RANKL. Arthritis Rheum. 60,
1427–1437 (2009).
60. Thiele, S. et al. Selective glucocorticoid receptor modulation maintains bone mineral density in mice. J. Bone Miner. Res. 27,
2242–2250 (2012).
61. Henneicke, H. et al. Corticosterone selectively targets endo-cortical surfaces by an osteoblast-dependent mechanism. Bone 49,
733–742 (2011).
62. Postnov, A., De Schutter, T., Sijbers, J., Karperien, M. & De Clerck, N. Glucocorticoid-induced osteoporosis in growing mice is
not prevented by simultaneous intermittent PTH treatment. Calcif. Tissue Int. 85, 530–537 (2009).
63. Grahnemo, L. et al. Possible role of lymphocytes in glucocorticoid-induced increase in trabecular bone mineral density. J. Endo‑
crinol. 224, 97–108 (2015).
64. Brent, M. B., Thomsen, J. S. & Brüel, A. The Efficacy of PTH and Abaloparatide to Counteract Immobilization-Induced Osteopenia
Is in General Similar. Front. Endocrinol. 11, 808 (2020).
65. Makino, A. et al. Abaloparatide exerts bone anabolic effects with less stimulation of bone resorption-related factors: A comparison
with teriparatide. Calcif. Tissue Int. 103, 289–297 (2018).
66. Chandler, H., Brooks, D. J., Hattersley, G., Bouxsein, M. L. & Lanske, B. Abaloparatide increases bone mineral density and bone
strength in ovariectomized rabbits with glucocorticoid-induced osteopenia. Osteoporos. Int. 30, 1607–1616 (2019).
67. Arlt, H. et al. Effects of abaloparatide and teriparatide on bone resorption and bone formation in female mice. Bone Rep. 13, 100291
(2020).
68. Yao, W. et al. Glucocorticoid-induced bone loss in mice can be reversed by the actions of parathyroid hormone and risedronate
on different pathways for bone formation and mineralization. Arthritis Rheum. 58, 3485–3497 (2008).
69. Tella, S. H., Kommalapati, A. & Correa, R. Profile of abaloparatide and its potential in the treatment of postmenopausal osteopo-
rosis. Cureus 9, 2 (2017).
70. Hattersley, G., Dean, T., Corbin, B. A., Bahar, H. & Gardella, T. J. Binding selectivity of abaloparatide for PTH-type-1-receptor
conformations and effects on downstream signaling. Endocrinology 157, 141–149 (2016).
71. Shirley, M. Abaloparatide: First global approval. Drugs 77, 1363–1368 (2017).
72. Tratwal, J. et al. Reporting guidelines, review of methodological standards, and challenges toward harmonization in bone mar-
row adiposity research. Report of the methodologies working group of the international bone marrow adiposity society. Front.
Endocrinol. 11, 65 (2020).
73. Baofeng, L. et al. Characterization of a rabbit osteoporosis model induced by ovariectomy and glucocorticoid. Acta Orthop. 81,
396–401 (2010).
74. Castañeda, S. et al. Characterization of a new experimental model of osteoporosis in rabbits. J. Bone Miner. Metab. 26, 53–59
(2008).
Scientific Reports | (2021) 11:12258 | https://doi.org/10.1038/s41598-021-91729-8 14
Vol:.(1234567890)You can also read