SIM2REALVIZ: Visualizing the Sim2Real Gap in Robot Ego-Pose Estimation
←
→
Page content transcription
If your browser does not render page correctly, please read the page content below
S IM 2R EALV IZ: Visualizing the Sim2Real Gap
                in Robot Ego-Pose Estimation

                         Théo Jaunet                            Guillaume Bono
                       Liris, INSA-Lyon                         Liris, INSA-Lyon

                       Romain Vuillemot                              Christian Wolf
                 Liris, École Centrale de Lyon                      Liris, INSA-Lyon

                   1
                                             2

                                                                                        4

                                                                             3

Figure 1: Using S IM 2R EALV IZ, the sim2real gap of a Data Augmentation model can be compared
against other models (e. g., Vanilla or Fine-tuned) and displayed on the real-world environment map
along with its performance metrics. In particular, S IM 2R EALV IZ shows ① this model is particularly
effective in simulation but we identified errors in the environment, such as the model failing to regress
its position because of a closed-door that was opened in training. Such an error can then be selected
by instance on the map ② to identify key features extracted by the model either as superimposed on
the heat-map ③ or as a first-person view ④.
                                              Abstract
         The Robotics community has started to heavily rely on increasingly realistic 3D
         simulators for large-scale training of robots on massive amounts of data. But once
         robots are deployed in the real-world, the simulation gap, as well as changes in
         the real-world (e.g. lights, objects displacements) lead to errors. In this paper, we
         introduce S IM 2R EALV IZ, a visual analytics tool to assist experts in understanding
         and reducing this gap for robot ego-pose estimation tasks, i. e. the estimation
         of a robot’s position using trained models. S IM 2R EALV IZ displays details of a
         given model and the performance of its instances in both simulation and real-world.
         Experts can identify environment differences that impact model predictions at a
         given location and explore through direct interactions with the model hypothesis
         to fix it. We detail the design of the tool, and case studies related to the exploit of
         the regression to the mean bias and how it can be addressed, and how models are
         perturbed by vanishing landmarks such as bikes.

1st Workshop on eXplainable AI approaches for debugging and diagnosis (XAI4Debugging@NeurIPS2021).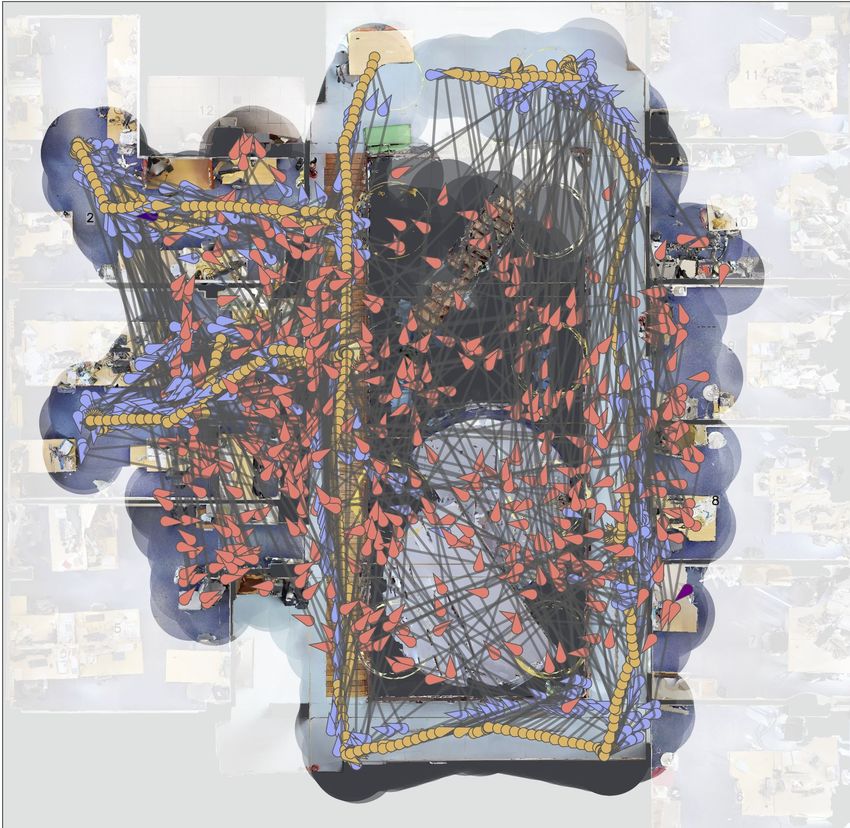
1   Introduction
Visual navigation is at the core of most autonomous robotic applications such as self-driving cars or
service robotics. One of the main challenges for the robot is to efficiently explore the environment,
to robustly identify navigational space, and eventually be able to find the shortest paths in complex
environments with obstacles. The Robotics and Deep Learning communities have introduced models
trained with Reinforcement Learning (RL), Inverse RL, or Imitation Learning, targeting complex
scenarios requiring visual reasoning beyond waypoint navigation and novel ways to interact with
robots, e. g., combining vision, robotics, and natural language processing through queries like “Where
are my keys?”. Current learning algorithms are not sampled efficiently enough, this kind of capability
requires an extremely large amount of data. In the case of RL, this is in the hundreds of millions or in
the billions of interactions — this simply cannot be addressed in a reasonable amount of time using a
physical robot in a real environment, which also may damage itself in the process.
To tackle this issue, the field heavily relies on simulation, where training can proceed significantly
faster than in physical (wall clock) time on fast modern hardware, easily distributing multiple
simulated environments over a large number of cores and machines. However, neural networks
trained in simulated environments often perform poorly when deployed on real-world robots and
environments, mainly due to the“Sim2Real gap”, — i. e. the lack of accuracy and fidelity in
simulating real-world environment conditions such as, among others, image acquisition conditions,
sensors noise, but also furniture changes and other moved objects. The exact nature of the gap is
often difficult to pinpoint. It is well known that adversarial examples, where only a few pixel shifts
occur, considered as small artifacts by humans, or which might even be undetectable by humans, can
directly alter the decisions of trained models [12, 27, 20].
The sim2real gap is currently addressed by various methods, including domain randomization, where
the physical reality is considered to be a single parametrization of a large variety of simulations [37,
25], and Domain Adaptation, i. e. explicitly adapting a model trained in simulation to the real-
world [40, 6]. However, identifying the sources of the sim2real gap would help experts in designing
and optimizing transfer methods by directly targeting simulators and design choices of the agents
themselves. To this end, we propose S IM 2R EALV IZ, a visual analytics interface aiming to understand
the gap between a simulator and a real-world environment. We claim that this tool is helpful to
gather insights on the studied agents’ behavior by comparing decisions made in simulation and in the
real-world physical environment. S IM 2R EALV IZ exposes different trajectories, and their divergences,
in which a user can dive deeply for further analysis. In addition to behavior analysis, it provides
features designed to explore and study the models’ inner representations, and thus grasp differences
between the simulated environment and the real-world as perceived by agents. Experts can rely
on multiple-coordinated views, which can be used to compare model performances estimated with
different metrics such as a distance, orientation, or a UMAP [24] projection of latent representations.
In addition, experts dispose of three different approaches to highlight the estimated sim2real gap
overlaid over either 3D projective inputs or over a bird’s eye view (“Geo-map”) of the environment.
S IM 2R EALV IZ targets domain experts, referred to as model builders and trainers [35, 14]. The goal
is assistance during real-world deployment, pinpointing root causes of decisions. Once a model is
trained in simulation, those experts are often required to adapt it to real-world conditions through
transfer learning and similar procedures. S IM 2R EALV IZ provides information on the robot’s behavior
and has been designed to help end-users, building trust [9, 19]. In Section 5, we report on insights
gained through experiments using S IM 2R EALV IZ, on how a selection of pre-trained neural models
exploits specific sensor data, hints on their internal reasoning, and sensibility to sim2real gaps.

2   Context and problem definition
We study trained models for Ego-Localization of mobile robots in navigation scenarios, which regress
the coordinates (x, y) and camera angle α from observed RGB and depth images. Physical robots
take these inputs from a depth-cam, whereas in the simulation they are rendered using computer
graphics software from a 3D scan of the environment. Fig. 2 provides a concrete example, where
two images are taken at the same spatial coordinates ①, one from simulation and the other from a
physical robot. As our goal is to estimate the sim2real gap, we do not focus on generalization to
unseen environments. Instead, our simulated environment corresponds to a 3D scanned version of
the same physical environment in which the robot navigates, which allows precise estimation of the

                                                   2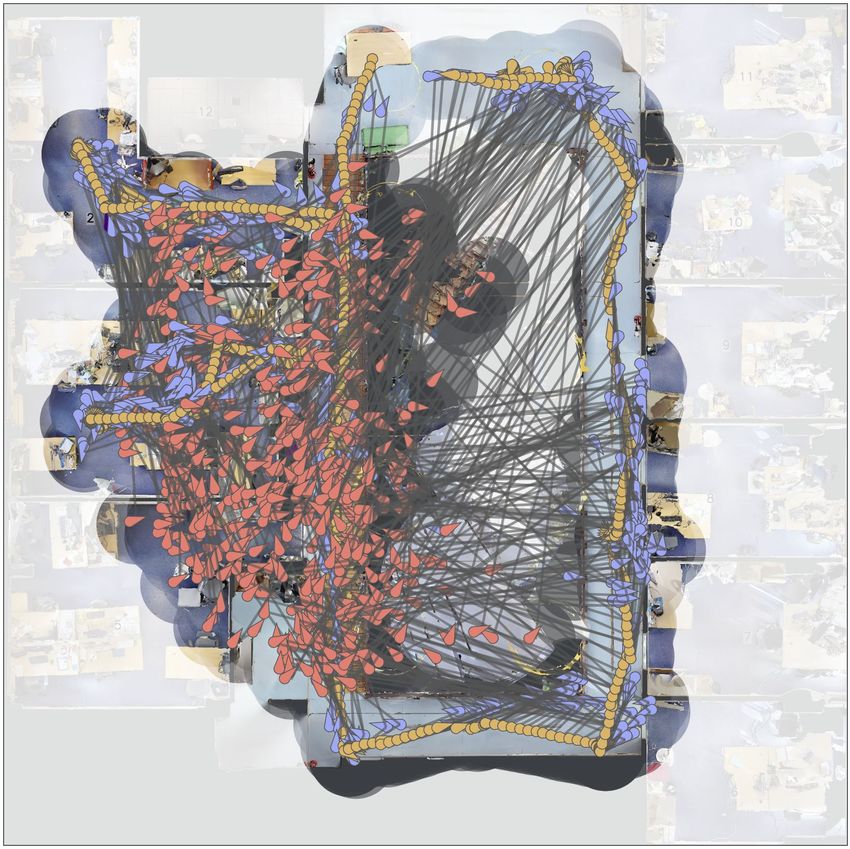
α xy

                                                                    α xy
Figure 2: In the studied robot ego-localization task, an RGB-D image ①, is given to a trained model ②,
which uses it to regress the location (x, y), and orientation angle (α) in the environment from which
this image was taken from ③. As illustrated above, images taken from the same coordinates in
simulation and real-world ① may lead to different predictions due to differences, such as here, among
others, the additional presence of a bike in the scene. We are interested in reducing the gap between
the SIM and REAL predictions.
                                    αxy

difference in localization performance, as gap leads to differences in predicted positions. The full
extent of the gap, and how it may affect models is hard to understand by humans, which makes it
                   αxy

difficult to take design choices and optimize decisions for sim2real transfer.
Simulation — we use the Habitat [32] simulator and load a high fidelity 3D scan of a modern office
building created with the Matterport3D software [7] from individual 360-degree camera images
taken at multiple viewpoints. The environment is of size 22 × 22 meters and can potentially contain
differences to the physical place due to estimation errors of geometry, texture, lighting, alignment
of the individual views, as well as changes done after the acquisition, such as moved furniture,
or opened/closed doors. The Habitat simulator handles environment rendering and agent physics,
starting with its shape and size (e. g., a cylindrical with diameter 0.2m and height 1.5m), its action
space (e. g., turn left, right or move forward), and sensors — a simulated e. g., RGB-D camera.
Depending on the hardware, the simulator can produce up to 10.000 frames per second, allowing to
train agents on billions of interactions in a matter of days.
Real-world — Our physical robot is a “Locobot” [22] featuring an RGB-D camera and an additional
LIDAR sensor which we installed. We use the LIDAR and the ROS NavStack to collect ground truth
information on the robot’s position (x∗ , y∗ ) and angle α ∗ , used as a reference to evaluate ego-pose
localization performances on the real-world. To increase precision, we do not build the map online
with SLAM, but instead, export a global map from the 3D scan described above and align this map
with the LIDAR scan using the ROS NavStack.
Ego-pose estimation: the trained agent — Traditionally, ego-pose estimation of robots is performed
from various inputs such as LIDAR, odometry, or visual input. Localization from RGB data is
classically performed from keypoint-based approaches and matching/alignment [4]. More recently,
this task has been addressed using end-to-end training of deep networks. We opted for the latter, and,
inspired by poseNet [18], trained a deep convolutional network to take a stacked RGB-D image Xi
of shape (256×256×4) and directly output a vector Yi = (xi , yi , αi ) of three values: the coordinates
xi , yi and the orientation angle αi . The model is trained on 60.000 images sampled from the simulator
with varying positions and orientations while assuring a minimal distance of 0.3 meters between data
points. We optimize the following loss function between predictions Yi = (xi , yi , αi ) and ground truth
(GT) Yi∗ = (xi∗ , y∗i , αi∗ ) over training samples i:

                                             ∗      2
                                           x   x
                     L = (1 − γ) ∑           − ∗            + γ ∑ |α − α ∗ |mod 2π                   (1)
                                      i
                                           y   y        2       i

where ||.||2 is the L2 norm and γ is a weighting hyper-parameter set to 0.3 in our experiments.

                                                   3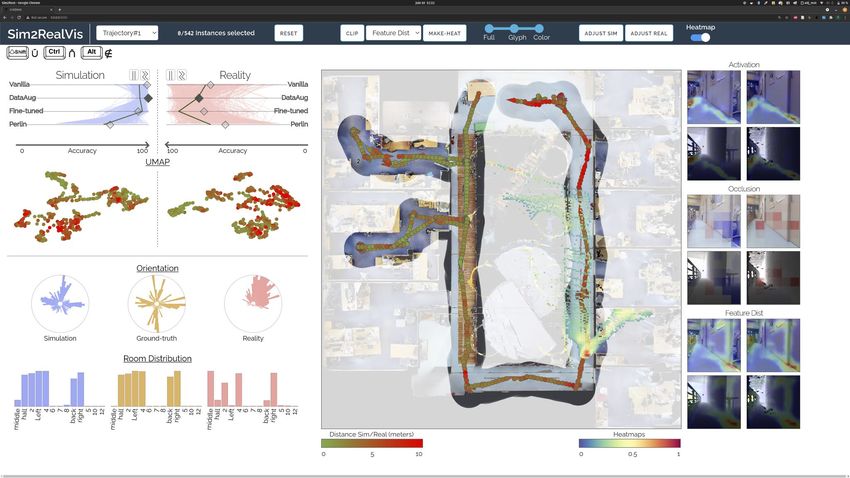
3   Related work

Closing the sim2real gap and transfer learning — Addressing the sim2real gap relies on methods
for knowledge transfer, which usually combine a large number of samples from simulation and/or
interactions obtained with a simulator simulation with a significantly smaller number of samples
collected from the real-world. Although machine learning is a primary way of addressing the transfer,
it remains important to assess and analyze the main sources of discrepancies between simulation
and real environments. A common strategy is to introduce noise to the agent state based on statistics
collected in the real-world [32]. Additionally, tweaking the collision detection algorithm to prevent
wall sliding has been shown to improve the performance in the real-world of navigation policies
trained in simulation [17], which tend to exploit inaccurate physics simulation. Another approach is
to uniformly alter simulation parameters through domain randomization, e. g., modifying lighting
and object textures, to encourage models to learn invariant features during training [37, 38]. This
line of work highly benefits from domain expert knowledge on the targeted environment, which can
provide randomizations closer to reality [30, 15].
A different family of methods addresses the sim2real gap through Domain Adaption, which focuses
on modifying trained models’ and their features learned from simulation to match those needed
for high performance in real environments. This has been explored by different statistical methods
from the machine learning toolbox, including discriminative adversarial losses [40, 6]. Feature-wise
adaptation has also been addressed by extensive use of loss [10, 39], and through fine-tuning [31].
Instead of creating invariant features, other approaches perform Domain Adaption at pixel level [3, 2].
Despite great results, Domain Adaptation suffers from the need for real-world data, which is often
hard to come by. We argue that there is a need for the assistance of domain experts and model builders
to understand the main sources of sim2real gaps, which can then be leveraged for targeted adapted
domain transfer, e.g. through specific types of representations or custom losses.
Visual analytics and interpretability of deep networks — Due to their often generic computational
structures, their extremely high number of trainable parameters (up to the orders billions) and the
enormous amounts of data on which they have been trained, deep neural networks have a reputation
of not being interpretable and providing predictions that cannot be understood by humans, hindering
their deployment to critical applications. The main challenge is to return control over the decision
process to humans, engineers, and model builders, which has been delegated to training data. This
arguably requires the design of new tools capable of analyzing the decision process of trained models.
The goal is to help domain experts to improve models, closing the loop, and build trust in end-users.
These goals have been addressed by, both, the visualization, and machine learning communities [14].
Convolutional neural networks have been studied by exposing their gradients over input images,
along with filters [42]. Combined with visual analytics [21], this approach provided a glimpse on
how sensible the neurons of those models are to different patterns in the input. Gradients can also be
visualized combined with input images to highlight elements towards which the model is attracted
to [34], with respect to the desired output (e. g., a class).
More recently those approaches have been extended with class driven attributions of features [28, 5]
which can also be formulated as a graph to determine the decision process of a model through
interpretation of features (e. g., black fur for bears) [13]. However, these approaches are often limited
to image classification tasks such as ImageNet, as they need features to exploit human interpretable
concepts from given images.
Interpretable robotics — This classical line of work remains an under-explored challenge when
applied to regression tasks such as robot ego-localization, our targeted application, in which attribu-
tions may be harder to interpret. To our knowledge, visualization of transfer learning, and especially
targeting sim2real is an under-explored area, in particular for navigation tasks, where experiments
with real physical robots are harder to perform compared to, say, grasping problems. In [36], the
evolution of features is explored before and after transfer through pair-wise alignment. Systems such
as [23] address transfer gaps through multi-coordinated views and an in-depth analysis for models
weights and features w.r.t. domains. In [16], the focus is on inspecting the latent memory of agents
navigating in simulated environments. Finally, common visualizations consist in heatmaps designed
to illustrate results from papers in ML communities such as [40, 43].
Despite providing insights on how models adapt to different domains, and in contrast to our work,
those methods have not been designed to directly target what parts of the environment, or which

                                                   4
sensor settings may produce sim2real gaps, which we consider as relevant information for domain
experts.

4     S IM 2R EALV IZ: A visual analytics tool to explore the sim2real gap
We introduce S IM 2R EALV IZ, an interactive visual analytics tool designed to assist domain experts in
conducting in-depth analyses of the performance gaps between simulation and real environments of
models whose primary task is ego-localization. The tool is implemented in JavaScript and the D3 [1]
library to run in modern browsers and directly interacts with models implemented in Pytorch [29].
The tool and its source code are available as an open-source project at:
https://github.com/Theo-Jaunet/sim2realViz .

4.1   Tasks analysis

Prior to the design of S IM 2R EALV IZ, we conducted interviews with 3 experts in Robotics and
discussed their workflow, with the objective being to address and identify sim2real gaps. Two of
those experts, co-author of this work, then took part in the design of S IM 2R EALV IZ. The workflow
of interrogated experts consisted in identifying failure cases through statistics or video replaying a
robot’s trajectory, and then manually finding equivalent images in simulation to compare to. From
those discussions, and literature review introduced in sec. 3, we distill their process in the following
three families of tasks.

    T1.   Fine-grained assessment of model performance gap between SIM and REAL — What
          is the best performing sim2real transfer method (e. g., fine-tuning, domain randomization
          etc.)? What are the optimal hyper-parameters? Answering those questions requires experts
          to study a large number of predictions in SIM and REAL from a large number of observed
          images and evaluate performance distribution over different environment conditions and
          factors of variation.
    T2.   Identification of the source of the performance gap — what are the factors of variation in
          the environment, agent, or trained model, which are responsible for the performance gap?
          This is inherently difficult, as the sources may be due to the global environment (differences
          in e.g., lightening, 3D scanning performance), the agent (e. g., differences in camera focal
          length or height) or changes due to the time span between scanning and physical deployment
          (e. g., furniture changes). In addition, some gaps may also be beyond human comprehension
          such as adversarial noise. For a human designer, it may not immediately be clear, which
          differences will have the largest impact on prediction performance.
    T3.   Closing the sim2real gaps — successful knowledge transfer requires the simulator to be as
          close as possible to the real-world scenario with respect to the factors of variation identified
          in T2. The goal is to close the loop and increase prediction performance using the insights
          gained from using S IM 2R EALV IZ.

4.2   Design rationale

Our design is centered around the comparison of simulation instances and real-world ones. As we deal
with complex objects, and because sim2real gaps can emerge from various sources, we implemented
several views with different comparison strategies [11]. As illustrated in Fig. 1, S IM 2R EALV IZ
follows the overview+detail interface scheme [8] with a range from the most global views (left), to the
most specific ones (right). To ease the comparison, simulation and real-world data are displayed next
to each other within each view, with, if possible, simulation on the left side and real-world on the right
side. The objective of the Statistics view (Fig. 1 ①) is to help in quickly identifying the performance
of a model and to grasp global behavior with simple visualizations. The Geo-map (Fig. 1 ②), is
key in providing context on the instance predictions, and for users to grasp what factors of variation
may cause sim2real gaps. Finally, the Instance view (Fig. 1 ③), displays how models may perceive
sim2real gaps under different scopes. To encode the main information related to the gap we used
three colors corresponding to either SIM , REAL , or GT , accross the visualizations. We also used
color to encode the distance between two sets of coordinates or the intensity of the models’ attention
towards parts of input images using a continuous turbo [26] color scale, commonly used by experts,
to emphasize the most critical instances, i. e. those with high values.

                                                    5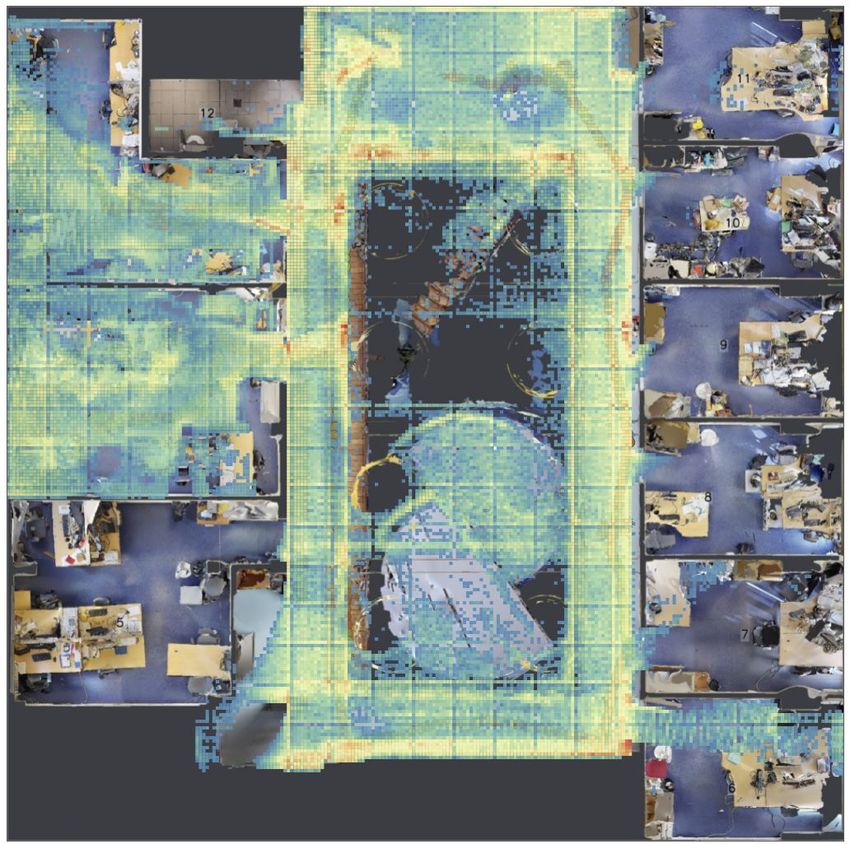
4.3   Main-stream workflow

We now provide a typical workflow of use of S IM 2R EALV IZ:

      1. Models are pre-loaded and their overall performances on both SIM and REAL are dis-
         played on the top left of S IM 2R EALV IZ (Fig. 1 ①).
      2. After model selection, users can start a fine-grained performance analysis of SIM and REAL
         models by observing global statistics views such as a UMAP [24] projection of embeddings
         in which each dot is an instance, and its color encodes how far it is to its counterpart (sim or
         real). Followed by a radial bar chart of predicted or ground-truth orientation, and finally, a
         distribution of positions in which each room is a bar, and their height corresponds to how
         many predictions there is. In any of those views, users can select a set of instances to be
         inspected (e. g., a cluster in UMAP).
      3. Any such selection updates a geo-map (Fig. 1 ②), i.e. a “geometric” bird’s eye view, in
         which users can inspect the predictions in a finer scale. Users can adapt the geo-map to
         either color-mode which only displays ground-truth positions with their colors indicating
         how far sim and real predictions are, or full-mode which displays sim predictions, ground-
         truth positions, and real predictions. Instances can be selected for further inspection by
         mouse-hovering them.
      4. An instance selection updates the instance view (Fig. 1 ③) and displays heatmaps, which
         highlights the portions of images on which the model most focuses on, or which it perceives
         as different. Such a heatmap is also back-projected over the geo-map to highlight portions
         of the environment, which most likely carry sim2real gaps (Fig. 1 ④).

The views in S IM 2R EALV IZ are multi-coordinated, i.e. any of them, including the geo-map, can be
used as an entry point to formulate complex queries such as “what are the instances which perform
poorly in simulation, but good in real-world while being in a selected region of the environment?”.
Concretely, those combinations of selection can be done using sets operations ({union, intersection,
and complementary}), which can be selected through interactions with the corresponding views. This
is further emphasized by the fact that the performance differences between simulation and real-world
are also color-encoded on the geo-map.

4.4   Heatmaps

To facilitate the inspection of the sim2real gap through image comparisons, S IM 2R EALV IZ provides
heatmaps superimposed over images, from a selected instance, to draw user attention towards
key portions of inputs extracted by the trained model (Fig. 1 ③). Feature-wise visualizations are
essential, as visual differences between simulated and real-world images perceived by humans may
not correspond to differences in features with a high impact on model decisions. Fig. 1 ③ illustrates
the result of three approaches to generate those heatmaps, as follows (from top to bottom):
Regression activation mapping — Inspired by grad-CAM [33] and RAM [41], we design heatmaps
to highlight regions in the input, which have a high impact on model prediction. For each forward-pass
of a model, we collect feature maps from the last CNN layer and multiply them by the weights of
the last FC layer, obtaining an overlay of the size of the feature map, which is then re-scaled to fit
the input image and normalized to fit a turbo color scale (Sec. 4.2). Similarity of activation maps
between two similar SIM and REAL images suggests a similarity of the two input images from the
model’s reasoning perspective.
Sim/Real occlusion — Occlusion sensitivity [42] is a common method to visualize how neural
networks in computer vision rely on some portions of their input images. It consists in applying
gray patches over an image, forwarding it to a model, and observing its impact on the model’s
prediction. By sampling a set of patches, we can then overlay the input with this information, blue
color indicating that the occluded prediction is closer to the original ground truth, and red otherwise.
In our case, the intuition and solution are slightly different from the standard case. We are interested in
areas of the input image, where the model performance is improved when the real-world observation
is replaced by simulated information, indicating a strong sim2Real gap. We, therefore, occlude input
REAL images with RGB or Depth patches from the corresponding simulated image. Thus, a further
advantage of this approach is the possibility to discriminate between gaps in RGB or Depth input.

                                                    6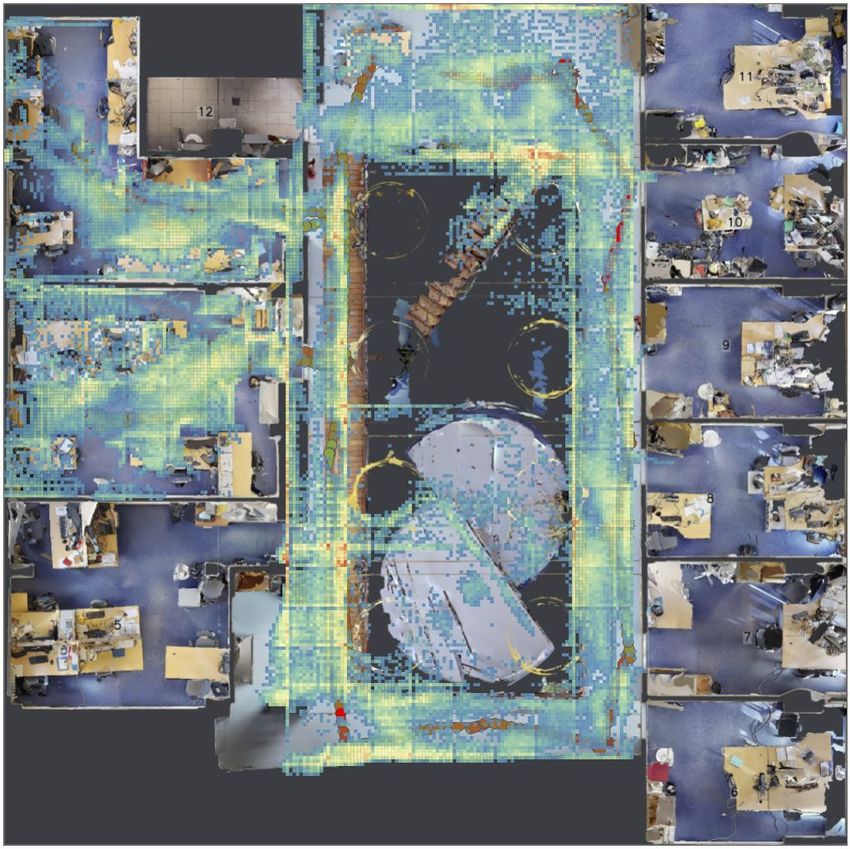
Coordinates
             Orientation

               Distance
              Pos. in Img

                Height
                Ratio
                 Fov

Figure 3: Conversion from pixels on a first-person point of view image to coordinates on a bird’s
eye geo-map (left). Such a process, used in S IM 2R EALV IZ to display global heatmaps (right) on
the geo-map, relies on ground-truth, image, and camera information. To optimize their computation,
geo-maps are discretized into squares larger than a pixel, as a trade-off between the accuracy of
projections, and the time to provide feedback to users upon interactions

The size of the patches is governed by a Heisenberg-like uncertainty trade-off between localization
performance and measurement power. After experimenting with patch size ranging from 2 × 2 pixels
to 128 × 128, we concluded that patches of 40 × 40 pixels, i. e. a total of 6 × 6 patches per image, are
the more suitable to analyze images on our computer as we estimated that response time for such an
interaction should be less than one second. This is due to the fact that this is displayed on mouse-over,
hence multiple instances can quickly be probed by an user, and a longer interaction time dampens the
usability and user experience of S IM 2R EALV IZ.
Features map distance — Another approach implemented in S IM 2R EALV IZ is to gather the feature
map of the last CNN layer during a forward pass on both the simulation and its corresponding
real-world image, and then compute a distance between them. The result is a matrix with the size of
the feature map which is then overlaid like the activation mapping. After some iterations, we opted
for the product of the cosine distance which favors small changes, and L1 which is more inclined to
produce small spots. Such a product offers a trade-off between highlighting every change and face
over-plotting while focusing only on one specific spot with the risk of losing relevant changes.

4.5   Contextualization on the global geo-map

As illustrated in Fig. 1 ④ and in Fig. 3, information from the individual first-person 3D projective input
images, including heatmaps, can be projected into the global bird’s eye view, and thus overlaid over
the geo-map. This is possible thanks to ground truth information, i. e. coordinates, and orientation
of the instance, combined with information of the calibrated onboard cameras (simulated and real)
themselves such as its field-of-view, position on the robot, resolution, and the range of the depth
sensor. To do so, the environment is discretized in 264 × 264 blocks initially filled with zeroes, and
images are downsampled to 128×128. Each cell is converted into (x, y) coordinates, and its average
value from a heatmap is summed with the closest environment block to (x, y) coordinates. Finally,
the values of environment blocks are normalized to fit the turbo color scale and then displayed as an
overlay on the geo-map. This process can also be applied to the complete dataset available at once to
provide an overview of sim2real gaps of the environment as perceived by a model. Fig. 3 shows the
conversion of heatmaps from the complete real-world dataset to a geo-map overlay using different
aggregation strategies. This overlay can be displayed using the button make-heat from the geo-map
view (fig 1 ②).

4.6   Exploration of input configurations

To check the impact of simulation gaps due to global imaging parameters, S IM 2R EALV IZ provides
ways to adjust real-world images through filters such as brightness, contrast, temperature, and
dynamic range of depth. As illustrated in Fig. 4, those filters can are generated with sliders on the
right of instance view (Fig. 1 ④). Any adjustment on a selected instance updates the corresponding
prediction in real-time. Once a set of adjustments is validated by the user, it can be saved, applied to

                                                    7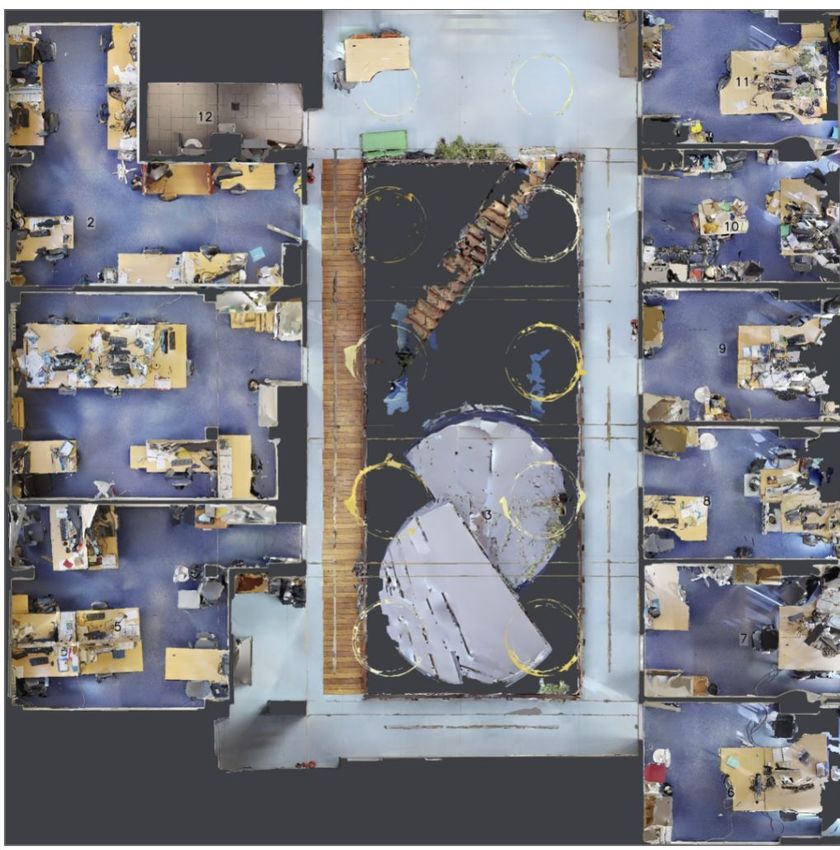
the whole real-world dataset, and treated as a new model in the model gaps overview ① for further
analysis.
The configuration of inputs can also be used on images
from simulation, to analyze the performance of the model
under specific Domain Randomization configurations, or
simulation settings such as, for example, the height of the
camera, or its FoV. Of course, to have an impact of the
simulation on real-world images, the models need to be
retrained outside of S IM 2R EALV IZ. To do so, one must
first generate a new dataset with the modified settings, in
our case 60k images, which can take around half a hour as
we also need to enforce diversity of sample images (coordi-
nates and orientation). Then, train from scratch our model
takes around 3 to 4 hours on our single NVIDIA Quadro
P4000 GPU. Despite such a delay, adjusting simulation         Figure 4: By clicking on the adjust but-
images in S IM 2R EALV IZ can be useful to help manually      ton (on the top-right of Fig. 1), users can
extracting parameters of the real-world camera, and hence     display sliders on the right of instance
assist in the configuration of the simulator. Producing       view Fig. 1 ④) that can be used to fine-
images, by configuring the simulator with direct feedback,    tuning real-world images with filters and
should reduce the workload usually required to configure      observe how it affect models’ prediction.
simulators and real-world robots.

5   Case studies

We report on illustrative case studies we conducted to demonstrate how S IM 2R EALV IZ can be used
to provide insights on how different neural models may be influenced by sim2real gaps. During these
experiments, S IM 2R EALV IZ is loaded with the following methods for sim2real transfer: vanilla
(i. e. no transfer, deployment as-is), dataAug (i. e. with Domain Randomization over brightness,
contrast, dynamic range, hue), fine-tuning on real-world images, and perlin, a hand-crafted noise
on depth images designed to be similar to real-world noise. We use visual data extracted from two
different trajectories of the physical Locobot agent in the real environment performed with several
months between them and at different times of the day, which provides a diverse range of sim2real
gaps and optimizes generalization. Those models and data are available in our GitHub repository at:
https://github.com/Theo-Jaunet/sim2realViz .
Insights on sim2real gaps grasped using S IM 2R EALV IZ can be leveraged from two different per-
spectives echoing current sim2real transfer approaches. First, similar to Domain Adaptation, we can
provide global modifications of the REAL images (e. g., brightness), which can be placed as filters
and used in S IM 2R EALV IZ. Second, related to Domain Randomization, by modifying the simulator
settings (e. g., adding or removing objects in the environment), and then by training a new model
on it. In what follows, we describe several types of sim2real gaps, which have been identified and
partially addressed in our experiments.
Unveiling biases in predictions — Once loaded, users can observe how models perform on simulated
and real-world data provided by different models trained and transferred with different methods,
as shown in Fig. 1 ①. We report that best real-world performances are reached using dataAug,
with an average of 84% accuracy, rather than Fine-tuning, with an average accuracy of 80%. This
performance is evaluated on traj#1, whereas traj#2 had been used for fine-tuning on real-world data,
ensuring generalization over experimental conditions in the environment. In what follows we will
focus on the dataAug model, which a user can further analyze by clicking on its corresponding
diamond (Fig. 1 ①). This updates every other views to display data extracted from this model. To
assess what the worst real-world prediction is, users can use the min filter on the top of Fig. 1 ①. This
removes from each view of S IM 2R EALV IZ instances whose real-world performances are not among
the bottom 15%. In our case, the remaining data displayed corresponds to instances sampled from the
right corridor regardless of the model used. We conjecture, that corridors are among the most difficult
instances as they are quite large and lack discriminative landmarks. However, in opposition, by using
the max filter, we can also observe that the left-side corridor is among the most successful predictions.
By hovering those corridor instances with a successful transfer, we can inspect activation heatmaps
and observe that model attention is driven towards the limit between a wooden path (unique to the left

                                                   8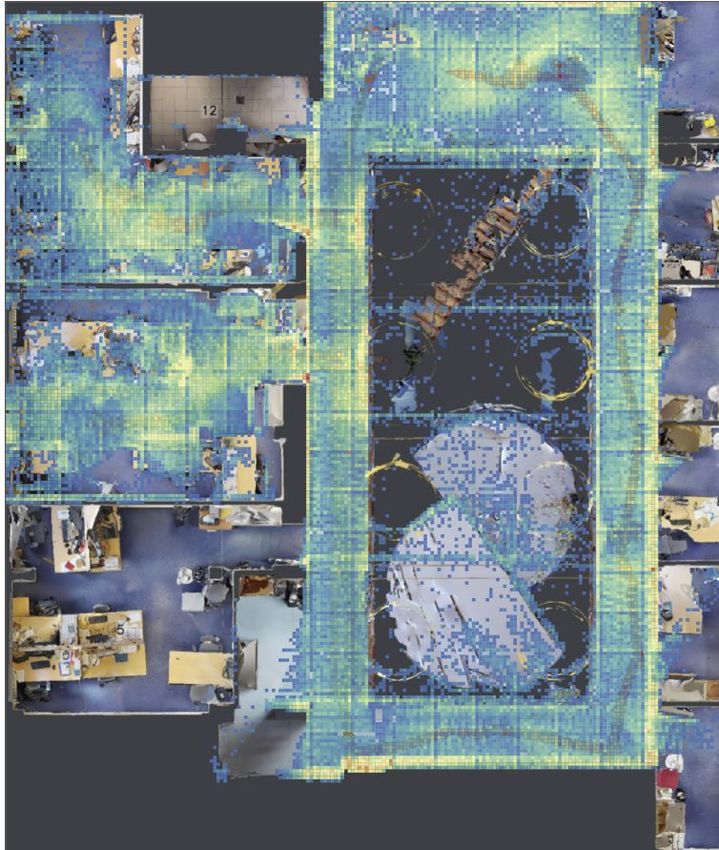
1 2
Figure 5: By using the full encoding, we can observe that most real-world predictions are located in
the half left of the environment ①. Hence, instances sampled from the half right of the environment
provide the worst predictions. However, when we slightly increase the brightness of each real-world
image, we can observe that instances are more evenly distributed over the environment ②.
corridor) and a wall. Thus, the model seems to have learned to discriminate between corridors, which
suggests that the confusion between them may be due to other reasons. By switching the encoding
on the geo-map to full using the slider on the middle top of S IM 2R EALV IZ, the geo-map updates to
display SIM , REAL , and GT positions (Fig. 5 ①). With this, we can observe that the vanilla model,
incorrectly predicts real-world positions from the half right of the environment in the half left. Since
those instances are correctly predicted in simulation, this indicates a very strong bias from most of
the half right real-world instances. A similar phenomenon is also observed for the dataAug model
with instances on the right corridor creating predictions pointing to the middle of the environment,
which is also an unreachable area.
Simulator Edited Simulator
Closing the loop with filters — We verify the 1
hypothesis of regression to the mean, which is
often an “easy” short-cut solution for a model in
absence of regularities in data, or when regular-
ities are not learned. The following focuses on
the vanilla model, as it is the one with the most
real-world predictions on the half left of the envi-
ronment. We perform global adjustments of the
imaging parameters of the real-world images as
described in Sec. 4.6, in particular setting both
RGB and depth input to zero (i. e. uniform black
images), leading to the same constant predic-
tions in the middle of the environment, corrob-
orating the hypothesis.
While adjusting the brightness filter, we no- 2
ticed that making images from the right corridor
darker, yielded real-world predictions to be even
more to the half left of the environment. In op-
position, by making those images 15% brighter,
yielded real-world predictions, more accurately, Figure 6: With global heatmaps of feature-
in the half right of the environment leading to a distance, we can observe (in red) areas of the
slight improvement of the overall performance environment that may be affected by a sim2real
of 1.5% (Fig 5 ②). gap. Those areas correspond to changes in objects
present in the simulation, for instance as illustrated
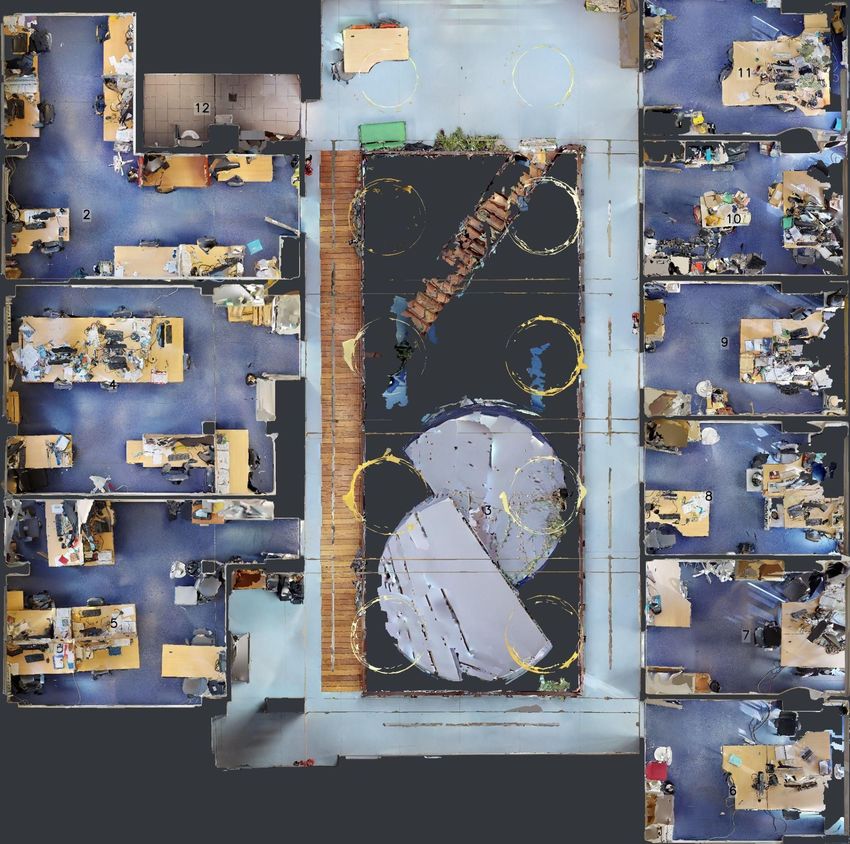
Sim2real gaps due to layout changes —
here, a fire-extinguisher. By removing such objects
Trained models deployed to real environments
in simulation and retraining a model on them, we
need to be resilient to dynamic layout changes
can observe that they disappeared from most high-
such as opened/closed doors, the presence of
lighted areas.
humans or moved furniture and other objects.
In S IM 2R EALV IZ, this can be investigated us-
ing the global heatmap with feat-dist, displayable with the make heat button on the middle top of
S IM 2R EALV IZ as seen in Fig. 1. In such geo-map overlay, some areas of the environment noticeably
9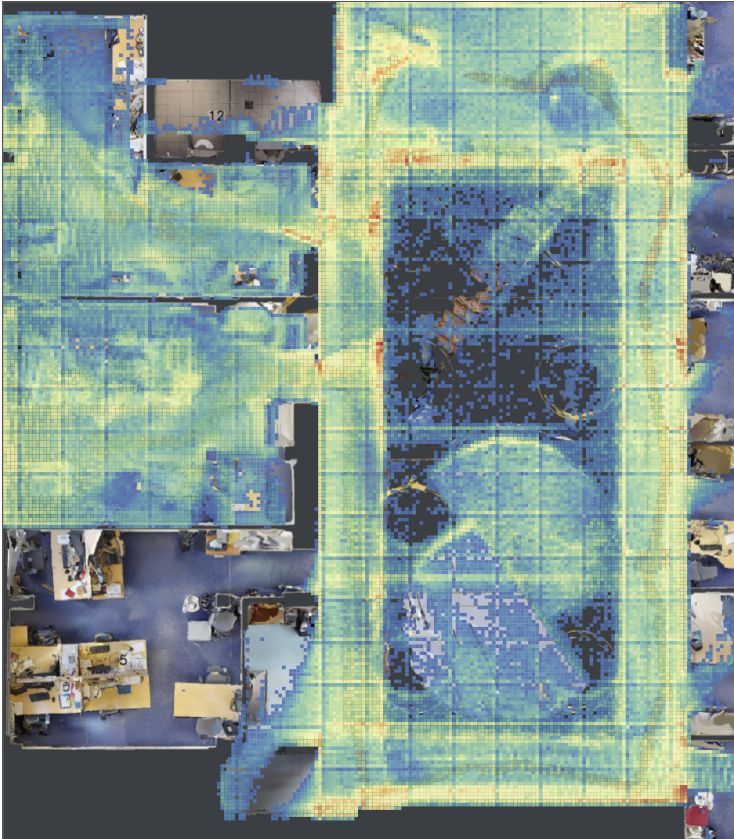
stand out (red in Fig. 6). By hovering over instances on the geo-map nearby those areas, and browsing
their corresponding images (as in Fig. 1 ④), we can observe that those areas are triggered by different
factors. For instance, in Fig. 6 ②, the highlighted area corresponds to the presence of a bike in the
simulated data, which was not present when the real-world data had been captured. Other areas
correspond to changed furniture, and imperfections of the simulation when rendering, for instance, a
fire-extinguisher (Fig 6 ①). Such behavior, which can be observed across models, may benefit from
specific attention while addressing sim2real transfer.
Editing the simulator — In order to test such a hypothesis, we manually edited the simulator and
removed objects corresponding to two red areas using blender, a 3D modeling software. This new
simulation is then used to generate 60k new images. Using these data, we trained a new dataAug
model and loaded its predictions in S IM 2R EALV IZ to evaluate the influence of those changes on real-
world performance. Fig. 6 shows the global feat-dist heatmap on trajectory#1 created with the new
model, taking into account the changes. We can see that the areas with the most significant differences
are more uniformly distributed over the environment. Since global heatmaps are normalized over the
complete dataset, this indicates that, to the model, those areas are now closer in feature space.
The experiments described above have lead to a better understanding of the sim2real gap of our
baseline agent, and we reported more robust localization performance once these insights were
leveraged to modify the simulator or by learning filters for the existing model. We hope that
S IM 2R EALV IZ will be adopted and facilitate the design and training of trained robotic agents.
6   Conclusion and perspectives
We introduced S IM 2R EALV IZ, an interactive visual analytics tool designed to perform an in-depth
analysis of the emergence of sim2real gaps from neural networks applied to robot ego-localization.
S IM 2R EALV IZ supports both overview and comparison of the performances of different neural
models, which instances can be browsed based on metrics such as performance or distribution. Those
metrics can be combined using set operations to formulate more elaborated queries. We also reported
scenarios of use of S IM 2R EALV IZ to investigate how models are inclined to exploit biases, such as
regression to the mean, and are easily disturbed by layout changes, such as moved objects.

References
 [1] M. Bostock, V. Ogievetsky, and J. Heer. D3: Data-Driven Documents. IEEE Trans. Visualization
     & Comp. Graphics (Proc. InfoVis), 2011.
 [2] K. Bousmalis, A. Irpan, P. Wohlhart, Y. Bai, M. Kelcey, M. Kalakrishnan, L. Downs, J. Ibarz,
     P. Pastor, K. Konolige, et al. Using simulation and domain adaptation to improve efficiency
     of deep robotic grasping. In 2018 IEEE international conference on robotics and automation
     (ICRA), pp. 4243–4250. IEEE, 2018.
 [3] K. Bousmalis, N. Silberman, D. Dohan, D. Erhan, and D. Krishnan. Unsupervised pixel-level
     domain adaptation with generative adversarial networks. In Proceedings of the IEEE conference
     on computer vision and pattern recognition, pp. 3722–3731, 2017.
 [4] E. Brachmann, M. Humenberger, C. Rother, and T. Sattler. On the limits of pseudo ground truth
     in visual camera re-localisation. In preprint arxiv:2109.00524, 2021.
 [5] S. Carter, Z. Armstrong, L. Schubert, I. Johnson, and C. Olah. Activation atlas. Distill, 2019.
     https://distill.pub/2019/activation-atlas. doi: 10.23915/distill.00015
 [6] A. Chadha and Y. Andreopoulos. Improved techniques for adversarial discriminative domain
     adaptation. IEEE Transactions on Image Processing, 29:2622–2637, 2019.
 [7] A. Chang, A. Dai, T. Funkhouser, M. Halber, M. Niessner, M. Savva, S. Song, A. Zeng, and
     Y. Zhang. Matterport3D: Learning from RGB-D Data in Indoor Environments. International
     Conference on 3D Vision (3DV), 2017.
 [8] A. Cockburn, A. Karlson, and B. B. Bederson. A review of overview+ detail, zooming, and
     focus+ context interfaces. ACM Computing Surveys (CSUR), 41(1):1–31, 2009.
 [9] A. D. Dragan, K. C. Lee, and S. S. Srinivasa. Legibility and predictability of robot motion. In
     2013 8th ACM/IEEE International Conference on Human-Robot Interaction (HRI), pp. 301–308.
     IEEE, 2013.

                                                  10
[10] K. Fang, Y. Bai, S. Hinterstoisser, S. Savarese, and M. Kalakrishnan. Multi-task domain
adaptation for deep learning of instance grasping from simulation. In 2018 IEEE International
Conference on Robotics and Automation (ICRA), pp. 3516–3523. IEEE, 2018.
[11] M. Gleicher, D. Albers, R. Walker, I. Jusufi, C. D. Hansen, and J. C. Roberts. Visual comparison
for information visualization. Information Visualization, 10(4):289–309, Oct. 2011. doi: 10.
1177/1473871611416549
[12] I. J. Goodfellow, J. Shlens, and C. Szegedy. Explaining and harnessing adversarial examples.
arXiv preprint arXiv:1412.6572, 2014.
[13] F. Hohman, H. Park, C. Robinson, and D. H. Chau. Summit: Scaling deep learning interpretabil-
ity by visualizing activation and attribution summarizations. IEEE Transactions on Visualization
and Computer Graphics (TVCG), 2020.
[14] F. M. Hohman, M. Kahng, R. Pienta, and D. H. Chau. Visual Analytics in Deep Learning: An
Interrogative Survey for the Next Frontiers. IEEE Transactions on Visualization and Computer
Graphics, 2019. doi: 10.1109/TVCG.2018.2843369
[15] S. James, P. Wohlhart, M. Kalakrishnan, D. Kalashnikov, A. Irpan, J. Ibarz, S. Levine, R. Hadsell,
and K. Bousmalis. Sim-to-real via sim-to-sim: Data-efficient robotic grasping via randomized-
to-canonical adaptation networks. In Proceedings of the IEEE/CVF Conference on Computer
Vision and Pattern Recognition, pp. 12627–12637, 2019.
[16] T. Jaunet, R. Vuillemot, and C. Wolf. Drlviz: Understanding decisions and memory in deep
reinforcement learning. Computer Graphics Forum (EuroVis), 2020.
[17] A. Kadian, J. Truong, A. Gokaslan, A. Clegg, E. Wijmans, S. Lee, M. Savva, S. Chernova, and
D. Batra. Sim2real predictivity: Does evaluation in simulation predict real-world performance?
IEEE Robotics and Automation Letters, 5(4):6670–6677, 2020.
[18] A. Kendall, M. Grimes, and R. Cipolla. Posenet: A convolutional network for real-time 6-dof
camera relocalization. In Proceedings of the IEEE international conference on computer vision,
pp. 2938–2946, 2015.
[19] Z. C. Lipton. The mythos of model interpretability: In machine learning, the concept of
interpretability is both important and slippery. Queue, 16(3):31–57, 2018.
[20] M. Liu, S. Liu, H. Su, K. Cao, and J. Zhu. Analyzing the noise robustness of deep neural
networks. In 2018 IEEE Conference on Visual Analytics Science and Technology (VAST), pp.
60–71. IEEE, 2018.
[21] M. Liu, J. Shi, Z. Li, C. Li, J. Zhu, and S. Liu. Towards better analysis of deep convolutional
neural networks. IEEE transactions on visualization and computer graphics, 23(1):91–100,
2016.
[22] LoCoBot: An Open Source Low Cost Robot. http://www.locobot.org.
[23] Y. Ma, A. Fan, J. He, A. Nelakurthi, and R. Maciejewski. A visual analytics framework for
explaining and diagnosing transfer learning processes. IEEE Transactions on Visualization and
Computer Graphics, 2020.
[24] L. McInnes, J. Healy, and J. Melville. Umap: Uniform manifold approximation and projection
for dimension reduction. arXiv preprint arXiv:1802.03426, 2018.
[25] B. Mehta, M. Diaz, F. Golemo, C. J. Pal, and L. Paull. Active domain randomization. In
Conference on Robot Learning, pp. 1162–1176. PMLR, 2020.
[26] A. Mikhailov. Google ai blog: Turbo, an improved rainbow colormap for visualization. https:
//ai.googleblog.com/2019/08/turbo-improved-rainbow-colormap-for.html.
[27] S.-M. Moosavi-Dezfooli, A. Fawzi, and P. Frossard. Deepfool: a simple and accurate method
to fool deep neural networks. In Proceedings of the IEEE conference on computer vision and
pattern recognition, pp. 2574–2582, 2016.
[28] C. Olah, A. Satyanarayan, I. Johnson, S. Carter, L. Schubert, K. Ye, and A. Mordvintsev. The
building blocks of interpretability. Distill, 2018. https://distill.pub/2018/building-blocks. doi:
10.23915/distill.00010
[29] A. Paszke, S. Gross, F. Massa, A. Lerer, J. Bradbury, G. Chanan, T. Killeen, Z. Lin,
N. Gimelshein, L. Antiga, A. Desmaison, A. Kopf, E. Yang, Z. DeVito, M. Raison, A. Tejani,
11S. Chilamkurthy, B. Steiner, L. Fang, J. Bai, and S. Chintala. Pytorch: An imperative style,
high-performance deep learning library. In Advances in Neural Information Processing Systems
32, pp. 8024–8035. Curran Associates, Inc., 2019.
[30] A. Prakash, S. Boochoon, M. Brophy, D. Acuna, E. Cameracci, G. State, O. Shapira, and
S. Birchfield. Structured domain randomization: Bridging the reality gap by context-aware
synthetic data. In 2019 International Conference on Robotics and Automation (ICRA), pp.
7249–7255. IEEE, 2019.
[31] A. A. Rusu, M. Večerík, T. Rothörl, N. Heess, R. Pascanu, and R. Hadsell. Sim-to-real robot
learning from pixels with progressive nets. In Conference on Robot Learning, pp. 262–270.
PMLR, 2017.
[32] M. Savva, A. Kadian, O. Maksymets, Y. Zhao, E. Wijmans, B. Jain, J. Straub, J. Liu, V. Koltun,
J. Malik, D. Parikh, and D. Batra. Habitat: A Platform for Embodied AI Research. In
Proceedings of the IEEE/CVF International Conference on Computer Vision (ICCV), 2019.
[33] R. R. Selvaraju, M. Cogswell, A. Das, R. Vedantam, D. Parikh, and D. Batra. Grad-cam: Visual
explanations from deep networks via gradient-based localization. In Proceedings of the IEEE
international conference on computer vision, pp. 618–626, 2017.
[34] J. T. Springenberg, A. Dosovitskiy, T. Brox, and M. Riedmiller. Striving for Simplicity: The
All Convolutional Net. 12 2014.
[35] H. Strobelt, S. Gehrmann, H. Pfister, and A. M. Rush. Lstmvis: A tool for visual analysis of
hidden state dynamics in recurrent neural networks. IEEE transactions on visualization and
computer graphics, 24(1):667–676, 2017.
[36] R. Szabó, D. Katona, M. Csillag, A. Csiszárik, and D. Varga. Visualizing transfer learning.
arXiv preprint arXiv:2007.07628, 2020.
[37] J. Tobin, R. Fong, A. Ray, J. Schneider, W. Zaremba, and P. Abbeel. Domain randomization
for transferring deep neural networks from simulation to the real world. In 2017 IEEE/RSJ
international conference on intelligent robots and systems (IROS), pp. 23–30. IEEE, 2017.
[38] J. Tremblay, A. Prakash, D. Acuna, M. Brophy, V. Jampani, C. Anil, T. To, E. Cameracci,
S. Boochoon, and S. Birchfield. Training deep networks with synthetic data: Bridging the
reality gap by domain randomization. In Proceedings of the IEEE Conference on Computer
Vision and Pattern Recognition (CVPR) Workshops, June 2018.
[39] E. Tzeng, C. Devin, J. Hoffman, C. Finn, P. Abbeel, S. Levine, K. Saenko, and T. Darrell.
Adapting deep visuomotor representations with weak pairwise constraints. In Algorithmic
Foundations of Robotics XII, pp. 688–703. Springer, 2020.
[40] E. Tzeng, J. Hoffman, K. Saenko, and T. Darrell. Adversarial discriminative domain adaptation.
In Proceedings of the IEEE conference on computer vision and pattern recognition, pp. 7167–
7176, 2017.
[41] Z. Wang and J. Yang. Diabetic retinopathy detection via deep convolutional networks for
discriminative localization and visual explanation. arXiv preprint arXiv:1703.10757, 2017.
[42] M. D. Zeiler and R. Fergus. Visualizing and understanding convolutional networks. In European
conference on computer vision, pp. 818–833. Springer, 2014.
[43] F. Zhu, L. Zhu, and Y. Yang. Sim-real joint reinforcement transfer for 3d indoor navigation. In
Proceedings of the IEEE/CVF Conference on Computer Vision and Pattern Recognition, pp.
11388–11397, 2019.
12You can also read