Sleeve Gastrectomy Suppresses Hepatic Glucose Production and Increases Hepatic Insulin Clearance Independent of Weight Loss
←
→
Page content transcription
If your browser does not render page correctly, please read the page content below
Diabetes Volume 70, October 2021                                                                                                                         2289

Sleeve Gastrectomy Suppresses Hepatic Glucose
Production and Increases Hepatic Insulin Clearance
Independent of Weight Loss
Rachel Ben-Haroush Schyr,1 Abbas Al-Kurd,2 Botros Moalem,1 Anna Permyakova,3 Hadar Israeli,1
Aya Bardugo,1 Yhara Arad,1 Liron Hefetz,1 Michael Bergel,1 Arnon Haran,1 Shahar Azar,3
Itia Magenheim,1 Joseph Tam,3 Ronit Grinbaum,2 and Danny Ben-Zvi1
Diabetes 2021;70:2289–2298 | https://doi.org/10.2337/db21-0251

Bariatric operations induce weight loss, which is associ-                        duces glucose by glycogenolysis and gluconeogenesis
ated with an improvement in hepatic steatosis and a reduc-                       according to substrate availability, neuronal cues, hor-
tion in hepatic glucose production. It is not clear whether                      monal signaling, and cellular redox state, while glucose
these outcomes are entirely due to weight loss, or whet-                         production is normally suppressed by insulin signaling
her the new anatomy imposed by the surgery contributes

                                                                                                                                                                   OBESITY STUDIES
                                                                                 (1–4). The liver degrades a fraction of the insulin passing
to the improvement in the metabolic function of the liver.                       through it by internalizing insulin bound to the insulin
We performed vertical sleeve gastrectomy (VSG) on obese
                                                                                 receptor complex. Insulin is then degraded intracellularly,
mice provided with a high-fat high-sucrose diet and com-
                                                                                 and the unbound receptor is transported back to the sur-
pared them to diet and weight-matched sham-operated
mice (WMS). At 40 days after surgery, VSG-operated mice
                                                                                 face. Insulin receptor availability, insulin signaling, and
displayed less hepatic steatosis compared with WMS. By                           clearance are tightly linked (5–8).
measuring the fasting glucose and insulin levels in the                             Hepatic steatosis is characterized by the accumulation
blood vessels feeding and draining the liver, we showed                          of lipid droplets in hepatocytes. It is associated with insu-
directly that hepatic glucose production was suppressed                          lin resistance, hyperinsulinemia, and reduced hepatic
after VSG. Insulin levels were elevated in the portal vein,                      insulin clearance and may lead to the development of
and hepatic insulin clearance was elevated in VSG-oper-                          type 2 diabetes (T2D) (5,9–12). The mechanisms coupling
ated mice. The hepatic expression of genes associated                            hepatic steatosis and insulin resistance are under intense
with insulin clearance was upregulated. We repeated the                          study (10,13), but relatively less is known about the fac-
experiment in lean mice and observed that portal insulin                         tors linking hepatic steatosis and the reduction in insulin
and glucagon are elevated, but only insulin clearance is                         clearance (5–7).
increased in VSG-operated mice. In conclusion, direct                               Obesity drives hepatic steatosis and T2D. Bariatric
measurement of glucose and insulin in the blood entering
                                                                                 operations that lead to weight loss often alleviate meta-
and leaving the liver shows that VSG affects glucose and
                                                                                 bolic diseases, such as hepatic steatosis and T2D (14–18),
insulin metabolism through mechanisms independent of
                                                                                 and increase hepatic insulin sensitivity and clearance
weight loss and diet.
                                                                                 (19–25). Because bariatric surgeries induce rapid weight
                                                                                 loss in the months following surgery and a change in diet,
Hepatic glucose production is an essential component of                          it is difficult to determine to what extent weight loss,
the regulation of circulating glucose levels. The liver pro-                     change in diet, or the new anatomy contribute to the

1
  Department of Developmental Biology and Cancer Research, Institute for         Received 24 March 2021 and accepted 28 July 2021
Medical Research Israel-Canada, Hadassah Medical School–The Hebrew               This article contains supplementary material online at https://doi.org/10.2337/
University of Jerusalem, Jerusalem, Israel                                       figshare.15070008.
2
  Department of Surgery, Hadassah Medical Center-Mt. Scopus, Jerusalem, Israel
3                                                                                © 2021 by the American Diabetes Association. Readers may use this article
  Obesity and Metabolism Laboratory, Institute for Drug Research, School of
                                                                                 as long as the work is properly cited, the use is educational and not for
Pharmacy, Faculty of Medicine, The Hebrew University of Jerusalem, Jerusalem,
                                                                                 profit, and the work is not altered. More information is available at https://
Israel
                                                                                 www.diabetesjournals.org/content/license.
Corresponding authors: Rachel Ben-Haroush Schyr, rachel.schyr@mail.huji.
ac.il, and Danny Ben-Zvi, danny.ben-zvi@mail.huji.ac.il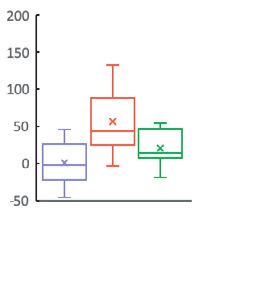
2290    Sleeve Gastrectomy Increases Insulin Clearance                                    Diabetes Volume 70, October 2021

improvement in hepatic insulin sensitivity and clearance       (Ethicon LT400) was placed parallel to the small curvature
in patients.                                                   of the stomach to form a sleeve from the stomach. The
   We and others have shown in clinical and animal stud-       excess stomach was cut, and 75% of the stomach was
ies that bariatric surgery affects glycemia and hepatic        removed. Muscle and skin were closed using Vicryl sutures.
metabolism also independent of weight loss by multiple         The sham procedure was the same except for placing the
pathways such as an increase in Glp1 signaling, changes        clip.
in the gut microbiome, and activation of hepatic peroxi-          All mice were treated daily with meloxicam, 2 mg/kg
some proliferator-activated receptor-a (PPARa) signaling       body wt, 3 days after surgery. The mice were fasted the
(26–34). We hypothesized that bariatric surgery reduces        night before surgery until the day after surgery, after
hepatic glucose production and increases hepatic insulin       which the presurgical diet was reintroduced. We limited
clearance also independent of weight loss and change of        the amount of food provided to weight-matched sham
diet. By measuring glucose and insulin levels in blood ves-    (WMS)-operated mice to 3.5 g per mouse per day to facili-
sels feeding and draining the liver, we show here that ver-    tate weight matching until weight matching was achieved.
tical sleeve gastrectomy (VSG) increases hepatic insulin       Additional food, up to 5 g per mouse per day, was pro-
clearance in obese and lean mice compared with weight-         vided as the VSG mice gained weight. Food was provided
matched sham-operated mice (WMS) and that hepatic              at the onset of the dark cycle and removed in the morn-
glucose production and hepatic steatosis are reduced in        ing in the VSG- and WMS-operated mice to limit the
VSG-operated mice compared with WMS fed a calorie-rich         effects of food restriction on circadian rhythms in both
diet. Together, these results provide evidence that VSG        groups. VSG-operated mice received ad libitum HFHS diet
affects hepatic insulin and glucose metabolism also inde-      during the night cycle.
pendent of diet and weight loss.                                  The Hsd:ICR and c57/Bl6 lean VSG mice both under-
                                                               went the same surgery as described but were provided ad
RESEARCH DESIGN AND METHODS                                    libitum normal chow before and 1 day after the surgery
Mice                                                           until the end of the experiment.
All studies were approved by the Hebrew University of             All mice were euthanized following 6 h of fasting at
Jerusalem Institutional Animal Care and Use Committee.         1–2 P.M.

High-Fat High-Sucrose Obesity Model                            Fat Mass
Male 60-day-old C57Bl/6OlaHsd mice were fed ad libitum         Body composition was determined by EchoMRI-100H
a high-fat high-sucrose (HFHS) diet (Envigo Teklad diets       (Echo Medical Systems).
TD.08811) for 115 days before surgery and 40 days after
surgery and then euthanized.                                   Multiparameter Metabolic Assessment
                                                               Mice were monitored by the Promethion High-Definition
Lean Sham-Operated Controls for the HFHS Model                 Behavioral Phenotyping System (Sable Instruments) over
Male 70-day-old C57Bl/6OlaHsd mice were fed ad libitum         24 h after 24 h of habituation, as described previously (35).
a normal chow diet. Mice were operated at the age of 10
weeks and euthanized 21 days after surgery. Mice were          Oral Glucose Tolerance Test
fed ad libitum after surgery.                                  Mice were fasted for 6 h and were given D-glucose, 2 g/kg
                                                               body weight, by 18-gauge gavage needle (Fine Science
Lean Mouse Model                                               Tools 18061-50). Blood glucose was measured using
Male Hsd:ICR mice fed ad libitum normal chow were              Roche Accu-check Performa from the tail. The area under
operated at the age of 10 weeks and remained on ad libi-       the curve was calculated after subtracting the fasting glu-
tum normal chow diet. Mice were euthanized 12 days             cose level (36).
after surgery.
                                                               Terminal Blood Collection
C57/Bl6 Lean Mouse Model                                       Mice were anesthetized using a low dose of ketamine
Male C57BL/6JOlaHsd mice fed ad libitum on normal              HCl:xylazine (100 mg:8 mg/kg body wt). Glucose was first
chow were operated at the age of 14 weeks and remained         measured from the tail. The mice underwent laparotomy,
on ad libitum normal chow diet. Mice were euthanized 14        and the inferior vena cava (IVC) was exposed. A surgical
days after surgery.                                            endoscopic LIGACLIP 12-L (Ethicon) was placed on the
                                                               IVC superior to the renal vein. Blood was first collected
Surgery                                                        30 s later from the portal vein, then the suprahepatic
Surgical procedures were described previously (31). Briefly,    IVC, and finally from the aorta. Blood glucose levels were
mice were fasted overnight before surgery. Mice were anes-     measured in each location. Finally, glucose was measured
thetized using isoflurane, shaved, and locally disinfected. A   from the tail to assess anesthesia or procedure-induced
1.5-cm laparotomy was performed, and a large LIGACLIP          changes in blood glucose.
diabetes.diabetesjournals.org Schyr and Associates 2291
Histology were performed on the same data. Benjamini-Hochberg cor-
The liver was fixed overnight in formalin. Hematoxylin–eo- rection was used to correct for the multiple genes tested via
sin staining were performed as previously described (31). qPCR analysis.
Histological quantification was performed blindly. A
hepatic microsteatosis score was defined as 0 for no Data Resource and Availability
microsteatosis and 3 for abundant microsteatosis. The data sets generated during the current study are
available from the corresponding author upon reasonable
Insulin ELISA request.
Ultrasensitive mouse insulin ELISA (Crystal Chem 90082)
was used according to the manufacturer’s instructions. RESULTS
VSG- and WMS-Operated Mice Display Similar Weight
Glucagon ELISA
and Glycemic Profiles
A mouse glucagon ELISA kit (Crystal Chem 81518) was
Male mice, 9 weeks old, were fed the HFHS diet for 115
used according to the manufacturer’s instructions.
days and were then randomly assigned to VSG or WMS
groups (RESEARCH DESIGN AND METHODS). Two VSG mice did
Model for Hepatic Hormonal Clearance
not recover well from surgery and were removed from the
We assume linear clearance of hormones within the sinus-
study. The remaining mice were followed for 40 days after
oids from the periportal to the pericentral pole and ana-
surgery. There were no significant differences in weight
lyze the steady-state,
before surgery or once weight matching was achieved on
day 20 after surgery (Fig. 1A). At that time, mice had a
Hin ¼ 0:75Hportal 10:25Haorta :
similar fraction of fat mass (Fig. 1B). Respirometry analy-
oH oH sis showed no difference in the respiratory quotient, but
¼v aH H
ot ox a small increase in total energy expenditure was observed
aH
HIVC ¼ Hin e v L in WMS-operated mice that was associated with increased
v wheel running (Fig. 1C and D and Supplementary Fig. 1).
aH ¼ ln HIVC =Hin
L Nonfasting glucose levels did not differ between the
where v is the velocity in the liver lobule, H is hormone, groups (Fig. 1E). An oral glucose tolerance test showed
aH is the clearance rate, and L is the distance from the that VSG-operated mice experience a sharp increase in
periportal to pericentral poles. glucose levels 15 min after gavage, followed by a reduc-
Data were normalized to the average levels of tion in glucose, with no difference in the area under the
ln(HIVC /Hin) in sham-operated mice. We used aH = 0 curve (Fig. 1F and G). There was no difference in fasting
in cases where HIVC > Hin due to measurements blood glucose after 6-h fasting on day 40 after surgery
errors. (Fig. 1H).
RNA Extraction Hepatic Glucose Production Is Reduced in VSG-
A 30-mg liver biopsy specimen was taken during the sacri- Compared With WMS-Operated Mice
fice and directly frozen in liquid nitrogen. Tissue was minced We assessed hepatic glucose production directly in fasting
and homogenized using TRI reagent (Sigma-Aldrich T9424) animals by measuring glucose levels in the blood vessels
according to the protocol, and ethanol was precipitated feeding and draining the liver. Because the hepatic veins
using ammonium acetate for additional purification. Then, 1 draining the liver in mice are very small, we ligated the
mg of RNA was reverse transcribed using an iScript cDNA IVC above the renal junction in an anesthetized mouse
synthesis kit (Bio-Rad cat. no. 1708890). cDNA was diluted (Fig. 2A). We waited 30 s and then measured blood glu-
and quantitative (q)PCR was done using iTaq Universal cose levels in the suprahepatic IVC below the diaphragm
SYBR Green Supermix (Bio-Rad cat. no. 1725124). The (Fig. 2B). At this time, blood in the IVC is predominately
DDCt method was applied to calculate fold-change expres- supplied from the liver. We then exposed the portal vein
sion. qPCR results were normalized to the expression of and measured blood glucose levels (Fig. 2C) and finally
mTbp and Hprt. The primers for qPCR analysis are provided measured glucose in the descending abdominal aorta (Fig.
in Supplementary Table 1. 2D). This terminal procedure lasted 2 min, and the blood
collection strategy is summarized in Fig. 2E. Ketamine-
Statistical Analyses xylazine anesthesia can increase blood glucose levels (37).
Data are shown as box-and-whisker plots or bar plots. In To control for this effect, we dosed the anesthesia such
bar plots, error bars denote the SE. One- or two-way that glycemia would be stable throughout blood collection
repeated-measures ANOVA with the Tukey honestly signifi- and compared blood glucose levels measured from the tail
cant difference (HSD) or Student t test were performed to before laparotomy and after collection from the aorta in
determine statistical significance as indicated in the text. VSG-, WMS-, and lean sham (LS)-operated mice that were
The Bonferroni correction was applied when multiple tests fed ad libitum with normal chow for 40 days after surgery2292 Sleeve Gastrectomy Increases Insulin Clearance Diabetes Volume 70, October 2021
A B C D
E F G H
Figure 1—Weight, glycemia, and metabolic parameters of mice following VSG or WMS. A: Body weight of VSG mice (n = 14) and WMS
mice (n = 16). Shaded areas denote standard error. Surgery day is denoted as day 0. VSG mice weighed less than WMS-operated mice
from days 3 to 18. Percentage of body fat mass (B), respiratory quotient (C), and total energy expenditure (TEE) (D) of VSG and WMS-oper-
ated mice performed 20 days after surgery (n = 4 per group). E: Nonfasting morning blood glucose. F: Oral glucose tolerance test per-
formed 22 days after surgery (n = 8 per group). G: Area under the curve (AUC) for the oral glucose tolerance test. H: Blood glucose levels
after 6-h fasting 40 days after surgery. *P < 0.05, **P < 0.01. A, E, and F: Two-way repeated-measures ANOVA, followed by the Tukey
HSD post hoc test. B–D, G, and H: Student t test.
(Fig. 2F). Mice in which this difference was >40 mg/dL aorta, portal vein, hepatic IVC, and the tail tip were lower
were excluded from the analysis. in LS compared with VSG and WMS (Fig. 3A–D). There
Using the strategy described above, we measured glu- was no difference in blood glucose levels between VSG
cose levels in the hepatic IVC, portal vein, and aorta in and WMS in the aorta, portal vein, or tail tip (Fig. 3A, B,
VSG, WMS, and LS-operated mice. Glucose levels in the and D). In contrast, the suprahepatic IVC glucose level of
A B E F
C D
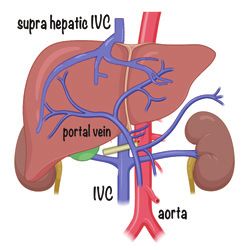
Figure 2—A–D: Intraoperative views show collection of blood from vessels feeding and draining the liver (scale bar = 2 mm). A: Ligation of
the IVC above the kidneys. Kidney marked with K, liver with L. Yellow arrow points to the IVC below the kidneys. B: The suprahepatic IVC
is marked with a yellow arrow. The liver with L, and the diaphragm with D. C: Portal vein, marked with a yellow arrow. D: Aorta, marked
with a yellow arrow. E: Schematic representation of blood glucose measurement procedure. Ligation of the IVC above the renal vein is
indicated. F: Differences in tail tip blood glucose levels during anesthesia, between the same mouse prelaparotomy and after aortic blood
collection in VSG (n = 12), WMS (n = 15), and LS (n = 10). No significant difference was found using one-way ANOVA.diabetes.diabetesjournals.org Schyr and Associates 2293
A B C D
portal vein aorta supra-hepac IVC tail p
* ** ** *
ns ** ns ** * ** ns **
glucose [mg/dL]
VSG WMS LS VSG WMS LS VSG WMS LS VSG WMS LS
E ns
* ns
GlucoseLiver[mg/dL]
VSG WMS LS
Figure 3—A–D: Glucose levels in blood vessels feeding and draining the liver in VSG- WMS-, and LS-operated mice. Glucose levels in the
portal vein (A), aorta (B), suprahepatic IVC (C), and tail tip (D) in mice that underwent VSG (n = 12), WMS (n = 15), or LS (n = 10). E:
DGlucoseLiver in each experimental group. *P < 0.05, **P < 0.01. One-way ANOVA was performed in A–D and the Bonferroni method was
applied to control for false positives (q < 0.05). Tukey HSD post hoc test was performed in each case.
WMS mice was elevated compared with VSG (Fig. 3C). Assuming again that 75% of the blood feeding the
Blood glucose levels of LS-operated mice were lower in all liver is supplied by the portal vein. Using this calcula-
blood vessels than in VSG- and WMS-operated mice. We tion, we found that nearly 45% of the insulin is
assessed the hepatic glucose production as the difference in removed in the livers of WMS mice. Strikingly, the liv-
blood glucose entering and leaving the liver by calculating: ers of VSG-operated mice removed 70% of the incom-
DGlucoseLiver ¼ GSuprahepaticIVC 0:75Gportal 10:25Gaorta ing insulin, pointing to an increase in hepatic insulin
clearance in the livers of VSG mice (Fig. 4C). We mod-
DGlucoseLiver was significantly lower by 55 mg/dL in eled hepatic insulin clearance (RESEARCH DESIGN AND METH-
the VSG than in the WMS group (Fig. 3E). There was no ODS) and estimate that the insulin clearance rate is
difference in DGlucoseLiver between LS and the WMS or twofold higher in VSG compared with WMS-operated
between LS and VSG groups (Fig. 3E). Assuming that the mice (Fig. 4E). qPCR analysis of genes associated with
contribution of the portal vein to total hepatic input was insulin clearance showed a significant increase in the
80% or 70% did not affect the results qualitatively.
transcript levels of Ide1, Ceacam1, and Prcke. There was
a significant increase in the mRNA levels of exon 19
Fractional Hepatic Insulin Clearance Is Increased in
VSG-Operated Mice
and exon 11 of Insr. Exon 19 is transcribed in both iso-
We were able to collect sufficient plasma from the supra- forms of the insulin receptor, and exon 11 is tran-
hepatic IVC, aorta, and portal vein to measure insulin lev- scribed only in isoform B of the insulin receptor. There
els in VSG- and WMS-operated mice. The insulin levels of was no difference in the levels of Irs1 and Igf1r in WMS
the two groups were similar in the suprahepatic IVC and and VSG mice (Fig. 4F).
the aorta but were higher in the portal vein of VSG- com-
pared with WMS-operated mice (Fig. 4A–C). We defined Lower Grade of Hepatic Steatosis in VSG- Compared
the hepatic fractional insulin clearance (FIC) by: With WMS-Operated Mice
We analyzed livers of VSG and WMS sacrificed 40 days after
InsSuprahepaticIVC surgery. Even though the weight was equivalent in both
FIChepatic ¼1
0:75Insportal 10:25Insaorta groups, hepatic steatosis was less prevalent in VSG-2294 Sleeve Gastrectomy Increases Insulin Clearance Diabetes Volume 70, October 2021
Fractional Hepatic Insulin Uptake Is Increased in Lean
A B C VSG-Operated Mice
Greater fractional hepatic insulin uptake following VSG
can be attributed to the improvement of hepatic steatosis,
to a response to VSG, or restricted feeding. We performed
VSG or sham surgery on normoglycemic CD1 male mice
consuming a normal chow diet. LS- and lean VSG (LVSG)-
operated mice had similar weight and glucose levels 12
D E days after surgery (Fig. 6A and B). We collected blood
from the suprahepatic IVC, descending aorta, and portal
vein as before.
Insulin levels in the portal vein of LVSG mice were
higher than those of LS-operated mice, while insulin lev-
els in the suprahepatic IVC and aorta were not different
F (Fig. 6C–E). Correspondingly, hepatic FIC was higher in
the LVSG-operated group (Fig. 6F and G). Insulin levels
and clearance were low, as expected during fasting in lean
mice. Glucagon levels were significantly higher in the por-
tal vein, aorta, and suprahepatic IVC of LVSG-operated
mice. Yet, there was no difference in hepatic fractional
glucagon uptake or normalized clearance rate between the
Figure 4—A–C: Hepatic fractional insulin clearance in VSG- or two experimental groups (Fig. 6H–L).
WMS-operated mice A–C. Insulin levels in the portal vein (A), aorta Finally, we repeated the experiment on 14-week-old
(B), and suprahepatic IVC (C) in VSG- and WMS-operated mice fed C57Bl6 male mice fed a normal chow diet. In this case,
the HFHS diet. D: Hepatic fractional insulin clearance in VSG- and
WMS-operated mice. E: Normalized insulin clearance rate in VSG-
LVSG mice weighed 2 g less than LS mice 2 weeks after
and WMS-operated mice. F: Log2 fold-change in the expression of surgery, with no significant difference in fasting glucose
genes associated with insulin uptake or clearance. *P < 0.05 by levels. As with the CD1 mice and HFHS-fed C57Bl6 mice,
Student t test (VSG, n = 4; WMS, n = 4) in A–E; *P < 0.05 by Stu- we detected an increase in portal insulin levels and an
dent t test and Benjamini-Hochberg correction in F (VSG, n = 7;
WMS, n = 10). increase in insulin clearance. Glucagon levels were higher
in the portal vein, aorta, and suprahepatic IVC of LVSG
mice, with no difference in hepatic glucagon clearance.
compared with WMS-operated mice, with a reduction in
both large lipid droplets and degree of microsteatosis (Fig. DISCUSSION
5A–D). We did not detect inflammation or fibrosis in both VSG was shown to increase hepatic insulin sensitivity,
groups. reduce hepatic glucose production, and increase insulin
A B C
D
Figure 5—Hepatic steatosis in VSG- and WMS-operated mice hematoxylin-eosin (H&E) staining of the liver of mice that underwent VSG (A)
or WMS (B). A’-A’’, B’-B’’ are high magnifications of VSG- or WMS-operated mice. Scale bar = 100 mm for low magnification, 25 mm for high
magnification. Full red arrowheads point toward large lipid droplets (diameter >20 mm), which are nearly absent from VSG-operated mice.
Empty arrowheads point toward small lipid droplets, which are abundant in WMS-operated mice but can be detected in VSG as well. C:
Average number of large lipid droplets per 1 mm2. D: Average score of microsteatosis. VSG, n = 10; WMS, n = 14 in C and D. *P < 0.05.diabetes.diabetesjournals.org Schyr and Associates 2295
A B
body weight [g]
fasng glucose
[mg/dL]
LVSG LS LVSG LS
Portal vein Aorta Suprahepac IVC
C D E F G p=0.1
normalized insulin
* *
clearance
hepac fraconal
insulin clearanc
clearance rate
insulin [ng/mL]
LVSG LS LVSG LS LVSG LS LVSG
LLVSG LS LVSG LS
H I J K L
normalized glucagon
* * *
glucagon clearance
hepac fraconal
glucagon [pg/mL]
clearance rate
LVSG LS LVSG LS LVSG LS LVSG
LLVSG LS LVSG LS
Figure 6—Fractional insulin and glucagon uptake in LS and LVSG-operated mice in A and B. Weight (A) and fasting glucose levels of (B)
LVSG- and LS-operated mice 12 days after surgery. Insulin levels in the portal vein (C), aorta (D), and suprahepatic IVC (E) in LVSG-
and LS-operated mice. F: Hepatic fractional insulin clearance in LVSG- and LS-operated mice. G: Normalized hepatic insulin clear-
ance rate in LVSG- and LS-operated mice. LVSG, n = 5; LS, n = 8 in A–G. Glucagon levels in the portal vein (H), aorta (I), and suprahe-
patic IVC (J) in LVSG- and LS-operated mice. K: Hepatic fractional glucagon clearance in LVSG- and LS-operated mice. L: Normalized
glucagon clearance rate in LVSG- and LS-operated mice. LVSG, n = 5; LS, n = 4 in H–L. *P < 0.05. Bonferroni method was applied to
control for false positives (q < 0.05).
clearance in patients (24,25). These results may be exp- glucose levels and area under the curve following glucose
lained in part by weight loss that follows surgery, leading challenge are similar following VSG or food restriction
to improvement in hepatic steatosis and reduction in the (40), but the dynamics of glucose and underlying regula-
level of obesity-associated systemic inflammation. Insulin tion are different. We further show that an increase in
clearance was also shown to be affected by diet (20). Here portal insulin and hepatic insulin clearance is observed in
we provide evidence that changes in hepatic steatosis, two strains of lean mice. Together, these results show
insulin clearance, and hepatic glucose production stem that VSG itself affects insulin metabolism and hepatic
also from VSG per se, while diet and weight loss are con- physiology, independent of weight loss, in obese and lean
trolled (12,38,39). animals, under different diets, and in several mouse
We have previously shown using hyperinsulinemic- strains.
euglycemic clamps that glucose production is repressed Our results are in line with previous rodent studies
after VSG in obese db/db mice even though these mice that have shown that VSG has weight loss-independent
remain obese after surgery (31). Our findings here sup- effects that contribute to glucose homeostasis. VSG leads
port and expand these findings using different methods to enhanced insulin and glucagon secretion in vivo and ex
and models. We show using a dietary obesity model that vivo (41), increases secretion of gastrointestinal hor-
even after controlling for weight loss, VSG is more effec- mones, and affects the gut microbiome and levels of bile
tive in reducing hepatic glucose production and hepatic acids and other effectors of glucose metabolism (42–45).
steatosis. Moreover, portal insulin levels and hepatic insu- This study contributes previous knowledge by taking an
lin clearance are higher following VSG. These results are anatomical approach with a focus on the liver and by ana-
obtained directly by measuring glucose and insulin levels lyzing obese and lean mice to directly measure surgically
entering and leaving the liver under fasting conditions induced changes in glucose and insulin metabolism in
and not during a hyperinsulinemic clamp. Notably, fasting vivo.2296 Sleeve Gastrectomy Increases Insulin Clearance Diabetes Volume 70, October 2021
WMS mice fed an HFHS diet had higher hepatic glu- insulin signaling, as reflected by lower glucose production
cose production than VSG-operated mice. There was no in HFHS, mice may drive the increase in hepatic insulin
difference in glucose levels in the aorta, portal vein, or clearance, which results in comparable levels of insulin out-
tail tip between VSG- and WMS-operated mice, suggesting side the liver in VSG- and WMS-operated mice. We con-
an increase in glucose utilization in WMS mice, which clude that surgery, diet, and a reduction in hepatic
may correspond to the higher total energy expenditure in steatosis all contribute to an increase in hepatic insulin
WMS-operated mice and a trend toward more wheel-run- clearance.
ning activity. We did not find evidence for induction of Glucagon levels were higher in all three blood pools in
intestinal gluconeogenesis in VSG mice, which was lean mice that underwent VSG. An elevation in peripheral
reported in Roux-en-Y gastric bypass surgery in rodents plasma glucagon levels following VSG was reported in
(46,47). patients and rodents (23,41,44), yet the mechanism
Fasting insulin levels are not different between underlying this paradoxical increase is not understood.
patients who had bariatric surgery or consumed a drastic Insulin levels were increased only in the portal blood of
diet (48). We have obtained similar results in both normal lean VSG-operated mice, and accordingly, insulin but not
chow- and HFHS-fed mice models. However, we did glucagon clearance was elevated following VSG. VSG
detect an increase in insulin levels in the portal vein in therefore leads to an increase in portal insulin and gluca-
both lean models and the HFHS mouse model after VSG. gon and exposes the liver to a different endocrine envi-
Fasting insulin levels were higher in HFHS-fed mice com- ronment than sham-operated mice.
pared with lean mice of the same strain fed normal chow An important limitation of our study is that blood col-
in both surgical groups as HFHS-fed mice display some lection was performed during anesthesia, which affects
hepatic steatosis and have increased adiposity compared
glycemia (37), and the procedure itself can activate neuro-
with chow-fed mice.
nal and hormonal signaling that increase hepatic glycemic
The total and fractional insulin clearance and normal-
control. While we verified that glucose levels were stable
ized clearance rate were increased in mice fed the HFHS
during blood collection, they were high in all groups of
diet that underwent VSG compared with WMS-operated
mice and in all blood pools.
mice. This increase was accompanied by a decrease in
Because VSG surgery is accompanied by a drastic
hepatic steatosis and hepatic glucose production. We also
weight loss and change of diet in patients, it is difficult to
observed an increase in the mRNA levels of genes associ-
decouple the effects of surgery from those of weight loss
ated with insulin clearance: Insr, Ceacam1, Ide, and Prkce.
and changes in hepatic steatosis. In this study, we used a
In a previous study, the hepatic expression of the A iso-
form of Insr was reduced after gastric bypass surgery in mouse model of VSG to show directly that VSG reduces
patients with T2D (49). In our data, the total and the B hepatic steatosis and glucose production and increases
isoform were elevated to the same extent after surgery. insulin clearance compared with weight and diet-matched
These differences may be attributed to differences in sur- sham-operated mice. We therefore propose that the new
gery type, species, and weight matching, which was not anatomy, which affects hormonal signaling, has a positive
possible in the human study. Ide is an important enzyme effect on hepatic metabolism beyond weight loss. Under-
for the intracellular transport of the insulin-Insr complex, standing the mechanisms underlying metabolic improve-
degradation of insulin, and recycling of Insr (50,51). This ments after bariatric surgery may offer new modalities to
process is regulated by phosphorylation of Ceacam1 (8). treat obese and lean patients suffering from hepatic stea-
Inhibition of hepatic protein kinase Ce (PKCe), encoded tosis and T2D.
by Prkce, was shown to reduce insulin clearance, and upre-
gulation of this kinase may contribute to the observed Funding. This study was supported by H2020 European Research Council
enhanced insulin clearance (52). An elevation in Prkce, Starting Grant (803526) awarded to D.B.-Z. and an Israel Science Foundation
Ceacam1, Insr, and Ide levels may explain the observed (ISF) grant (158/18) to J.T. D.B.-Z. is a Zuckerman STEM faculty fellow.
increase in insulin clearance (5,49,53,54). Histologically, Duality of Interest. No potential conflicts of interest relevant to this
there were fewer lipids droplets in the liver of VSG- com- article were reported.
pared with WMS-operated mice, despite the same weight Author Contributions. R.B.-H.S., A.A.-K., B.M., A.P., H.I., A.B., Y.A.,
and glycemia. L.H., M.B., A.H., S.A., I.M., and D.B.-Z. performed the experiments. R.B.-H.S.,
Improvement in insulin clearance can be attributed to B.M., A.P., J.T., and D.B.-Z. analyzed the data. R.B.-H.S., R.G., and D.B.-Z.
an improvement in hepatic steatosis following VSG or a conceived the study. R.B.-H.S. and D.B.-Z. wrote the manuscript. J.T. edited
hepatic adaptation to restricted feeding imposed by weight the manuscript. D.B.-Z. is the guarantor of this work and, as such, had full
matching. Insulin clearance, however, was increased in lean access to all the data in the study and takes responsibility for the integrity of
VSG-operated mice compared with LS-operated mice fed the data and the accuracy of the data analysis.
ad libitum, indicating that the new anatomy imposed by Prior Presentation. Parts of this study were presented as an abstract
VSG may lead to an increase in hepatic insulin clearance. at the 57th Annual Meeting of the European Association for the Study of
The increase in portal insulin levels and possibly higher Diabetes, 27 September–1 October 2021.diabetes.diabetesjournals.org Schyr and Associates 2297
References 24. Roslin MS, Dudiy Y, Weiskopf J, Damani T, Shah P. Comparison
between RYGB, DS, and VSG effect on glucose homeostasis. Obes Surg
1. Petersen MC, Vatner DF, Shulman GI. Regulation of hepatic glucose
2012;22:1281–1286
metabolism in health and disease. Nat Rev Endocrinol 2017;13:572–587
25. Mallipedhi A, Prior SL, Barry JD, Caplin S, Baxter JN, Stephens JW.
2. Arble DM, Sandoval DA. CNS control of glucose metabolism: response to
Temporal changes in glucose homeostasis and incretin hormone res-
environmental challenges. Front Neurosci 2013;7:20
ponse at 1 and 6 months after laparoscopic sleeve gastrectomy. Surg
3. Fisher SJ, Kahn CR. Insulin signaling is required for insulin’s direct and
Obes Relat Dis 2014;10:860–869
indirect action on hepatic glucose production. J Clin Invest 2003;111:463–468
26. Liou AP, Paziuk M, Luevano JM Jr, Machineni S, Turnbaugh PJ, Kaplan
4. TeSlaa T, Bartman CR, Jankowski CSR, et al. The source of glycolytic
LM. Conserved shifts in the gut microbiota due to gastric bypass reduce host
intermediates in mammalian tissues. Cell Metab 2021;33:367–378.e5
weight and adiposity. Sci Transl Med 2013;5:178ra41
5. Bojsen-Møller KN, Lundsgaard AM, Madsbad S, Kiens B, Holst JJ.
27. Breen DM, Rasmussen BA, Kokorovic A, Wang R, Cheung GW, Lam
Hepatic insulin clearance in regulation of systemic insulin concentrations-role
TK. Jejunal nutrient sensing is required for duodenal-jejunal bypass
of carbohydrate and energy availability. Diabetes 2018;67:2129–2136
surgery to rapidly lower glucose concentrations in uncontrolled diabetes.
6. Najjar SM, Perdomo G. Hepatic insulin clearance: mechanism and
Nat Med 2012;18:950–955
physiology. Physiology (Bethesda) 2019;34:198–215
28. Dimitriadis E, Daskalakis M, Kampa M, Peppe A, Papadakis JA,
7. Duckworth WC, Bennett RG, Hamel FG. Insulin degradation: progress and
Melissas J. Alterations in gut hormones after laparoscopic sleeve gas-
potential. Endocr Rev 1998;19:608–624
trectomy: a prospective clinical and laboratory investigational study. Ann
8. Poy MN, Yang Y, Rezaei K, et al. CEACAM1 regulates insulin clearance in
Surg 2013;257:647–654
liver. Nat Genet 2002;30:270–276
29. Rubino F, Forgione A, Cummings DE, et al. The mechanism of
9. Samuel VT, Shulman GI. The pathogenesis of insulin resistance: integrating
diabetes control after gastrointestinal bypass surgery reveals a role of the
signaling pathways and substrate flux. J Clin Invest 2016;126:12–22
proximal small intestine in the pathophysiology of type 2 diabetes. Ann
10. Birkenfeld AL, Shulman GI. Nonalcoholic fatty liver disease, hepatic
Surg 2006;244:741–749
insulin resistance, and type 2 diabetes. Hepatology 2014;59:713–723
30. Baud G, Daoudi M, Hubert T, et al. Bile diversion in Roux-en-Y
11. Jelenik T, Kaul K, Sequaris G, et al. Mechanisms of insulin resistance in
gastric bypass modulates sodium-dependent glucose intestinal uptake.
primary and secondary nonalcoholic fatty liver. Diabetes 2017;66:2241–2253
Cell Metab 2016;23:547–553.
12. Bril F, Lomonaco R, Orsak B, et al. Relationship between disease
31. Abu-Gazala S, Horwitz E, Ben-Haroush Schyr R, et al. Sleeve gastrectomy
severity, hyperinsulinemia, and impaired insulin clearance in patients with
improves glycemia independent of weight loss by restoring hepatic insulin
nonalcoholic steatohepatitis. Hepatology 2014;59:2178–2187
sensitivity. Diabetes 2018;67:1079–1085
13. Samuel VT, Liu ZX, Qu X, et al. Mechanism of hepatic insulin resistance
32. Chaudhari SN, Luo JN, Harris DA, et al. A microbial metabolite
in non-alcoholic fatty liver disease. J Biol Chem 2004;279:32345–32353
remodels the gut-liver axis following bariatric surgery. Cell Host Microbe
14. Sj€ostr€om L. Review of the key results from the Swedish Obese Subjects
2021;29:408–424.e7
(SOS) trial–a prospective controlled intervention study of bariatric surgery. J
33. Ben-Zvi D, Meoli L, Abidi WM, et al. Time-dependent molecular
Intern Med 2013;273:219–234 responses differ between gastric bypass and dieting but are conserved across
15. Froylich D, Corcelles R, Daigle C, Boules M, Brethauer S, Schauer P. Effect species. Cell Metab 2018;28:310–323.e6
of Roux-en-Y gastric bypass and sleeve gastrectomy on nonalcoholic fatty liver 34. Ahrens M, Ammerpohl O, von Sch€onfels W, et al. DNA methylation analysis in
disease: a comparative study. Surg Obes Relat Dis 2016;12:127–131 nonalcoholic fatty liver disease suggests distinct disease-specific and remodeling
16. Laursen TL, Hagemann CA, Wei C, et al. Bariatric surgery in patients with signatures after bariatric surgery. Cell Metab 2013;18:296–302
non-alcoholic fatty liver disease–from pathophysiology to clinical effects. 35. Knani I, Earley BJ, Udi S, et al. Targeting the endocannabinoid/CB1
World Hepatol 2019;11:138–249 receptor system for treating obesity in Prader-Willi syndrome. Mol Metab
17. Rubino F, Nathan DM, Eckel RH, et al.; Delegates of the 2nd Diabetes 2016;5:1187–1199
Surgery Summit. Metabolic surgery in the treatment algorithm for type 2 36. Virtue S, Vidal-Puig A. GTTs and ITTs in mice: simple tests, complex
diabetes: a joint statement by international diabetes organizations. Diabetes answers. Nat Metab 2021;3:883–886
Care 2016;39:861–877 37. Saha JK, Xia J, Grondin JM, Engle SK, Jakubowski JA. Acute
18. Mingrone G, Panunzi S, De Gaetano A, et al. Bariatric surgery versus hyperglycemia induced by ketamine/xylazine anesthesia in rats: mec-
conventional medical therapy for type 2 diabetes. N Engl J Med 2012;366: hanisms and implications for preclinical models. Exp Biol Med (Maywood)
1577–1585 2005;230:777–784
19. Bojsen-Møller KN, Dirksen C, Jørgensen NB, et al. Early enhancements of 38. Utzschneider KM, Kahn SE, Polidori DC. Hepatic insulin extraction in
hepatic and later of peripheral insulin sensitivity combined with increased NAFLD is related to insulin resistance rather than liver fat content. J Clin
postprandial insulin secretion contribute to improved glycemic control after Endocrinol Metab 2019;104:1855–1865
Roux-en-Y gastric bypass. Diabetes 2014;63:1725–1737 39. Shah A, Holter MM, Rimawi F, et al. Insulin clearance after oral and
20. Lundsgaard AM, Sjøberg KA, Høeg LD, et al. Opposite regulation of intravenous glucose following gastric bypass and gastric banding weight loss.
insulin sensitivity by dietary lipid versus carbohydrate excess. Diabetes Diabetes Care 2019;42:311–317
2017;66:2583–2595 40. Yoshino M, Kayser BD, Yoshino J, et al. Effects of diet versus gastric
21. Muscelli E, Mingrone G, Camastra S, et al. Differential effect of weight loss on bypass on metabolic function in diabetes. N Engl J Med 2020;383:
insulin resistance in surgically treated obese patients. Am J Med 2005;118:51–57 721–732
22. Immonen H, Hannukainen JC, Iozzo P, et al. Effect of bariatric surgery on 41. Douros JD, Niu J, Sdao S, et al. Sleeve gastrectomy rapidly enh-
liver glucose metabolism in morbidly obese diabetic and non-diabetic patients. ances islet function independently of body weight. JCI Insight 2019;
J Hepatol 2014;60:377–383 4:e126688
23. Douros JD, Tong J, D’Alessio DA. The effects of bariatric surgery on islet 42. Saeidi N, Nestoridi E, Kucharczyk J, Uygun MK, Yarmush ML, Stylopoulos
function, insulin secretion, and glucose control. Endocr Rev 2019;40:1394–1423 N. Sleeve gastrectomy and Roux-en-Y gastric bypass exhibit differential2298 Sleeve Gastrectomy Increases Insulin Clearance Diabetes Volume 70, October 2021 effects on food preferences, nutrient absorption and energy expenditure in 48. Yoshino M, Kayser BD, Yoshino J, et al. Effects of diet versus gastric bypass obese rats. Int J Obes 2012;36:1396–1402 on metabolic function in diabetes. N Engl J Med 2020;383:721–732 43. Arble DM, Sandoval DA, Seeley RJ. Mechanisms underlying weight loss and 49. Besic V, Shi H, Stubbs RS, Hayes MT. Aberrant liver insulin receptor metabolic improvements in rodent models of bariatric surgery. Diabetologia 2015; isoform A expression normalises with remission of type 2 diabetes after 58:211–220 gastric bypass surgery. PLoS One 2015;10:e0119270 44. Nannipieri M, Baldi S, Mari A, et al. Roux-en-Y gastric bypass and 50. Tang WJ. Targeting insulin-degrading enzyme to treat type 2 diabetes sleeve gastrectomy: mechanisms of diabetes remission and role of gut mellitus. Trends Endocrinol Metab 2016;27:24–34 hormones. J Clin Endocrinol Metab 2013;98:4391–4399 51. Farris W, Mansourian S, Chang Y, et al. Insulin-degrading enzyme regulates 45. Jahansouz C, Staley C, Bernlohr DA, Sadowsky MJ, Khoruts A, Ikramuddin S. the levels of insulin, amyloid b-protein, and the b-amyloid precursor protein Sleeve gastrectomy drives persistent shifts in the gut microbiome. Surg Obes Relat intracellular domain in vivo. Proc Natl Acad Sci U S A 2003;100:4162–4167 Dis 2017;13:916–924 52. Schmitz-Peiffer C, Laybutt DR, Burchfield JG, et al. Inhibition of PKCepsilon 46. Troy S, Soty M, Ribeiro L, et al. Intestinal gluconeogenesis is a key factor improves glucose-stimulated insulin secretion and reduces insulin clearance. Cell for early metabolic changes after gastric bypass but not after gastric lap-band Metab 2007;6:320–328 in mice. Cell Metab 2008;8:201–211 53. Kahn CR, White MF. The insulin receptor and the molecular mechanism 47. Yan Y, Zhou Z, Kong F, et al. Roux-en-Y gastric bypass surgery sup- of insulin action. J Clin Invest 1988;82:1151–1156 presses hepatic gluconeogenesis and increases intestinal gluconeogenesis in 54. Payankaulam S, Raicu AM, Arnosti DN. Transcriptional regulation of INSR, a T2DM rat model. Obes Surg 2016;26:2683–2690 the insulin receptor gene. Genes (Basel) 2019;10:984
You can also read