Spatiotemporal Impact of Electric Vehicles in Mitigating Damages from Destructive Storms
←
→
Page content transcription
If your browser does not render page correctly, please read the page content below
Spatiotemporal Impact of Electric Vehicles in
Mitigating Damages from Destructive Storms
Jung Kyo Jung, Farnaz Safdarian, Jessica L. Wert, Diana Wallison, Thomas J. Overbye
Department of Electrical & Computer Engineering
Texas A&M University
College Station, Texas
{jjungkyo, fsafdarian, jwert, diwalli, overbye}@tamu.edu
Abstract—The impact of Electric Vehicles (EVs) on the grid
and the benefit of utilizing them as a source of energy to increase
the grid’s reliability and resilience in severe weather conditions
are shown in this study. This case study is the winter storm Uri
that happened in February 2021 in Texas and impacted a large
part of the United States. The studied grid is a realistic 7000-bus
electric grid on the Texas footprint to mimic the ERCOT system
without revealing confidential data. The results show that using
EVs as power sources can help avoid outages and the necessity
of load shedding in similar events.
Index Terms—Vehicle-to-grid, winter storms, load shedding,
power outages, grid reliability, renewable energy
I. I NTRODUCTION
Despite a decrease in overall new car sales in 2020, EV
Fig. 1. Global Passenger Car Sales [1]
sales increased globally by 39% over the previous year. It
is predicted that the sales of EVs will increase up to 30
million cars in 2028 and will include almost 50 percent of new
Texas (ERCOT), which distributes electricity to the majority
passenger car sales by 2030 [1]. Figure 1 shows the global sale
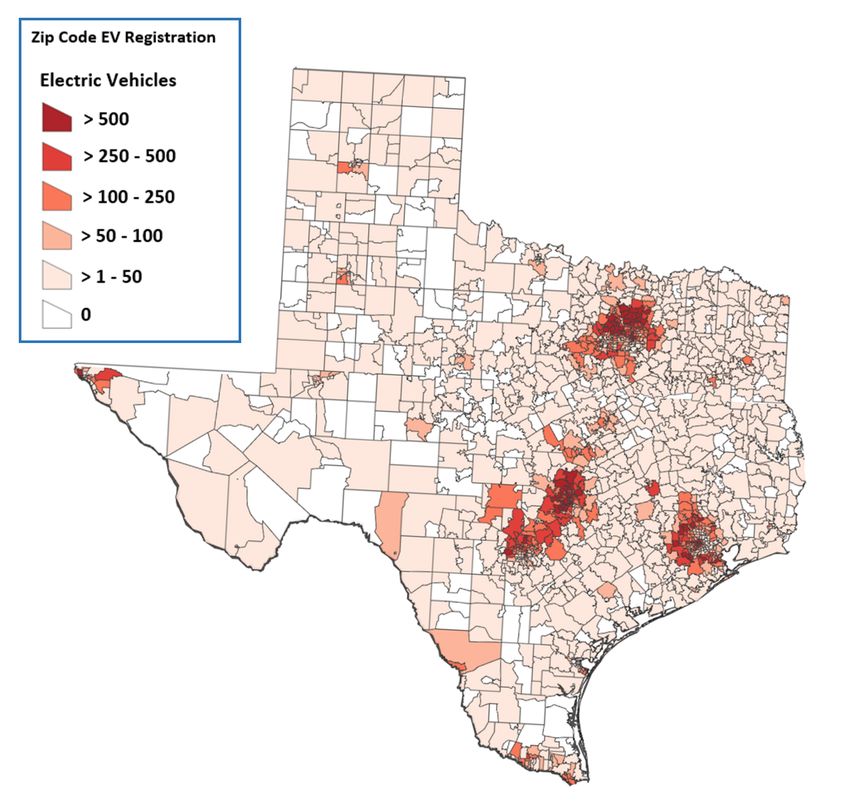
of Texas. During the winter storm Uri, the unexpectedly
of conventional cars and EVs from 2018 to 2030. According
low temperatures increased the electrical energy demand for
to this Figure, although the global passenger car sale faced
heating. According to the Federal Energy Regulatory Com-
several challenges in 2020, EVs have become more popular.
mission report [3], some generator turbines were frozen, and
It is estimated that the penetration of EVs of Texas in the
there was a shortage of natural gas reserves that caused a
United States grows to over 3.2 million by 2033 and the total
generation shortage compared to the load. Therefore, there was
energy capacity of EV energy storage is approximately 208
a necessity for load shedding to avoid a complete blackout of
GWh based on EV type including EV light-duty passenger
the ERCOT grid and keep the optimization problem (power
cars around 60 GWh, EV buses around 28 GWh, and EV
flow) solvable. Figure 2 shows the impact of the winter storm
Trucks around 120 GWh [2]. Furthermore, according to the
on Feb 15, 2021, in system frequency between 1 am and 2
kind of vehicle, EVs may store between 20 and 600 kWh of
am, which resulted in the necessity of load shedding. Because
energy in their batteries [2].
of the freezing weather and lack of heating energy, this process
One of the main objectives of power system operation
affected over 4.5 million households in Texas, causing more
and planning is to ensure that electrical power is provided
than 60 fatalities in over 20 counties of Texas and more than
reliably and that the power grid is resilient to severe weather
195,000 million dollars of damage [4]. If more energy storage
conditions. Several events present various challenges to the
capacity or EVs with the possibility of injecting power into
power system as they change the expected load and operation
the grid were available during this event, extreme mitigation
situation compared to the usual circumstances. For instance,
measures such as load shedding could be avoided. Reference
the Texas winter storm Uri on February 15-17, 2021, dam-
[5] studies how battery storage could reduce the damage
aged hundreds of thousands of customers and caused billions
caused by the Power Failure in Texas in February 2021.
of dollars in damage to the Electric Reliability Council of
Overall, with the increase in the penetration of renewable
Copyright ©2023 IEEE. Personal use of this material is permitted. However, resources and their dependency on the weather, as well as
permission to use this material for any other purposes must be obtained from the potential for extreme weather events caused primarily by
the IEEE by sending a request to pubspermissions@ieee.org. Presented at the
2023 IEEE Texas Power and Energy Conference (TPEC), College Station, global warming, there is a tendency toward increased usage
TX, February 2023. of battery storage in the electric grid to help in improving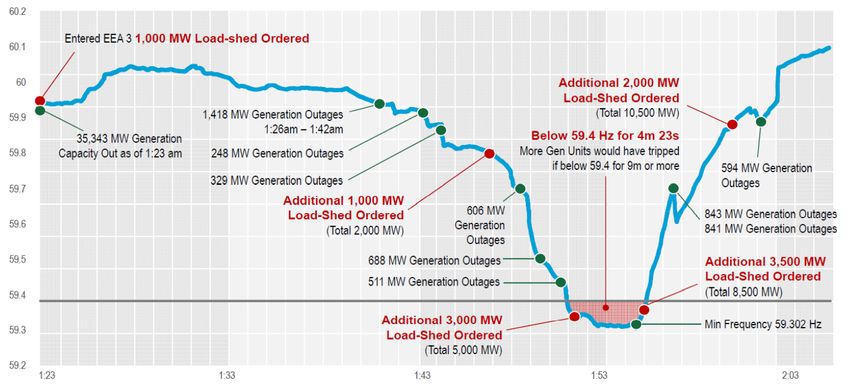
II. M ODELLING EV S IN THE G RID
                                                                   A. EV Modeling Strategy
                                                                      1) EV Charging Model: The linkage between transportation
                                                                   and the power system is the spatiotemporal charging demand.
                                                                   Considering the critical importance of a realistic charging
                                                                   pattern, we constructed a realistic charging demand strategy
                                                                   considering the original travel model for trip origins and
                                                                   destinations, a vehicle’s dynamic model for EV energy con-
                                                                   sumption, and used surveys on travel and charging behaviors.
                                                                   The estimated Travel Demand Model (TDM) and travel studies
              Fig. 2. Winter Storm - February 2021 [4]             run the EV charging simulation from [16]. TDMs consist
                                                                   of both the start-travel node (departure location) and the
                                                                   end-travel node (arrival location). In addition, they contain
                                                                   information such as total distances, operating time, and fuel
the grid’s reliability and resilience [6]. On the other hand,      consumption throughout a day in the regional transportation
as energy storage is a little expensive power source, it is        network. The network was created by urban traffic simulation
encouraging to use the capacity of EVs in times of emergency.      [17] and the traffic dynamics are generated by a simulator
Bidirectional EVs usage will reduce the need for costly            called Mobiliti [18].
stationary distributed energy storage. Vehicle-to-Grid (V2G)          To predict the in-transit power usage of EVs, the model
technology has been proposed as an area of research over           creates travel paths that it produces as output after taking
several years to use the capacity of EVs as the power source. It   the transportation system and traveling needs as inputs. A
can be beneficial for saving the power generated by renewable      subset of travel itineraries is selected randomly to become
energy resources in EV batteries and supplying electricity to      EV traveling utilizing a predetermined EV market share. It
the grid in an emergency [7]. References such as [8] and           is necessary to employ an activity-based EV model to analyze
[9] discuss the advantages and disadvantages of the V2G            how distinct transportation-related characteristics affect energy
system. The technical difficulties in bidirectional charging       consumption [19]. The next step is to estimate EV power
are discussed in reference [10]. Reference [11] reviews the        usage depending on the circumstances of in-transit operation
role of EVs as portable energy storage devices for power           using a parametric simulation inferences technique [20]. A
system resilience enhancement. Reference [12] shows that           Bayesian Network statistic modeling (BNSM) that accepts
both utilities and EV owners can benefit from V2G because          the industry experience beforehand and can be improved to
when its power transactions are performed, EV owners will be       utilize an information method is employed to describe the
compensated for using the energy stored in their cars while in     automobile powertrain. The specifics of its modeling and
idle mode. According to [13], which examines the effects of        verification are described in [20].
V2G on electric grid frequency management, transient stability        For a list of trips in the region, we simulated a specific
has also received interest in V2G technology and demonstrated      percentage for the penetration of different types of EVs and the
that EVs might be able to offer efficient frequency control.       model considering whether it is a 100, 200, or 300-mile range
   Studies like [14] believe that companies are reluctant to       EV. The range from each allocated EV in the network is picked
implement this technology due to the battery life reduction        according to the anticipated EV market penetration from EV
and increased anxiety of drivers of depleting the required         sales figures [21]. EVs having distances of 100, 200, and 300
charging. However, as EV batteries continue to improve,            miles each made up 25%, 13%, and 52% of the overall EV
this will be a less concerning issue. Ford company is one          fleet. The state of charge is then simulated for each travel at the
of the pioneers that implemented bidirectional EV chargers         beginning of a trip to evaluate if it needs to charge considering
[15]. In addition, Electric Power Research Institute (EPRI)        the available energy depending on the energy usage patterns
launched a research to assess the viability of integrating V2G     for EVs with various distances. It also estimates if this trip is
technology with mainstream car manufacturers, such as Fiat         the last trip of the day, based on model outputs, and assigns
Chrysler Automobiles and Honda Motor, who offered cars             home demand charging accordingly. The road linkage driving
with bidirectional power conversion systems [9].                   length and velocity discovered from the automobile itineraries
                                                                   were used to fit the energy usage rates per mile produced
   In this paper, the impact of Electric Vehicles (EVs) on the     from the EV models to each driving. Using the recharging
grid and the benefit of utilizing them as a source of energy to    needs modeling, the overall drive in road usage transformed
increase the grid’s reliability and resilience in severe weather   into recharging demands. Finally, a Monte Carlo strategy was
conditions are shown. This case study is the winter storm Uri      implemented to consider the uncertainties of the model.
that happened in February 2021 in Texas and impacted a large
part of the United States. The studied grid is a realistic 7000-   B. Mapping EV Charging Demand to the Electric Grid
bus grid on the Texas territory to emulate the ERCOT system          The results of transportation studies and the transportation
without releasing sensitive data.                                  simulation are the location and time series of EV charging.
The geographic coordinates of the grid’s substations and buses,
along with their latitudes and longitudes, are used to apply                                        |N |
                                                                                                    X
the recharging needs to the power network simulations to               PG,(g∈g(i)) − PD,i = |Vi |          |Vk |(GYik cosθik + Bik
                                                                                                                                Y
                                                                                                                                   sinθik )
include this information in the power system simulation. The                                        k=1
methodology to map the EV charging demand to electric grid                                                                               (2)
substations is explained in more detail in [22].
                                                                                                    |N |
                                                                                                    X
C. Load Time Series                                                   QG,(g∈g(i)) − QD,i = |Vi |           |Vk |(GYik sinθik − Bik
                                                                                                                                Y
                                                                                                                                   cosθik )
   The method described in [23] and [24] generates the 24-                                          k=1
                                                                                                                                         (3)
hour time series load data for each bus for one year. Consider-
ing load data of the time step, each bus’s physical locations are
                                                                                   Pmin,g ≤ PG,g ≤ Pmax,g              ∀g ∈ G            (4)
employed to specify a distinctive power usage profile for that
region. After that, an iterative aggregation method is used to
combine freely accessible building-level and facility-level load                  Qmin,g ≤ QG,g ≤ Qmax,g                ∀g ∈ G           (5)
time data to the buses. This method generates bus-level load
data by merging location prototype building and facility load
                                                                                    Vmin,i ≤ |Vi | ≤ Vmax,i           ∀i ∈ N             (6)
data every time with the concentration of resident, business,
and industry loads at each node in the system. The synthetic
load data each time are confirmed by applying the time series                         Pe2 + Q2e ≤ Smax,e
                                                                                                   2
                                                                                                                    ∀e ∈ E               (7)
of an authentic power system in [24].
                                                                         In the equations, the variables |V i| and |θi | stand in for the
   Once the load from each EV charging station is mapped to
                                                                      size and degree of the voltage at the i-th bus, respectively. The
its substation within the transmission system, the EV load time
                                                                      θik is the gap between the voltage degrees from the i-th bus to
series from Section II-A is represented as a load at the bus
                                                                      the k-th bus. The system’s representation of the fleet of buses
level within its assigned substation. The synthetic load data at
                                                                      is N , and the actual and reactive power demands at the i-th
the bus level is also updated to include this load.
                                                                      bus are PD,i and QD,i , respectively. Similarly, PG,g indicate
D. Vehicles to Grid Modeling                                          the g-th generator’s actual power, and QG,g reflect the g-th
                                                                      generator’s reactive power.
   The possibility of connecting EVs to the grid is modeled              In the system, the fleet of all generators is denoted by G.
as batteries at the end-of-trip locations of EV fleets where          The real and reactive value of the Y bus matrix is denoted
the vehicles are in parking and idle mode. The geographical           by its real component as GYik and Bik    Y
                                                                                                                 . (Pmin,g , Pmax,g ) as
coordinates of the start and end travel nodes are from TDMs,          real power and (Qmin,g , Qmax,g ) as reactive power show the
and if the travel distance is shorter than 40 miles it is assumed     generator operating limits by minimum and maximum. Bus
that EVs are not depleted and can be used as a source of              voltage operating limits are constrained by (Vmin,i , Vmax,i ).
power. For integrating this information into the electric grid,       The thermal limit, Smax,e , constrains the flow of power to each
the parking locations of EV fleets must be mapped to electric         bus of e, and it is connected to the flow of real and reactive
grid models with transmission-level substations by using a            power in (Eq. 7). The power flow on each bus is provided by
Voronoi diagram. The EV battery stations that EVs are parked          the power equations (Eq. 8) and (Eq. 9).
and they are in idle mode are allocated to the substation
connected to the location of end-travel nodes of EV fleets. The
EV battery stations are connected to the electric grid model              Pe = |Vi |2 GYik − |Vi ||Vk |(GYik cosθik + Bik
                                                                                                                       Y
                                                                                                                          sinθik )       (8)
as generators such as battery storage.

                III. T IME S TEP S IMULATION                             Qe = −|Vi |2 Bik
                                                                                       Y                Y
                                                                                          − |Vi ||Vk |(Bik cosθik − GYik sinθik )        (9)
A. AC Optimal Power Flow (OPF)                                        B. Direct Inclusion of Weather Data in OPF
   To calculate the steady-state outcomes in a power system              We have proposed a strategy in our previous work [26],
that minimizes the generation cost from Eq. 1, the ac OPF [25]        to map weather stations with electric grid generators, input
is employed. Coefficients (a, b, and c) that represent quadratic      time-dependent weather measurements such as wind speed,
cost curve elements of generators specify Fc (PG ):                   cloud coverage percentage, and temperatures directly into OPF
                                                                      modeling, and output the actual time-dependent capacities
                          |G|
                          X                                           of generators especially renewable generators based on the
         min Fc (PG ) =         [ag + bg PG , g + cg PG2 , g]   (1)
         PG                                                           weather. The renewable generators’ models are extracted from
                          g=1
                                                                      [27]. These models and input data are then used in a time-
  The power balancing equations (2, 3) have to be satisfied.          step simulation to update the actual capacities of generators
In addition, additional operational constraints from (Eq. 4) to       and find the output generation of renewable resources based
(Eq. 7) should be considered [25].                                    on the availability of renewable resources [26].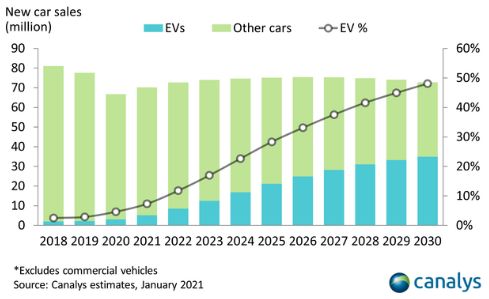
TABLE I
                  T EXAS S YNTHETIC G RID S TATISTICS

                    Parameter               Numerical Value
                       Buses                    6,717
                    Generators                   731
                       Loads                    5,095
                  Switched Shunts                634
                    Substations                 4,894
                 Transmission lines             7,173
               Maximum load (MW)               74,667
             Maximum generation (MW)           104,914

                                                                              Fig. 4. Geographical Data View of Load Substations in Peak Loads in the
                                                                              Texas Case Study

                                                                                 Figure 4 shows a geographical data view (GDV) of the load
                                                                              substations based on the strategy presented in [35], [36]. The
                                                                              main parameters of the case and the maximum load are shown
                                                                              in Table I. The oval’s size is related to the dimensions of the
                                                                              power stations.
                                                                              B. Scenarios
Fig. 3. The one-line diagram of transmission lines of the studied grid over      The studied scenarios in this paper include weather and load
Texas footprint. This grid is synthetic grid and is not real one.             data in February 15, 2021. The hourly load data at the bus level
                                                                              created in Section II-C is then scaled based on [3]. Weather
                                                                              models of generators in this paper are based on [26]. In Texas
                          IV. C ASE S TUDY                                    weather stations, hourly measurements such as temperatures,
                                                                              wind speed, wind direction, cloud coverage percentage, and
A. Grid Model                                                                 dew points are gathered from [37] and directly included in
   The grid, in this study, is a synthetic but realistic grid that            optimal power flow models to update the output and actual
covers the territory of Texas in the U.S. without disclosing                  capacities of generators, primarily renewable generators.
any Critical Energy/Electric Infrastructure Information (CEII).                  Two scenarios that are studied in this paper include:
This grid was developed using publicly accessible data, includ-                  • The Base case: Texas load on February 15, 2021
ing U.S. Census statistics [28] and information on generators                    • The V2G case: base case Texas load with the addition
from online in the Energy Information Administration (EIA)                          of the required EV charging demand a with 15% EV
[29]. The detailed strategy to create this grid is explained in                     penetration with V2G capability
[30] including assignment of substations, transmission lines                     Figure 5 shows that Dallas, Austin, and Houston are the
and reactive power control devices. All the planning for                      three major cities with the most EV registration in Texas. In
substations, transmission lines, and reactive power fall under                addition, from Fig. 4 the highest electricity demand is in these
the same procedure. Grids are created and verified using                      cities as both are related to the population distribution in Texas.
validation metrics, which are essential characteristics of real               As a result, if EVs in big cities are used as energy resources
grids [31], [32] to offer data sets that are realistic. The                   to the grid when an emergency case such as a Texas winter
availability of geographical data for system components is a                  storm Uri, they are very close to the electrical loads.
crucial component of these synthetic grids. This grid can be
available in [33]. The 7000-bus synthetic grid, seen in Fig. 3,                                           V. R ESULTS
includes the ERCOT [34] geographical territory. Bolded green                    Simulations are run by PowerWorld [39], Python and MAT-
lines show 345 kV transmission lines, 138 kV lines are shown                  LAB installed on an Intel(R) Xeon(R) CPU E5-1650 v4
in black, and 69 kV lines with light green.                                   @ 3.60GHz and RAM 64GB. After time step simulation is
Fig. 6. Voltage magnitude on February 15, 2021 with the base case
Fig. 5. Texas Electric Vehicle Registration Mapping [38]
applied in the base case with the impact of load and weather
but without including any EVs to solve AC OPF, there was
a convergence issue because of the voltage collapse at 1 pm
on February 15, 2021. The North of Texas had low voltage
issues below 0.9 per unit (p.u) in 165 buses as well as The
West of Texas resulted in high voltage problems above 1.1
p.u in 1747 buses. Overall 1912 buses had severe voltage
violation problems in this case because of a shortage in
generation compared to the load. In general, if generation is
lower than load in the real power grid, it would be a blackout
as the simulation shows the voltage collapse and the slack
bus provides a very large real and reactive power. In this
situation, ERCOT enforced load shedding several times to
avoid a general blackout all over this state.
Figure 6 shows a voltage contour of p.u voltage levels of
buses of this case based on the strategy mentioned in [40].
It should be noted that the generation, in this case, is lower
than the load and therefore this case goes to a blackout. After Fig. 7. Voltage magnitude on February 15, 2021 with EV15%
implementing the impact of EVs with the capability of energy
storage is mapped to the grid, although the overall demand is
increased by around 1.5 GW due to the EV charging demand, advantage of EVs as the power source in severe weather events
the available generation from EV batteries is also increased by is researched. The V2G capability is added to the grid at times
around 6 GW, so the AC OPF is solved and there is no major that EVs are parked and in an idle mode based on end-of-travel
voltage convergence issue in the system. Figure 7 depicts the geographic coordinates and if the duration of their previous
voltage contour of buses inside the Texas network following travel is rather short. The same charging capacity of EV fleets
the application of the effect of EVs with V2G capabilities. mapped to the grid assumes that 15% of light-duty cars in
Please note that in this case, it is assumed that only 15% of two cities of Texas are EVs with V2G capability. The main
the overall cars are EVs with V2G capability. weather measurements, such as wind speed, cloud coverage,
and temperatures of a winter storm called Uri in February
VI. C ONCLUSION AND F UTURE W ORK 2021 in Texas, are added as the input, and the capacities of
The hourly required demand to charge EVs in specific generators and outputs of renewable generators are updated
locations and times of the day is calculated based on travel as output based on specific generator models. Then, for a
patterns and then added to the hourly load of the studied scenario with bidirectional EVs, an ac OPF is solved. The
grid over the Texas footprint. Then the possibility of taking outcomes compared to the basic simulations with no EVs.The simulation outcomes demonstrate that although the basic [17] Urban traffic simulation: Network and demand represen-
scenario has a convergence issue and voltage collapse due to tation impacts on congestion metrics. [Online]. Available:
https://scholar.smu.edu/datasciencereview/vol5/iss2/8
high load and less available generation, the base case adding [18] C. Chan, B. Wang, J. Bachan, and J. Macfarlane, “Mobiliti: Scalable
15% EVs with V2G capabilities overcomes this issue. This transportation simulation using high-performance parallel computing,”
result indicates the advantage of using EVs as energy resources in 2018 21st International Conference on Intelligent Transportation
Systems (ITSC), 2018, pp. 634–641.
to increase the grid’s stability and resilience in the case of [19] X. Xu, H. A. Aziz, H. Liu, M. O. Rodgers, and R. Guensler, “A
some emergencies and the potential to save losses in millions scalable energy modeling framework for electric vehicles in regional
of dollars. transportation networks,” Applied Energy, vol. 269, p. 115095, 2020.
[20] X. Xu, H. A. Aziz, and R. Guensler, “A modal-based approach for esti-
mating electric vehicle energy consumption in transportation networks,”
ACKNOWLEDGMENT Transportation Research Part D: Transport and Environment, vol. 75,
pp. 249–264, 2019.
The research was partly supported by funding provided [21] “Map & Data - EV model Sales in the United States”. [Online].
by the U.S. National Science Foundation (NSF) in Award Available: https://afdc.energy.gov/data/
[22] J. L. Wert, K. S. Shetye, H. Li, J. H. Yeo, X. Xu, A. Meitiv, Y. Xu,
1916142, the U.S. Department of Energy (DOE) under and T. J. Overbye, “Coupled infrastructure simulation of electric grid
Award DE-OE0000895, the US ARPA-E Grant No. DE- and transportation networks,” in 2021 IEEE Power & Energy Society
AR0001366, and the Power Systems Engineering Research Innovative Smart Grid Technologies Conference (ISGT). IEEE, 2021,
pp. 1–5.
Center (PSERC). [23] H. Li, A. L. Bornsheuer, T. Xu, A. B. Birchfield, and T. J. Overbye,
“Load modeling in synthetic electric grids,” in 2018 IEEE Texas Power
R EFERENCES and Energy Conference (TPEC). IEEE, 2018, pp. 1–6.
[24] H. Li, J. H. Yeo, A. L. Bornsheuer, and T. J. Overbye, “The creation
[1] “Global car sales estimates”. [Online]. Avail- and validation of load time series for synthetic electric power systems,”
able: https://canalys.com/newsroom/canalys-global-electric-vehicle- IEEE Transactions on Power Systems, vol. 36, no. 2, pp. 961–969, 2020.
sales-2020 [25] A. Wood, B. Wollenberg, and G. Sheblé, Power Generation,
[2] “2018 ERCOT System Planning in Texas.”. [Online]. Available: Operation, and Control. Wiley, 2013. [Online]. Available:
http://www.ercot.com/files/docs/2018/12/21/ 2018 LTSA Report.pdf/ https://books.google.com/books?id=JDVmAgAAQBAJ
[3] “FERC—NERC—The Report in Region”. [Online]. Avail- [26] T. J. Overbye, F. Safdarian, W. Trinh, J. H. Yeo, Z. Mao, and J. Snod-
able: https://www.naesb.org/pdf4/ferc nerc regional entity staff report grass, “An approach for the direct inclusion of weather information in
Feb2021 cold weather outages 111621.pdf the power flow,” in Hawaii International Conference on System Sciences
[4] “ERCOT—Blackout—2021”. [Online]. Available: (HICSS), 2023.
https://energy.utexas.edu/sites/default/files/UTAustin%20%282021 [27] (2021) “United States EIA-860”. [Online]. Available:
%29%20EventsFebruary2021TexasBlackout%2020210714.pdf/ https://www.eia.gov/electricity/data/eia860/
[5] A. Menati and L. Xie, “A preliminary study on the role of energy storage [28] “Zcta gazetteer file.” 2019. [Online]. Available:
and load rationing in mitigating the impact of the 2021 texas power https://www.census.gov/geographies/reference-files/time-
outage,” in 2021 North American Power Symposium (NAPS). IEEE, series/geo/gazetteer-files.2019.htmllist-tab-WGX6046M8XT6UYUBXO
2021, pp. 1–5. [29] “U.s. energy information administration 860,” 2019. [Online]. Available:
[6] S. C. Johnson, D. J. Papageorgiou, M. R. Harper, J. D. Rhodes, http://https://www.eia.gov/electricity/data/eia860/
K. Hanson, and M. E. Webber, “The economic and reliability impacts [30] “A methodology for the creation of geographically realistic synthetic
of grid-scale storage in a high penetration renewable energy system,” power flow models,” in 2016 IEEE Power and Energy Conference at
Advances in Applied Energy, vol. 3, p. 100052, 2021. Illinois, PECI 2016, ser. 2016 IEEE Power and Energy Conference
[7] A. Alobaidi, H. DesRoches, and M. Mehrtash, “Impact of vehicle to grid at Illinois, PECI 2016. United States: Institute of Electrical and
technology on distribution grid with two power line filter approaches,” Electronics Engineers Inc., Apr. 2016.
in 2021 IEEE Green Technologies Conference (GreenTech), 2021, pp. [31] V. Krishnan, B. Bugbee, T. Elgindy, C. Mateo, P. Duenas, F. Postigo, J.-
163–168. S. Lacroix, T. G. S. Roman, and B. Palmintier, “Validation of synthetic
[8] M. Yilmaz and P. T. Krein, “Review of the impact of vehicle-to- u.s. electric power distribution system data sets,” IEEE Transactions on
grid technologies on distribution systems and utility interfaces,” IEEE Smart Grid, vol. 11, no. 5, pp. 4477–4489, 2020.
Transactions on power electronics, vol. 28, no. 12, pp. 5673–5689, 2012. [32] A. B. Birchfield, E. Schweitzer, M. H. Athari, T. Xu, T. J. Overbye,
[9] Open standards-based vehicle-to-grid: Value assessment, t. A. Scaglione, and Z. Wang, “A metric-based validation process to
epri, palo alto, ca: 2019. 3002014771. [Online]. Available: assess the realism of synthetic power grids,” Energies, vol. 10, no. 8,
https://www.epri.com/research/products/000000003002014771 2017. [Online]. Available: https://www.mdpi.com/1996-1073/10/8/1233
[10] F. Safdarian, L. Lamonte, A. Kargarian, and M. Farasat, “Distributed [33] [Online]. Available: https://electricgrids.engr.tamu.edu/
optimization-based hourly coordination for v2g and g2v,” in 2019 IEEE [34] Texas 7k. [Online]. Available:
Texas Power and Energy Conference (TPEC). IEEE, 2019, pp. 1–6. https://electricgrids.engr.tamu.edu/electric-grid-test-cases/datasets-
[11] J. Dugan, S. Mohagheghi, and B. Kroposki, “Application of mobile for-arpa-e-perform-program/
energy storage for enhancing power grid resilience: A review,” Energies, [35] T. J. Overbye, E. M. Rantanen, and S. Judd, “Electric power con-
vol. 14, no. 20, p. 6476, 2021. trol center visualization using geographic data views,” in 2007 iREP
[12] M. Yilmaz and P. T. Krein, “Review of benefits and challenges of Symposium-Bulk Power System Dynamics and Control-VII. Revitalizing
vehicle-to-grid technology,” in 2012 IEEE Energy Conversion Congress Operational Reliability. IEEE, 2007, pp. 1–8.
and Exposition (ECCE), 2012, pp. 3082–3089. [36] T. J. Overbye, J. L. Wert, K. S. Shetye, F. Safdarian, and A. B. Birchfield,
[13] W. Wang, X. Fang, H. Cui, F. Li, Y. Liu, and T. J. Overbye, “The use of geographic data views to help with wide-area electric
“Transmission-and-distribution dynamic co-simulation framework for grid situational awareness,” in 2021 IEEE Texas Power and Energy
distributed energy resource frequency response,” IEEE Transactions on Conference (TPEC). IEEE, 2021, pp. 1–6.
Smart Grid, vol. 13, no. 1, pp. 482–495, 2021. [37] “Weather Data”. [Online]. Available:
[14] J. Geske and D. Schumann, “Willing to participate in vehicle-to-grid www.weathergraphics.com/identifiers/
(v2g)? why not!” Energy Policy, vol. 120, pp. 392–401, 2018. [38] “Texas Electric Vehicle Mapping Tool”. [Online]. Available:
[15] “Ford releases the unexpectedly affordable bi- https://www.dfwcleancities.org/evsintexas/
directional residential charging system.”. [Online]. Available: [39] “PowerWorld Corporation ”. [Online]. Available: www.powerworld.com
https://twitter.com/ElectrekCo/status/1498654862669758465/ [40] J. D. Weber and T. J. Overbye, “Voltage contours for power system
[16] ”The Future of TDM”. [Online]. Available: visualization,” IEEE Transactions on Power Systems, vol. 15, no. 1, pp.
http://https://static.tti.tamu.edu/tti.tamu.edu/documents/PRC-15-25F.pdf/ 404–409, 2000.You can also read