SPECIAL 200th EDITION - The EUROCONTROL Industry Monitor
←
→
Page content transcription
If your browser does not render page correctly, please read the page content below

EUROCONTROL

SPECIAL 200th EDITION
  The EUROCONTROL Industry Monitor

Industry Monitor
The EUROCONTROL bulletin on air transport trends
Issue N°200. 14/02/2018
European flights hit a new record high in 2017 EUROCONTROL Statistics and Forecasts 1
with 10.6 million flights, finally paring the 2008
record of 10.2 million flights. Average daily Other Statistics and Forecasts 4
flights were 4.3% above the 2016 traffic levels.
Preliminary data for January 2018 show a 4.7% Passenger airlines 4
increase of flights on January 2017.
Amsterdam remained the busiest European Airports 8
airport in terms of IFR flights in 2017 with an
increase of 4% compared with 2016. Aircraft manufacturing 9
Oil prices averaged €49 per barrel in 2017 up
Cargo 9
from €41 per barrel in 2016. Brent crude
climbed to a monthly average of €56 per barrel
in January 2018, the highest since June 2015. Oil 10
Airline ticket prices were on average 3% more Economy 11
expensive in 2017 than 2016 partly linked to
rising oil prices. Fares 11
** In this 200th edition we continue to deliver your news, but turn to the back-page
to see how we reached our double century **
EUROCONTROL Statistics and Forecasts
With 10.6 million flights controlled in Europe (ECAC – European Civil Aviation Conference
area), 2017 hit a new record high, finally paring the 2008 record of 10.2 million flights. The
summer months (July, August and September) were the busiest ever recorded each
totalling more than one million flights. In 2017 as a whole, average daily flights in Europe
remained 4.3% above the 2016 traffic levels (Figure 1). Intense growth of flights in the
Russian Federation, owing to a faster economic recovery than initially anticipated; together
with busiest ever traffic levels in Europe during the summer (with June to October growing
faster than the forecast) contributed to the annual growth. Also to be noted was the
recovery of flights to North-African States (mostly Egypt). Traffic growth started to slow
down in November 2017 at the start of the winter schedule partly due to Ryanair cutting
capacity by flying fewer aircraft this winter in an attempt to avoid roster-related
cancellations. In December 2017, the growth rate slumped to 1.7% owing to Monarch
Airlines and Air Berlin both ceasing operations in October, followed by Niki in December.
Industry Monitor. Issue 200. 14/02/2018 Page 1 © EUROCONTROL 2018
Document Confidentiality Classification: White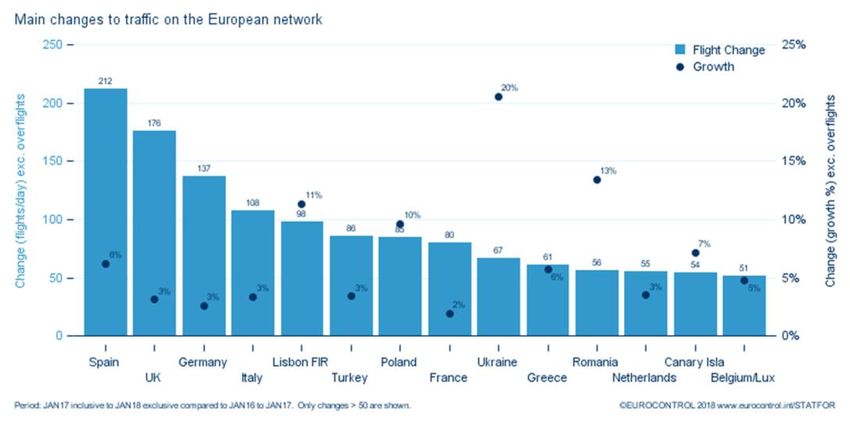
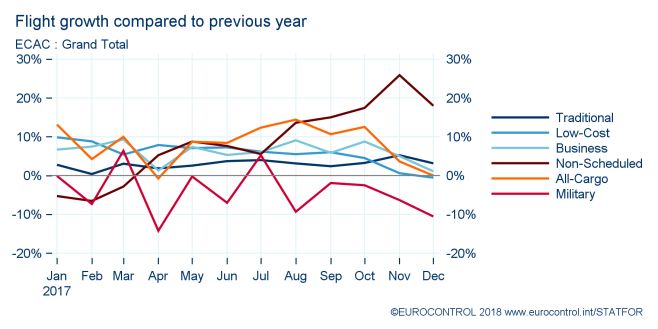
Figure 1: Monthly European Traffic and Forecast (based on the 7-year forecast Sep. 17).

Preliminary data for January 2018 show a 4.7% increase of flights on January 2017.

Traffic development by market segment in 2017
Although the low-cost segment remained the main driver of flight growth in 2017 (+485
flights per day on average), it lost its dominant position in terms of percentage growth in
favour of the charter and all-cargo segments which grew by 9.1% and 8% respectively
while low-cost increased by 5.7% in 2017 (vs. 2016) (Figure 2).

The low-cost segment grew consistently between 5% and 10% until September 2017 then
decelerated during the last quarter of the year from 4.5% in October to 0.6% in November
and -0.6% in December, impacted by the collapse of Monarch Airlines and Air Berlin, and
by Ryanair cutting capacity this winter by flying 25 fewer aircraft from November onwards
in an attempt to avoid roster-related cancellations.

The charter (commercial non-scheduled) segment had the fastest growth and recovered
from April 2017 owing to the recovery of Russian traffic growth, together with the growth of
Eastern European states, and the recovery of Egypt and Turkey as tourist destinations.
The charter segment recorded a double-digit increase since August 2017 with its
international arrival and departure flows surging to an annual increase of 32%.

The all-cargo segment boosted by a strong intra-Europe cargo market (+9% on 2016)
jumped to an overall growth rate of 8% in 2017 vs. 2016, but with widening seasonal
variation as the Summer growth reached 14% in August, while November and December
fell below 4%.

The business aviation segment reported its first year of traffic growth since 2011 and
recorded growth during each of the months in 2017 to reach an annual growth rate of
6.2%.

Traditional scheduled although still accounting for the largest share of the traffic, was the
weakest segment as it grew at an annual rate of 3% in 2017 (vs. 2016) although this was
its strongest growth rate for the last 10 years and grew even faster than low-cost in
November and in December 2017.

Military IFR was the only segment to decline in 2017 as it went down by 3.9% compared
with 2016 (EUROCONTROL, January).
Industry Monitor. Issue 200. 14/02/2018          Page 2                 © EUROCONTROL 2018
Document Confidentiality Classification: White
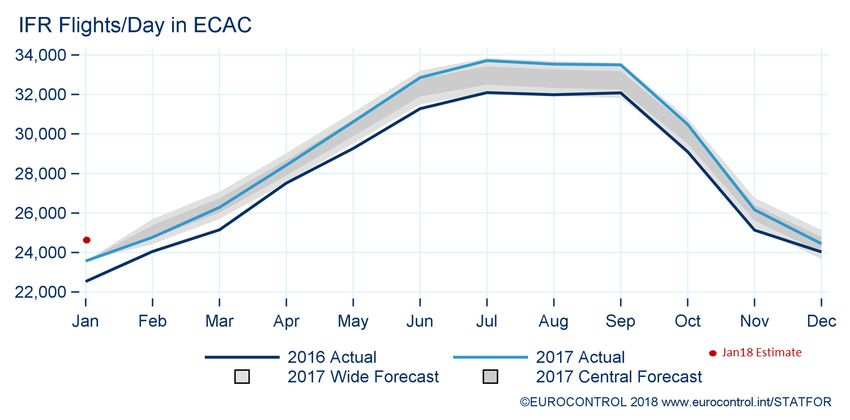
Figure 2: Traffic development by market segment in 2017.

Main contributors to traffic in Europe
Western European states remained the major contributors to the traffic growth in 2017
(excluding overflights). In 2017 the top five contributors to the network’s traffic growth
(Figure 3) were Spain (+212 daily flights), the United Kingdom (+176 daily flights), and
Germany (+137 daily flights) boosted by strong growth on flows within Western Europe.
Since September, the UK and German contributions declined on average compared to
what was mentioned in the September 2017 forecast report because of weaker traffic
(internal for Germany, arrivals-departures for the UK) due to the respective failures of Air
Berlin and Monarch. Across 2017, Italy added 108 daily flights, and Portugal (excluding
Azores) added 98 daily flights.

Ukraine’s local traffic (excluding overflights) was up 20% thanks to the state’s flows to
Egypt and to Turkey along with its Eastern European flow that remained strong.

Flows to and from Turkey have increased their average contribution to the European
network for 2017 to 86 extra daily flights owing mainly to the growth of the flow from the
Russian Federation (EUROCONTROL, January).

All-causes airline delays
Based on data from airlines for delays from all causes, the average departure delay per
flight increased by 3.3 minutes to 16.9 minutes in December 2017 compared with
December 2016 and was the highest delays recorded for the year due to the combined
increase of reactionary, airline, weather and airport delays. The percentage of delayed
flights on departure (>=5 minutes) was 51%, an increase of 4 percentage points when
compared to the same month in 2016 (Figure 4). Winter conditions on 10-11 December
affected the majority of North-West Europe with significant delays at London Heathrow,
Stansted and Luton, Amsterdam, Frankfurt, Brussels and Geneva airports
(EUROCONTROL, January).

Industry Monitor. Issue 200. 14/02/2018          Page 3                © EUROCONTROL 2018
Document Confidentiality Classification: White
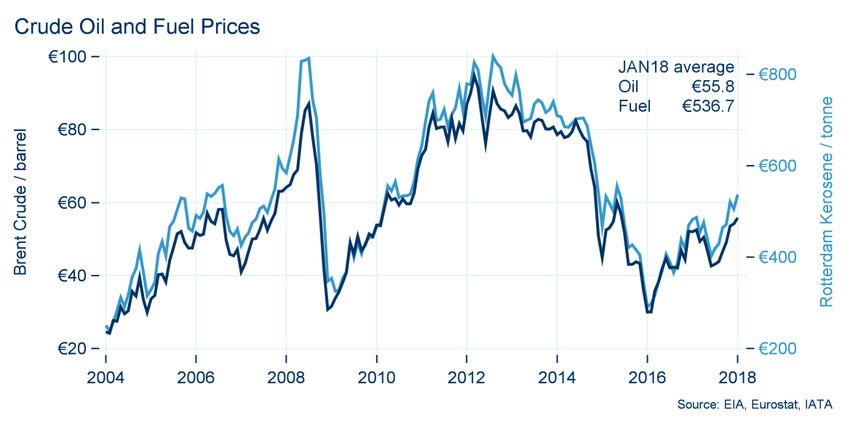
Figure 3: Main changes to traffic on the European network in 2017.

Other Statistics and Forecasts

IATA reported that European scheduled passenger traffic (RPK) increased by 8.2% in
2017 compared with 2016. Total capacity rose by 6.2% and the load factor surged to
83.9% (vs. 82.4% in 2016) and was the highest worldwide (IATA, 1 February).

ACI reported that overall passenger counts at European airports increased by 8.5% in
2017 compared with 2016 with overall aircraft movements growing by 3.8% (ACI Europe, 6
February).

Passenger airlines
Traffic Statistics: Year 2017 Update

Figure 5 and Figure 6 compare whole 2017 figures with whole 2016 figures for the main
European carriers. In addition to the number of passengers (PAX), passenger capacity is
measured in available seat kilometres (ASK), traffic is measured in revenue passenger
kilometres (RPK) and load factor as a percentage (%).

Industry Monitor. Issue 200. 14/02/2018          Page 4            © EUROCONTROL 2018
Document Confidentiality Classification: White
Breakdown of all-causes delay per flight
                                                       Percentage of flights delayed on departure

     Figure 4: Delay statistics (all-causes, airline reported delay – December 2017).

Capacity, costs and jobs

TUI Group is in the process of renewing its fleet and has 140 Boeing aircraft (122 B737
MAXs and 18 B737 MAX 10s) on order for its six subsidiaries in Germany, UK, the
Netherlands, Belgium, Sweden and France. Aircraft will be delivered by 2023 (TUI Group,
29 January).

easyJet plans to increase its fleet from currently 280 to more than 300 aircraft by spring
2018. More than half of its fleet will be Airbus A320 aircraft (among which 28 A321neo
aircraft) which can have up to 186 seats compared with the 150-seat configuration of its
Airbus A319 aircraft (easyJet, 4 January).

Air Baltic (Latvia) will recruit more than 100 pilots in 2018 to meet its route expansion (eight
new routes in 2018) and fleet increase from currently eight Bombardier CS300 aircraft to
20 units in 2019. In 2017 Air Baltic transported 22% more passengers than in 2016 (Air
Baltic, 3 February).

Lufthansa Group will recruit over 8,000 new employees in 2018 for its various airlines, the
majority will be flight attendants including 2,500 for Lufthansa’s hubs at Frankfurt and
Munich. Austrian Airlines is also hiring more than 500 staff (cabin crew and pilots)
(Lufthansa, 8 January).

Lufthansa Group is in the process of developing a standard specification for its fleet of
Airbus A320neo family aircraft across the Group’s airlines (Austrian, Brussels Airlines,
Eurowings, Lufthansa and SWISS) from 2019 onwards. The aim is to enable Lufthansa to
move aircraft and capacity more efficiently between the airlines and their hubs. Lufthansa
Group expects to receive circa 100 A320neo family aircraft by 2025 (Lufthansa, 25
January).

Low-cost subsidiary Norwegian Air Argentina has been granted an air operator’s certificate
(AOC) by the Argentine government and will be able to start services on 72 domestic and
80 international routes between June and August. The airline took delivery of its first
Boeing B737-800 aircraft in January (Norwegian, 26 January).

Industry Monitor. Issue 200. 14/02/2018            Page 5                    © EUROCONTROL 2018
Document Confidentiality Classification: White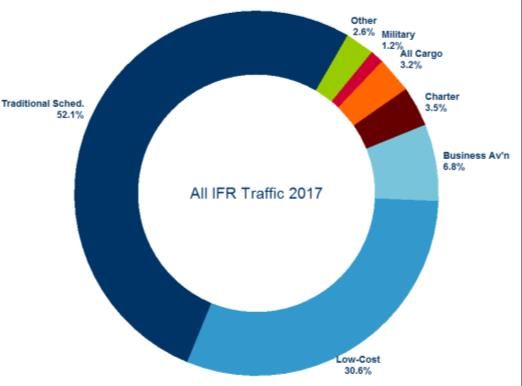
(2017 v. 2016)

  Figure 5: Main carriers’ traffic statistics in 2017.

Former airberlin subsidiary NIKI will reportedely remain under control of its founder Niki
Lauda and be rebranded Laudamotion as he came out as the best bidder versus IAG
Group which planned to buy NIKI assets via its Spanish LCC Vueling. NIKI filed for
insolvency and ceased operations in December 2017. It is reported that Laudamotion
should restart operations by the end of March and focus on tourist destinations with a fleet
of 15 aircraft (Reuters, 22 January).

Thomas Cook Group Airlines will increase its capacity by 10% in Summer 2018 following
the acquisition of Air Berlin Aviation GmbH from bankrupt Air Berlin and the launch of its
new Palma de Mallorca-based airline. Most of the capacity growth will come from an
increase in short- and medium-haul flights by Condor which plans to operate six additional
aircraft through Air Berlin Aviation AOC. Thomas Cook will launch 70 new routes (Thomas
Cook Group, 8 February).

Start-up Air Belgium will start operations from its home base at Charleroi (Brussels South)
to Hong Kong as its first destination in Asia with a fleet of four Airbus A340-300 aircraft.
The inaugural flight will take place at the end of March after the carrier has taken delivery
of its first A340 aircraft in mid-February and obtained its air operator’s certificate (Air
Belgium, 31 January).

Eurowings will set up a base at Nuremberg at the end of March and base one Boeing
B737-800 aircraft serving leisure destinations including Palma de Mallorca, Heraklion,
Catania and Olbia (Eurowings & Nuremberg airport, 26 January).

Ryanair has agreed to negotiate with trade unions across Europe for the first time in its
history, a move the carrier was forced to make at the end of last year in order to avoid pilot
strikes. In January, Ryanair formally recognized UK pilots union (BALPA) and agreed on
pay increases (Ryanair, December 2017 and January).

Industry Monitor. Issue 200. 14/02/2018                           Page 6   © EUROCONTROL 2018
Document Confidentiality Classification: White
2016      2017

   Figure 6: Main carriers’ load factors in 2017.

Routes, Alliances, Codeshares

Ryanair has launched 10 new routes in France and plans further expansion with the
opening of new bases at French regional airports. The new routes include Paris Beauvais
to Bratislava, Malta, Prague and Thessaloniki; Marseille to Bucharest, Budapest and Faro;
Nantes to London Stansted and Seville; and Bordeaux to Valencia (Ryanair, 17 January).

Ryanair expands in the Middle-East and will launch a total of 14 new routes from Europe to
Jordan starting with one route from Paphos to Amman in March. With the start of the winter
schedule there will be 9 new routes to Amman from Bologna, Milan Bergamo, Brussels,
Bucharest, Budapest, Krakow, Warsaw Modlin, Prague and Vilnius along with four routes
to Aqaba from Athens, Cologne, Rome Ciampino and Sofia (Ryanair, 4 February).

Wizz Air will set up a new base at Vienna and launch 17 new routes between April and
November with three Airbus A320/321 aircraft. The new services from Vienna include
Gdansk, Tuzla, Varna, Bari, Malta, Rome, Valencia, Tel Aviv, Billund, Bergen, Dortmund,
Kutaisi, Larnaca, Nis, Ohrid, Tenerife and Thessaloniki (Wizz Air, 11 January).

Low demand has forced Wizz Air to close its base at Prague, effective 14 June. The carrier
will also reduce to three (from eight) the number of routes it serves from Prague and will
continue to operate services to London Luton, Bari and Kutaisi (Wizz Air, January).

British Airways will expand operations at London Gatwick this summer following the
acquisition of take-off and landing slots from bankrupt Monarch Airlines. The carrier will
increase weekly frequencies by circa 150 at Gatwick and focus on transatlantic routes with
the launch of two new services to Las Vegas and Toronto to face competition from
Norwegian (British Airways, 4 January).

WOW Air will increase to 15 the number of long-haul low-cost routes from Europe (via
Reykjavik) to North America with the addition of Detroit, Cleveland, Cincinnati, St Louis and
Dallas in the course of 2018. In 2017 WOW Air recorded an increase of 69% of
passengers carried compared with 2016 (WOW Air, January).

Industry Monitor. Issue 200. 14/02/2018           Page 7                © EUROCONTROL 2018
Document Confidentiality Classification: White
Rank          Rank                             Average Daily
                         Departure Airport                                    Growth on 2016
   2016          2017                             Departures 2017
   1             1       Amsterdam                               696                    3.9%
   2             2       Paris Charles De Gaulle                 661                    1.0%
   3             3       London Heathrow                         652                    0.5%
   4             4       Frankfurt                               651                    3.0%
   5             5       Istanbul Atatürk                        618                   -0.6%
   6             6       Munich                                  551                    2.9%
   7             7       Madrid                                  531                    2.8%
   9             8       Barcelona                               443                    5.4%
   8             9       Rome Fiumicino                          407                   -5.0%
   10            10      London Gatwick                          392                    2.4%
                 Top 10 Departure Airports' share of total departures in 2017 = 19%
                                                            Source: www.eurocontrol.int/statfor/sid

  Figure 7: Main departure airports in 2017.

Airports
Istanbul New Airport (ICAO code: LTFM) is due to open on 29 October 2018 to become
Turkey’s primary airport with 90 million passengers a year and to serve as a hub for
connecting flights between Europe and Asia. The new airport will have six runways and the
capacity to handle 200 million passengers when it is fully operational by 2028 (IGA, 28
December).

Lelystad (NL) which is set to open in April 2019 reportedly faces local protest and political
opposition which could delay its opening until 2023. The airport is meant to take over low-
cost traffic from Amsterdam which has reached its capacity limit. Lelystad could handle
25,000 flights per year during the first stage (Lelystad Airport and NL Times, February).

For the second year in a row, Amsterdam was the busiest European airport in 2017 in
terms of average daily departures and grew by 3.9% compared with 2016 (Figure 7) driven
by the low-cost and traditional scheduled segments which together added 24 daily
departure flights and the good performance of the charter segment which was up 24%
(owing partly to the resumption of flights to Egypt). Barcelona recorded the best
progression with an increase of 5.4% on 2016. At the other end of the scale, Rome
Fiumicino’s decrease of 5% was linked to the weak performance of Alitalia which saw 13
fewer daily departure flights. Istanbul Atatürk posted an overall decrease of 0.6% in 2017
although it started to recover from June 2017 onwards (EUROCONTROL, STATFOR,
January).

Passenger traffic and commercial aircraft movements in 2017 at top five European airports
(based on the number of flights) compared with the year before were as follows (growth on
2016):

Industry Monitor. Issue 200. 14/02/2018          Page 8                        © EUROCONTROL 2018
Document Confidentiality Classification: White
Aircraft manufacturing Boeing reported net commercial orders for 912 aircraft in 2017 (up 37% on 2016) and delivered 763 aircraft (up 2% on 2016) of which 529 B737 aircraft, 136 B787 aircraft, 74 B777 aircraft, 14 B747 aircraft and 10 B767 aircraft. 15% of total deliveries were destined to the European market. Boeing projects to deliver up to 815 aircraft in 2018 (Boeing, 10 January). Airbus recorded 1,109 net orders in 2017 (up 52% on 2016) and delivered 718 aircraft (up 4% on 2016) of which 558 A320 ceo/neo family aircraft, 67 A330 aircraft, 78 A350 aircraft and 15 A380 aircraft. 13% of total deliveries were meant for the European market (Airbus, 15 January). Embraer reported 104 commercial orders in 2017 (up 33% on 2016) and 101 deliveries (down 6% on 2016) of which 79 E175s aircraft, 12 E190s aircraft and 10 E195s aircraft (Embraer, January). ATR reported 113 firm orders in 2017 from 36 units in 2016 and delivered 80 aircraft as in 2016 (ATR, January). Cargo IATA reported that European airlines recorded the second (after Africa) fastest growth rate of all regions in 2017: cargo capacity (FTK) was up 11.8% from 7.6% in 2016. Worldwide air cargo volumes posted their strongest annual growth since 2010 and increased by 9% in 2017 with demand growing three times faster than capacity and e-commerce driving the growth. IATA forecasts air cargo volumes to continue to grow in 2018 but at a slower pace of 4.5% compared with 2017 (IATA, 31 January). In 2017 the top five airports for all-cargo movements (with carrier name) were as follows: Industry Monitor. Issue 200. 14/02/2018 Page 9 © EUROCONTROL 2018 Document Confidentiality Classification: White
Figure 8: Brent and Kerosene prices.

Oil

Oil prices climbed to a monthly average of €56 per barrel in January 2018, the highest
since June 2015. Converted indices for Kerosene and Brent are shown in Figure 8.

In 2017 as a whole, oil prices averaged €49 per barrel and were higher than in 2016 (€41
per barrel) but remained well below the peaks of 2011-2014. Oil prices fluctuated from €51
per barrel during the first quarter of 2017 down to €47 per barrel during the second quarter
and reached their lowest during the summer months (June to August) at €43 per barrel and
their highest in November and December, at €54 per barrel. Some temporary shortages in
refining capacity meant that the margin of fuel over oil price increased: so fuel prices
increased by more than oil over the year (source EIA).

In its February short-term energy outlook, EIA forecasts Brent crude oil price to average
$62 per barrel in both 2018 and 2019 as opposed to an average of $54 per barrel in 2017
(EIA, 6 February).

Industry Monitor. Issue 200. 14/02/2018          Page 10               © EUROCONTROL 2018
Document Confidentiality Classification: White
Easter – April 2017
Easter – March 2016
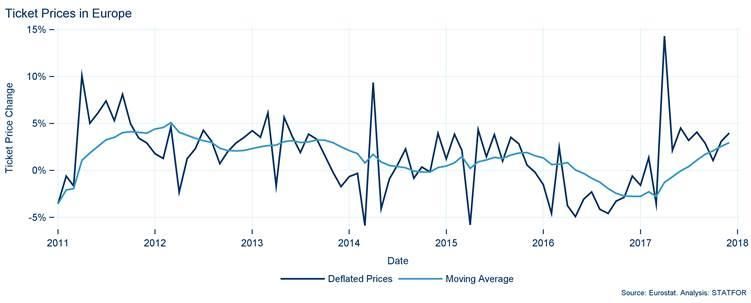
Figure 9: Deflated ticket prices in Europe.
Economy
Euro area economy indicator updates:
Annual inflation was 1.4% in December 2017 vs. 1.1% in December 2016. The largest
upward impact came from fuel for transport (+0.11 p.p.);
Unemployment rate was 8.7% in December 2017 compared with 9.7% in December
2016. This remained the lowest rate recorded in the euro area since January 2009;
GDP rose by 2.5% in 2017 (vs. 2016) (EUROSTAT, 30-31 January).
Fares
Ticket prices in Europe increased by 4% in December 2017 vs. December 2016. This is
above the trend (12-month trailing average) shown in Figure 9 (Eurostat, 31 January).
In 2017, ticket prices started to increase since the beginning of the summer (May-August
+3.5% on average and in December +4%). Compared with 2016, airline tickets in Europe
were on average 3% more expensive in 2017 (-3.6% in March to +14.3% in April due to the
Easter shift).
Note: to eliminate the influence of inflation on euro figures, the ticket price is deflated with a
price index. The STATFOR deflated ticket prices are estimated in 2015 constant euros. A
detailed explanation of the mechanism can be found here.
Industry Monitor. Issue 200. 14/02/2018 Page 11 © EUROCONTROL 2018
Document Confidentiality Classification: White200 issues and 16 years later,
Industry Monitor is essential reading for stakeholders and staff
The February 2018 edition of Industry Monitor (IM), the monthly summary of the latest air transport
th
trends compiled by STATFOR, is the 200 edition, a big milestone, and a chance to look back on
why we in the STATFOR team produce the newsletter, and what our readers get out of it.
In the last survey of the 800 or so subscribers, 85% rated the publication as having content ‘above
average’ or ‘excellent’, which we’re proud of: we try our very best to make the IM a rigorously
researched, highly objective summary of the main trends in air transport, cross-referred against
STATFOR data.
So how did the Industry Monitor evolve?
The IM story starts with 9/11. Andrew Watt, Head of Unit, Support to SES-related Policies was there
at the start. “I was working as the adviser to George Paulson, then Director Safety, Airspace and
Aeronautical Information”, notes Andrew, “and he suggested that maybe EUROCONTROL should
publish something that provided impartial facts on the state of the industry, and how it was evolving.
George turned to David Marsh, Head of Forecasts & Network Intelligence Unit, the guardian of our
traffic statistics, and that is essentially how IM was born”.
The wake of 9/11 saw great volatility across markets and across the air industry. ”The sudden drop
in demand for flying came as a surprise”, David emphasises, “and the attacks were a catalyst for an
economic sea-change. De-regulation is often given as the main change that enabled low-cost
th
airlines to transform short-haul travel. Maybe, but the business mayhem after Sep 11 was also an
opportunity that some seized. Airlines which had expanded rapidly, taken on debt, bought
competitors, made huge aircraft orders on the assumption that demand for business-class travel
was heading exponentially upwards, were suddenly looking at nothing but red on their balance
sheets, in urgent need of a new business model. Their responses were sharp: grounding aircraft,
sacking staff, cutting flights, or failing.”
STATFOR simply kept forecasting amidst this storm of reaction and headlines, taking our usual
approach in the face of uncertainty: methodical, focused on data.
The IM itself began humbly as a 60-word email to four STATFOR colleagues, summarising what
was known so far: “United, Northwest, American all cutting capacity by 20%; nothing so far in
Europe; booking firm Amadeus reporting a 74% reduction in ticket sales for US airlines 11-14
Sep…”.
The news kept on coming, faster and faster, with the team issuing its third update (the first to be
officially called the ‘Industry Monitor’) just three days later.
In the intervening 16 years, the IM has matured into a popular monthly digest of trends, selected
with the key underlying goal of helping STATFOR forecast traffic. And it has helped us improve our
accuracy, as David stresses:
“After 18 issues of IM in February 2002, we published the medium-term forecast drawing partly on
over a year of analysis, and predicted around 10.4 million flights would be handled in the CFMU
Area, as it was then called, in 2008. Now we know that the actual figure was around 10.2 million
flights. Getting within 2% at a horizon of 6 years was pretty good in the circumstances!”
Do you find the Industry Monitor useful? Do you have colleagues who would like to
subscribe? Let us know, simply complete the form here.
Industry Monitor. Issue 200. 14/02/2018 Page 12 © EUROCONTROL 2018
Document Confidentiality Classification: White© 2018 European Organisation for the Safety of Air Navigation
(EUROCONTROL)
This document is published by EUROCONTROL for information purposes.
It may be copied in whole or in part, provided that EUROCONTROL
is mentioned as the source and it is not used for commercial purposes
(i.e. for financial gain). The information in this document may not be
modified without prior written permission from EUROCONTROL.
STATFOR, the EUROCONTROL Statistics and Forecast Service
statfor.info@eurocontrol.int
www.eurocontrol.int/statfor
Industry Monitor. Issue 200. 14/02/2018 Page 13 © EUROCONTROL 2018
Document Confidentiality Classification: White
The EUROCONTROL Statistics and Forecast Service (STATFOR)
isis ISO
ISO 9001:2008
9001:2015certified.
certified.You can also read