DIRECT ACCESS TO DURBAN - Dube Tradeport
←
→
Page content transcription
If your browser does not render page correctly, please read the page content below
DIRECT ACCESS TO DURBAN
CONTENTS

   Destination: Catchment and Demographics                  page 03

   Destination: Air Traffic Statistics - Durban             page 21

   Destination: Tourism and Trade - KwaZulu-Natal           page 29

   Cargo: Imports and Exports                               page 37

   King Shaka Int. Airport: Infrastructure and Operations   page 49

   Route Development: Team and Support                      page 59

                                                             Page 1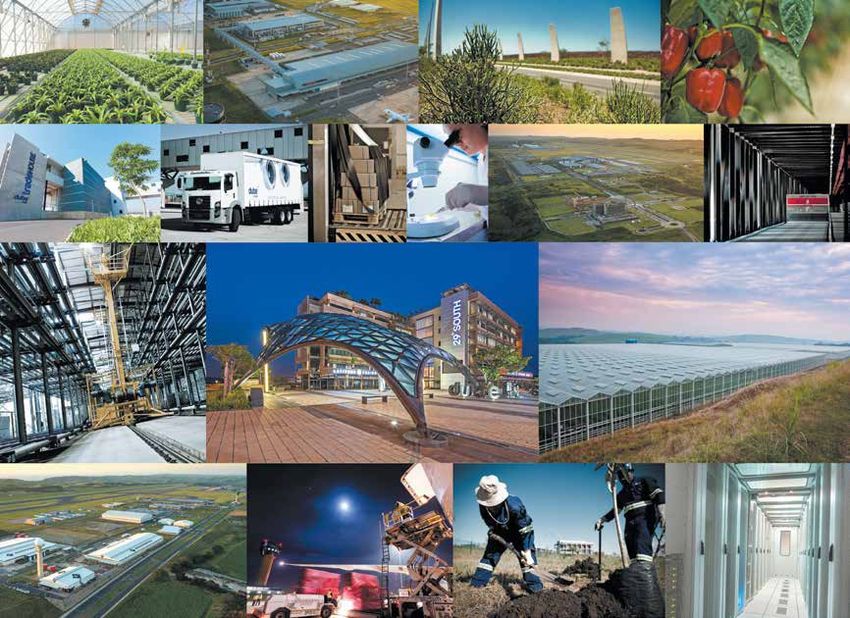
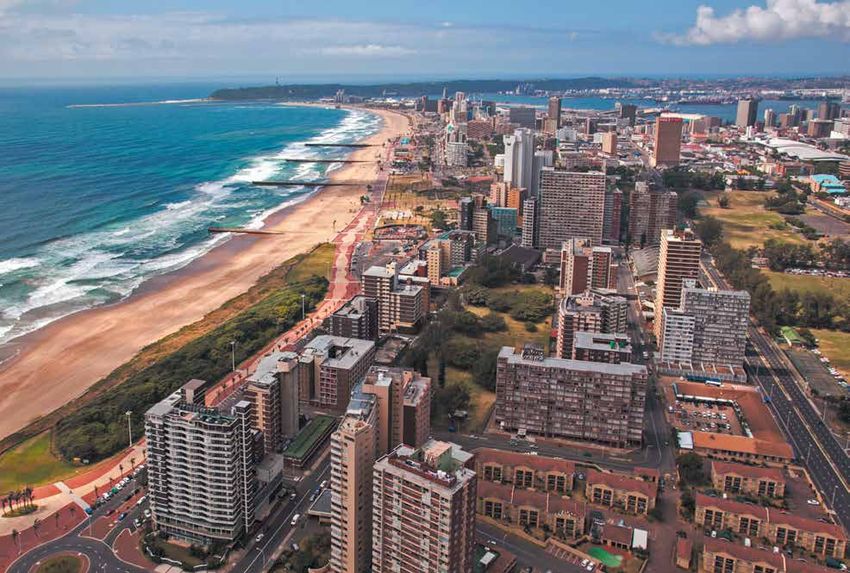
WARM BEACHES
DESTINATION:
CATCHMENT AND
DEMOGRAPHICS

                Page 3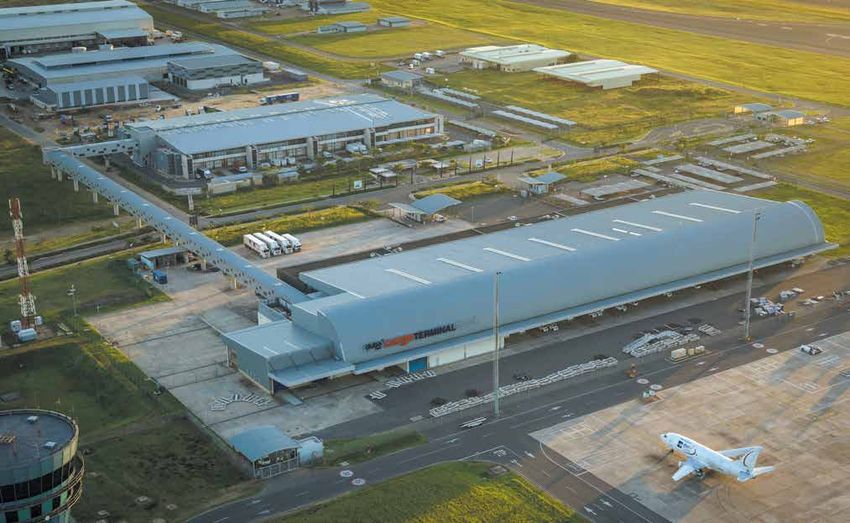
WHERE
AFRICA, SOUTH AFRICA, KWAZULU-NATAL (KZN), DURBAN

                                                                             KWAZULU-NATAL (KZN)

       AFRICA                                            KWAZULU-NATAL
                                                                -NATAL
                                          SOUTH AFRICA       DURBAN
                                                                         DURBAN          RICHARDS BAY HARBOUR
                                                                                    DUBE TRADEPORT
                                                                                   DURBAN HARBOUR

Destination: Catchment and Demographics                                  Page 4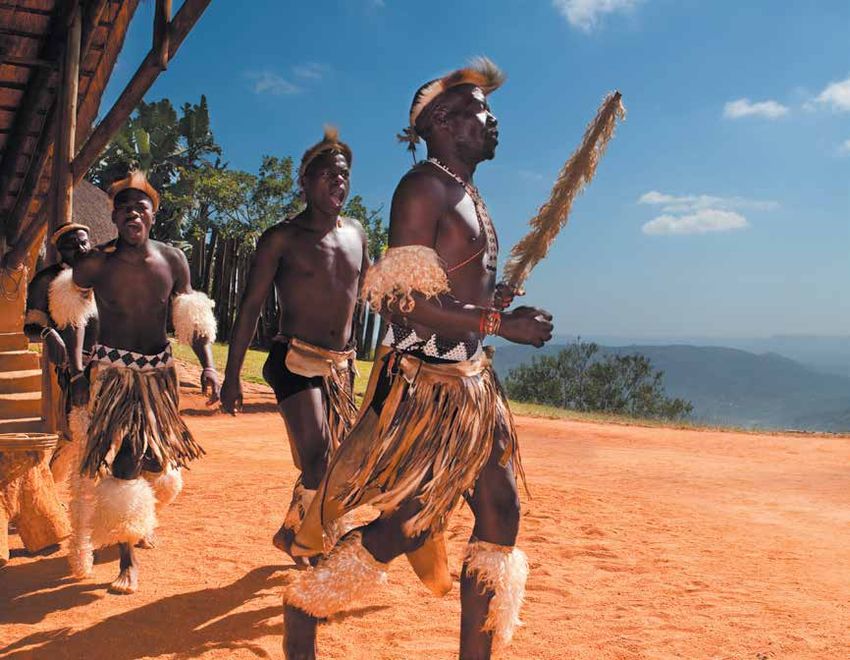
CURRENT NETWORK
DURBAN

                   AFRICA

                                          DURBAN,           INTERNATIONAL ROUTES
                          SOUTH AFRICA    KWAZULU-NATAL
                                                            REGIONAL ROUTES
                                                            DOMESTIC ROUTES

Destination: Catchment and Demographics                   Page 5
CURRENT NETWORK
EXISTING AIRLINE CUSTOMERS

Destination: Catchment and Demographics   Page 6

WHY DURBAN, KWAZULU-NATAL
TOP REASONS TO LAND HERE
POPULATION ECONOMY
South Africa’s 2nd most populated: South Africa’s 2nd largest economy:
• Province - KwaZulu-Natal: 10.9m • 16% contribution to the country’s GDP in 2015
• City - Durban: 3.5m • One of the fastest growing regions in the
2nd country (avg. GDP growth of 3.6%, 2004-14)
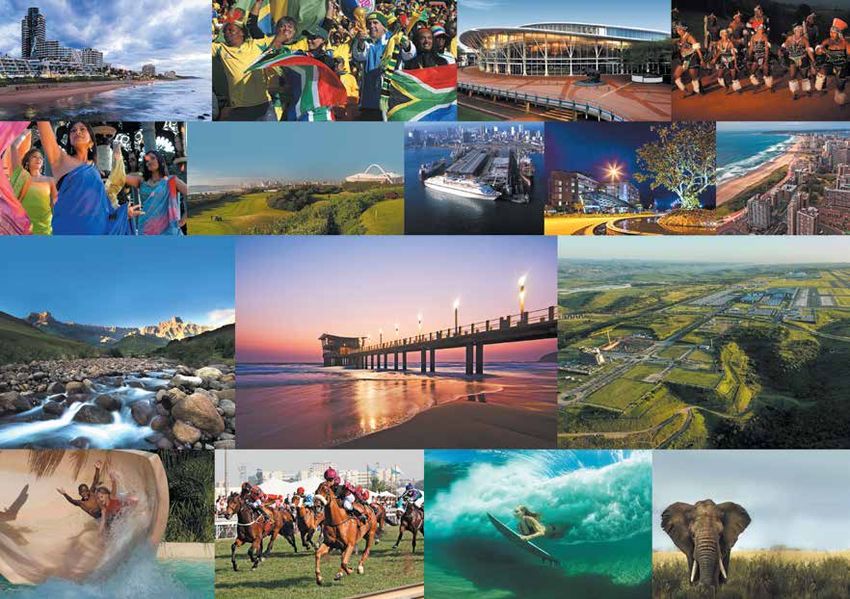
TOURISM BUSINESS AND TRADE
Diverse and popular leisure destination: • Boasts the 3rd highest export and import
• Heritage, Beach, Adventure, Safari propensity and the 2nd highest level of
• Attracts 1.3m foreign visitors industrialisation in the country
and 13.9m domestic visitors per year • KZN houses the 2 largest seaports in
the Southern Hemisphere, handling
±80% of South Africa’s cargo
Destination: Catchment and Demographics Page 7
WHY DURBAN, KWAZULU-NATAL
GROSS DOMESTIC PRODUCT BY INDUSTRY, 2015

                                                     MANUFACTURING
                                 OTHER                  16.33%
                                 27.15%
                                                                 WHOLESALE
                                                               & RETAIL TRADE;
                                                                  HOTELS &
                                                                RESTAURANTS
                                                                   14.21%
                              GENERAL
                            GOVERNMENT                      TRANSPORT &
                             SERVICES                      COMMUNICATION
                              14.35%                          11.34%
                                              FINANCE,
                                            REAL ESTATE &
                                          BUSINESS SERVICES
                                               16.62%

                                               Source: Department of Trade and Industry

Destination: Catchment and Demographics                                          Page 8
WHY DURBAN, KWAZULU-NATAL
TOP 10 GROSS DOMESTIC PRODUCT BY INDUSTRY, 2015
INDUSTRY ZAR BILLION SHARE
Aluminium and articles thereof 20,11 9%
Electrical machinery and equipment and parts thereof 8,04 3%
Inorganic chemicals; organic or inorganic compounds of precious metals 10,59 4%
Iron and steel 16,77 7%
Nuclear reactors, boilers, machinery and mechanical appliances; parts thereof 17,20 7%
Ores, slag and ash 13,79 6%
Paper and paperboard; articles of paper pulp, of paper or of paperboard 8,01 3%
Plastics and articles thereof 7,58 3%
Pulp of wood or of other fibrous cellulosic material 8,82 4%
Vehicles other than railway or tramway rolling stock, and parts and accessories thereof 38,70 16%
TOTAL 149,61 64%
TOTAL Industry for KwaZulu-Natal 235,58 100%
Source: Department of Trade and Industry
Destination: Catchment and Demographics Page 9WHY DURBAN, KWAZULU-NATAL HOME TO BIG BUSINESS Destination: Catchment and Demographics Page 10
WHY DURBAN, KWAZULU-NATAL
OPPORTUNITIES

 Highly diversified agricultural sector: Leaders in the production of sugar cane and timber in South Africa.
 Amongst these businesses are Mondi, Sappi Limited, Tongaat Hullet and Crooks Brother. Many agro-processing
 opportunities exist within the province.

 Automotive and electronic manufacturing of components thereof is well established in the Durban region.
 These businesses include Toyota, Samsung and Bell Equipment, including several major national suppliers.
 The Durban Automotive Cluster (DAC) is a partnership between the eThekwini Municipality and the automotive
 industry in KwaZulu-Natal with the aim to grow and support this sector.

 Transport and logistical activities are growing significantly in the province. Having more than 600km of
 coastline, and Africa’s busiest seaport in Durban and bulk seaport in Richards Bay, combined with excellent road
 and rail infrastructure and global logistics service providers, it is easy to see why KwaZulu-Natal lays claim to
 being southern Africa's Trade Gateway.

 KwaZulu-Natal's manufacturing sector is the second largest in the country. The manufacturing sector is geared
 for export, with nearly a third of South Africa's manufactured exports being produced in KwaZulu-Natal.

Destination: Catchment and Demographics                                                   Page 11
HOME TO SA’S GREATEST EVENTS
WHY DURBAN, KWAZULU-NATAL
HOME OF SOUTH AFRICA’S BEST

CONFERENCES AND EVENTS:
 • VODACOM DURBAN JULY: AFRICA’S RICHEST HORSE RACE
 • COMRADES MARATHON: PREMIER ULTRA-DISTANCE MARATHON
 • DUSI CANOE MARATHON: AFRICA’S PREMIER CANOE CHALLENGE
 • TOURISM INDABA: AFRICA’S LARGEST TRAVEL AND TOURISM SHOW
 • 2022 COMMONWEALTH GAMES, A FIRST FOR AFRICA (HOST CITY)
 • 2016 WORLD AIDS CONFERENCE (HOST CITY)

TWO WORLD HERITAGE SITES:
 • UKHAHLAMBA (DRAKENSBERG)
 • ISIMANGALISO (ST LUCIA WETLANDS)

Destination: Catchment and Demographics                       Page 13
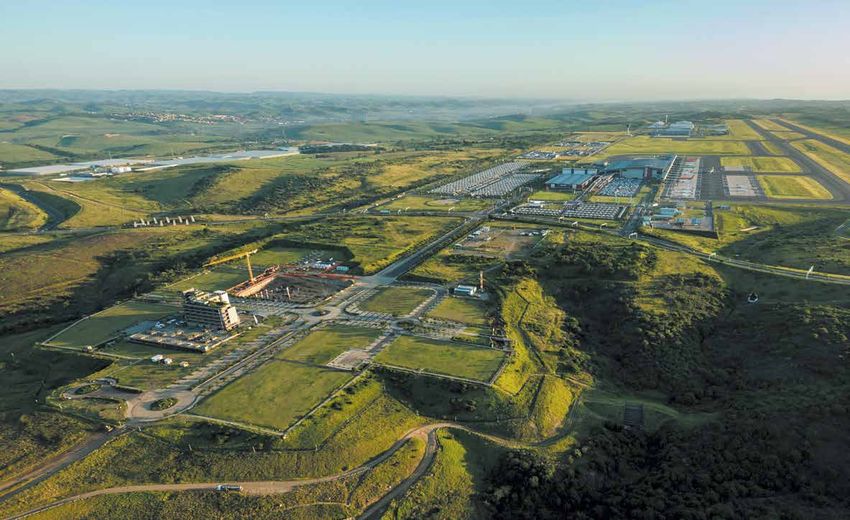
DURBAN AEROTROPOLIS
The perfect platform for the expansion of global business and trade
opportunities, together with the stimulation of economic growth
This emergent airport city and major trade and business hub is becoming South Africa’s new gateway to
Southern Africa and the world, heralding the dawn of a highly competitive business operating environment;
an environment specifically designed to accelerate business efficiencies and enhance the global supply chain.

Durban Aerotropolis – the heart of which is Dube TradePort and King Shaka International Airport (DUR) – is a
major trade and business hub in Sub-Saharan Africa, on the doorstep of KwaZulu-Natal’s biggest city and
primary manufacturing centre, Durban.

It brings to the fore a highly competitive business operating environment, complete with state-of-the-art
connected infrastructure – road, rail, seaport and IT – all designed to accelerate business efficiencies and
enhance the global supply chain.

The development is strategically located between the seaports of Durban – Africa’s busiest port, boasting the
southern hemisphere’s biggest and best-equipped container terminal – and Richards Bay – South Africa’s
largest deep-water port and the primary facility for handling bulk commodities, as well as granite blocks,
liquid and steel.

Destination: Catchment and Demographics                                             Page 14
DURBAN AEROTROPOLIS
Significant Government investment in continued port and regional development is set to further streamline
business efficiencies, while planning activities for Durban’s new and visionary dig-out port project will also
broaden the competitive advantage of the Durban Aerotropolis.
Based on a 50-year master plan, three components clearly set Dube TradePort, at the heart of the Durban
Aerotropolis, apart, affording it a distinct competitive advantage over other South African and African destinations:
    • Firstly, this is a freight-orientated development with world-class cargo facilities, managed
          by a single handler and considered the most secure in Africa;
    • Secondly, it is being purpose-built; and
    • Thirdly, this is one of few such developments around the world utilising a greenfield site, with over 3 000
          hectares (7 413 acres) of land ready for carefully planned and controlled development.
The development provides for public and private cooperation, coordination and alignment with Government
planning, ensuring both direct and indirect involvement in its development and growth by not only the Provincial
Government, but also attendant Local Government structures, organised business and – critically – the private
sector. Such a strong public-private relationship is rare in the growth of aerotropolis developments anywhere else in
the world, while here these sectors are pooling their individual strengths to realise a common and mutually
beneficial objective: the sustained coordination of the growth and development of the Durban Aerotropolis in a
region renowned for its lifestyle.
We are developing the smartest airport-based development possible;
take advantage of the opportunities in the next frontier: AFRICA.

Destination: Catchment and Demographics                                              Page 15
TOURISM PRODUCT DESTINATIONS IN KWAZULU-NATAL Destination: Catchment and Demographics Page 16
TOURISM PRODUCT
DESTINATIONS IN KWAZULU-NATAL
DESTINATION                  DISTANCE (km) TRAVEL TIME (hrs)
DURBAN TO PIETERMARITZBURG   80             0.8

DURBAN TO PORT SHEPSTONE     132            1.25

DURBAN TO PORT EDWARD        179            1.5

DURBAN TO UNDERBERG          164            1.5

DURBAN TO KAMBERG            161            1.5

DURBAN TO BERGVILLE          226            2

DURBAN TO ULUNDI             211            1.6

DURBAN TO KWADUKUZA          74             0.8

DURBAN TO RICHARDS BAY       186            1.5

DURBAN TO ST LUCIA           243            2.5

DURBAN TO HLUHLUWE           274            2.5

DURBAN TO SODWANA BAY        359            3.5

DURBAN TO KOSI BAY           439            4.5

DURBAN TO UPHOGOLO           339            3.5

DURBAN TO OSIZWENI           288            3

DURBAN TO LADYSMITH          215            1.7

Destination: Catchment and Demographics                        Page 17
CATCHMENT & DEMOGRAPHICS
INCOME AND KEY STATISTICS: DURBAN

INCOME                            PERCENTAGE                   KEY STATISTICS                    2011

Net income                        17,1%                        Total population                  3,442,361
R1 - R4,800                       4,2%                         Young (0 - 14)                    25,2%
R4,801 - R9,600                   6,2%                         Working age (15 - 64)             70%
R9,601 - R19,600                  14,3%                        Elderly (65 +)                    4,8%
R19,601 - R38,200                 16,9%                        Dependency ratio                  42,8%
R38,201 - R76,400                 13,4%                        Sex ratio                         95,6
R76,401 - R153,800                10,7%                        Growth rate                       1,08% (2001 - 2011)
R153,801 - R307,600               8,6%
R307,601 - R614,400               5,7%
R614,001 - R1,228,800             2%
R1,228,801 - R2,457,600           0,6%
R2,457,601 +                      0,3%

                                          Source: Statistics South Africa www.statssa.gov.za

Destination: Catchment and Demographics                                                Page 18
CATCHMENT & DEMOGRAPHICS
GDP BY PROVINCE (2015)
40%
35%
30%
25%
% of GDP
20%
15% 15.95%
10%
5%
0%
pe
te
ng
po
ga
e
pe
st
al
ap
sta
We
at
Ca
e
po
lan
Ca
ut
nC
-N
Lim
a
rn
Ga
ee
rn
rth
lu
um
er
ste
ste
Fr
Zu
No
rth
Mp
Ea
We
a
No
Kw
Source: Department of Trade and Industry
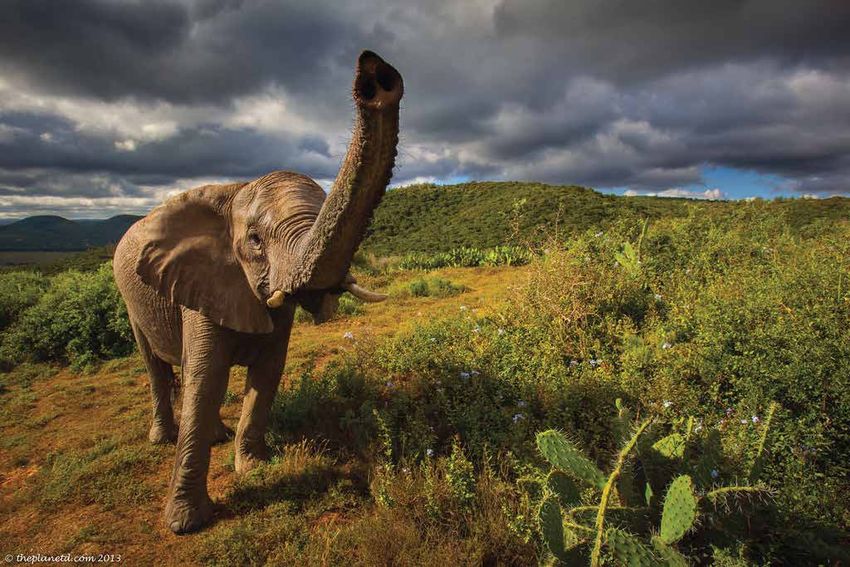
Destination: Catchment and Demographics Page 19WILDLIFE
DESTINATION:
AIR TRAFFIC STATISTICS
Durban

               Page 21
OUTLOOK FOR DURBAN 10 000 000 500
9 000 000 450
8 000 000 400
Durban Passenger numbers are 7 000 000 350
Passenger Volume
closely linked to South African GDP 6 000 000 300
Billions USD
(2006 to 2015. Source: World Bank and 5 000 000 250
Sabre ADI) 4 000 000 200
3 000 000 150
2 000 000 100
1 000 000 50
- -
2006 2007 2008 2009 2010 2011 2012 2013 2014 2015
Total DUR Passengers South Africa GDP
The GDP forecast suggests a 7 000 000 3.0%
passenger growth of over 500 000 6 500 000 2.5%
passengers to 2020
Passenger Volume
6 000 000 2.0%
5 500 000 1.5%
5 000 000 1.0%
4 500 000 0.5%
4 000 000 0.0%
2016 2017 2018 2019 2020
Passenger Volume GDP Growth %
Source: Sabre ADI
Destination: Air Traffic Statistics - Durban Page 22AIR TRAFFIC STATISTICS
PASSENGER GROWTH TO AND FROM DURBAN, 2011 - 2015
6 000 000
5 038 231
5 000 000 4 747 381 4 786 928
4 504 929 4 495 974
Number of Passengers
4 000 000
3 000 000
2 000 000
1 000 000
-
2011 2012 2013 2014 2015
*Decline in passengers numbers in 2012-2013
due to collapse of 1Time Airlines November 2012
Source: Sabre ADI
Destination: Air Traffic Statistics - Durban Page 23AIR TRAFFIC STATISTICS
INTERNATIONAL DURBAN TRAFFIC DATA, 2015
ORIGIN COUNTRY DIRECT INDIRECT GRAND TOTAL
UNITED KINGDOM - 86 252 86 252
UNITED STATES - 41 378 41 378
INDIA - 37 273 37 273
UNITED ARAB EMIRATES 34 748 - 34 748
MAURITIUS 16 903 14 068 30 971
AUSTRALIA - 25 141 25 141
ZIMBABWE 10 263 12 757 23 020
GERMANY - 22 970 22 970
SAUDI ARABIA - 21 052 21 052
ZAMBIA 7 746 10 770 18 516
MOZAMBIQUE 6 385 10 971 17 356
THAILAND - 13 641 13 641
CHINA - 13 477 13 477
ITALY - 13 337 13 337
NAMIBIA - 9 196 9 196
HONG KONG - CHINA - 8 756 8 756
NETHERLANDS - 8 389 8 389
FRANCE - 8 069 8 069
NEW ZEALAND - 7 991 7 991
KENYA - 7 919 7 919
Total 76 045 373 407 449 452
Source: Sabre ADI
Destination: Air Traffic Statistics - Durban Page 24AIR TRAFFIC STATISTICS
INTERNATIONAL DURBAN AIR FARE DATA, 2011 - 2015
$ 1 600 R 14 Avg Fares USD
$ 1 400 ZAR / USD
R 12
$ 1 200
R 10
$ 1 000
R8
$ 800
R6
$ 600
R4
$ 400
$ 200 R2
$ 0 R0
2011 2012 2013 2014 2015
Source: Sabre ADI and South African Reserve Bank
Destination: Air Traffic Statistics - Durban Page 25AIR TRAFFIC STATISTICS
TOP 10 AFRICAN CITIES TO/FROM DURBAN, 2015
Direct
Mauritius
Indirect
Harare
Lusaka
Maputo
Windhoek
Nairobi
Dar Es Salaam
Lagos
Gaborone
Luanda
0 5 000 10 000 15 000 20 000 25 000 30 000 35 000
Source: Sabre ADI
Destination: Air Traffic Statistics - Durban Page 26AIR TRAFFIC STATISTICS
TOP 15 INTERNATIONAL CITIES TO/FROM DURBAN, 2015
London Direct
Dubai Indirect
Mumbai
Jeddah
New York
Delhi
Hong Kong
Amsterdam
Manchester
Perth
Manila
Phuket
Istanbul
Frankfurt
Bangkok
0 10 000 20 000 30 000 40 000 50 000 60 000 70 000
Source: Sabre ADI
Destination: Air Traffic Statistics - Durban Page 27DRAKENSBERG
DESTINATION:
TOURISM AND TRADE
KwaZulu-Natal (KZN)

                  Page 29
VISITOR STATISTICS
TOP 10 INTERNATIONAL MARKETS, KWAZULU-NATAL, 2015
300,000
250,000
200,000
150,000
100,000
50,000
-
tho
e
e
e
s
ia
y
nd
A
UK
nd
an
bw
iqu
nc
US
Ind
ila
so
rla
rm
a
ba
mb
Fr
az
Le
the
Ge
Zim
za
Sw
Ne
Mo
Source: South Africa Tourism
Destination: Tourism and Trade - KwaZulu-Natal Page 30VISITOR STATISTICS
PURPOSE OF VISITS FOR ALL FOREIGN TOURISTS, KWAZULU-NATAL, 2015
50%
40%
41%
30%
28%
20%
21%
10%
7% 2% 1%
-
Business Leisure Medical Other Religion VFR
Source: South Africa Tourism
Destination: Tourism and Trade - KwaZulu-Natal Page 31VISITOR STATISTICS
PROVINCIAL DISTRIBUTION - SHARE OF BEDNIGHTS, KWAZULU-NATAL, 2015
40
35
36%
30
25
% OF TOURISTS
20
19%
15
10 11% 11%
5 8%
6% 6%
4% 1%
-
Eastern Free Gauteng KwaZulu- Limpopo Mpumalanga North Northern Western
Cape State Natal West Cape Cape
Source: South Africa Tourism
Destination: Tourism and Trade - KwaZulu-Natal Page 32VISITOR STATISTICS
ALL FOREIGN TOURISTS, KWAZULU-NATAL, 2013 - 2015
1 000 000
900 000
800 000
700 000 745 907 739 676 743 615
600 000
500 000
400 000
300 000
200 000
100 000
-
2013 2014 2015
Source: South Africa Tourism
Destination: Tourism and Trade - KwaZulu-Natal Page 33TRADE PARTNER STATISTICS
TOP 10 TRADE PARTNERS, KWAZULU-NATAL, 2015
NETHERLANDS
9 CHINA
7 1
3 UK
USA 2
5 JAPAN
GERMANY
4
BRAZIL INDIA
10
AUSTRALIA
7
8
NAMIBIA KZN
Source: Department of Trade and Industry
Destination: Tourism and Trade - KwaZulu-Natal Page 34TRADE PARTNER STATISTICS
TOP 10 TRADE PARTNERS, KWAZULU-NATAL, 2015
35%
30%
28.6%
25%
20%
18.6%
15%
13.7%
10%
8.7%
7.6% 7.0%
5% 6.6% 6.5% 5.7%
4.7%
0%
A
ina
an
ia
y
a
a
s
il
UK
an
nd
US
ibi
ali
az
Ind
Jap
Ch
rm
Br
rla
m
str
Na
Ge
the
Au
Ne
Source: Department of Trade and Industry
Destination: Tourism and Trade - KwaZulu-Natal Page 35DUBE CARGO TERMINAL
CARGO:
IMPORTS AND EXPORTS

             Page 37
CARGO
DUBE CARGO TERMINAL
100 000 TERMINAL
ANNUAL CARGO
TONNES: HANDLING CAPACITY
CARGO TERMINAL
OPERATIONAL 24/7
6 ON-SITE STATE
16
REGULATORY AGENTS
0%
45
WEEKLY DUBE CARGO
WIDE-BODIED SERVICES
TRADEPORT
RICHARDS BAY LOSS
320
KZN
M FULLY
INTEGRATED ROAD
AIROAD
DURBAN
AUTOMATED CONNECTIVITY TO SA’S
AIR BRIDGE MAJOR COMMERCIAL CENTRES
13
CONNECTING TO
200
AIRLINES
KILOMETRES FROM TRADEZONE TO
METRES CARGO TERMINAL
OVER 900
DESTINATIONS
FROM DUBE TRADEPORT
TO DURBAN HARBOUR,
AFRICA’S BUSIEST CARGO PORT 1GOAL TO ADD VALUE TO YOUR SUPPLY CHAIN
Cargo: Imports and Exports Page 38CARGO DUBE CARGO TERMINAL Dube Cargo Terminal is one of the most secure and state-of-the-art cargo terminals in Africa. This comprehensive Part 108 accredited Terminal is designed and operated with air cargo security specifically in mind. Technologically advanced cargo-handling equipment allows cargo to be digitally tracked and mechanically handled, making both loading and retrieval quick and efficient. Security of cargo is a priority, and scanning procedures on entry and exit of the terminal premises allow for faster and more efficient processing from customs. The terminal has the capacity to handle 100 000 tonnes per annum, with the ability to expand to 2 million tonnes by 2060. It also has a dedicated facility to handle 20 foot ocean containers and oversized shipments such pipes, large machinery, vehicles, etc. With stringent vehicle and personnel access controls, computerised tracking and storage, in-line scanning and on-site customs, Dube Cargo Terminal is one of the most technologically advanced in the world. In addition to this is Dube AiRoad, a dedicated, time-sensitive logistics fleet that connects the Cargo Terminal to major cities and airports in Southern Africa. Part of this fleet of Euro 5 emission trucks is refrigerated, so cold chain integrity is also secured. Cargo: Imports and Exports Page 39
CARGO
KWAZULU-NATAL AND SA: IMPORT & EXPORT TOTALS (SEA AND AIR)
                                TRADE (R BILLIONS)                              GROWTH (%)
                        2012     2013       2014          2015         2013            2014     2015
 EXPORTS
 South Africa          797.3     900.2      969.5      1,010.2        12.9%            7.7%   4.20%
 KwaZulu-Natal          79.0      88.6      111.0        116.9        12.0%        25.3%      5.32%
 % Share of SA          9.9%     9.8%      11.5%        11.6%
 IMPORTS
 South Africa          854.6     997.7    1,082.9      1,088.8        16.8%            8.5%   0.54%
 KwaZulu-Natal          88.2     103.0      104.7        118.7        16.7%            1.7%   13.39%
 % Share of SA        10.3%     10.3%       9.7%        10.9%
 TRADE BALANCE
 South Africa           -57.3    -97.5     -113.5        -78.7
 KwaZulu-Natal           -9.2    -14.4        6.3          -1.8

                                            Source: Department of Trade and Industry

Cargo: Imports and Exports                                                 Page 40
CARGO
KWAZULU-NATAL: TOP 10 IMPORT & EXPORT SHARE BY COUNTRY
DESTINATION MARKETS SOURCE MARKETS
2008 2015 2008 2015
Japan 9.85% United States 9.09% Japan 16.46% China 22.04%
United States 7.60% China 6.60% China 14.02% Japan 14.04%
United Kingdom 5.90% Namibia 6.29% Germany 8.71% Australia 5.45%
Germany 3.87% Japan 4.51% United States 7.26% India 5.18%
Nigeria 3.84% United Kingdom 5.12% Australia 6.27% United States 4.66%
Spain 3.78% Botswana 3.94% Argentina 5.99% Germany 4.47%
Netherlands 3.76% Netherlands 3.60% United Kingdom 3.72% Argentina 2.87%
China 3.33% India 3.53% Thailand 3.45% Brazil 2.67%
India 2.84% Germany 3.13% Brazil 2.97% Thailand 2.44%
Zambia 2.79% Mozambique 3.10% Malaysia 2.73% France 2.19%
Top ten share of total
47.56% 48.91% 71.58% 66.01%
Source: Department of Trade and Industry
Cargo: Imports and Exports Page 41CARGO
KWAZULU-NATAL: IMPORT PRODUCTS (SEA AND AIR), 2015
Organic chemicals
Cereals
Paper and paperboard
Miscellaneous chemical products
Iron and steel
Plastics and articles thereof
Electrical machinery
Inorganic chemicals
Machinery
Vehicles and parts thereof
0% 2% 4% 6% 8% 10% 12% 14% 16% 18%
Source: Department of Trade and Industry
Cargo: Imports and Exports Page 42CARGO
KWAZULU-NATAL: EXPORT PRODUCTS (SEA AND AIR), 2015
Wood and articles of wood
Miscellaneous chemical products
Inorganic chemicals
Paper and paperboard
Machinery
Pulp of wood
Iron and steel
Ores, slag and ash
Aluminium and articles thereof
Vehicles and parts thereof
0% 2% 4% 6% 8% 10% 12% 14% 16% 18%
Source: Department of Trade and Industry
Cargo: Imports and Exports Page 43CARGO
TOTAL EXPORT AND IMPORT VOLUMES (AIR), 2011 - 2015
8 000 000
7 000 000
7 140 536
6 809 055
6 000 000 6 530 576
Total Volume (Kilograms)
5 000 000
5 143 591
4 000 000 4 454 965
3 000 000
2 000 000
1 000 000
0
2011 2012 2013 2014 2015
Source: Dube TradePort Corporation
Cargo: Imports and Exports Page 44CARGO - KING SHAKA INT. AIRPORT
EXPORT AND IMPORT MARKET, BY SECTOR AND VOLUME (AIR), 2015
3 000
2 500
2 294
Total volume (tons)
2 000
1 500
1 000 1 098
834 827 895
723
500
70 88 313
-
Electrical, Engines, Chemicals, Clothing & Basic metal Perishables Other agri Vehicles & Other
electronics machines, plastics, textiles products vehicle parts
& related equipment pharma
Source: Kaiser Report prepared for Dube TradePort Corporation
Cargo: Imports and Exports Page 45CARGO - KING SHAKA INT. AIRPORT
TOP 15 EXPORT AND IMPORT MARKET, BY COUNTRY AND VOLUME (AIR), 2015
2 500 Imports
Exports
2 000
Volume (tons)
1 500
1 000
500
0
lia
d
lles
any
a
USA
UK
nds
an
nce
ia
ya
y
an
ola
Ital
ilan
n
Ind
Ken
Chi
w
Jap
tra
Ang
m
Fra
che
erla
Tai
Tha
Aus
Ger
Sey
h
Net
Source: Kaiser Report prepared for Dube TradePort Corporation
Cargo: Imports and Exports Page 46DUBE CARGO TERMINAL
KING SHAKA INTERNATIONAL AIRPORT
KING SHAKA INT. AIRPORT:
INFRASTRUCTURE AND
OPERATIONS

                 Page 49
KING SHAKA INTERNATIONAL AIRPORT
IATA CODE: DUR | ICAO CODE: FADN
King Shaka International Airport, owned and operated by Airports
Company South Africa, is a new generation airport.
The airport has a 3,7km runway - the longest sea-level runway in
South Africa - that is capable of accomodating the world’s largest
aircraft. It has two rapid taxi-ways and the capacity to handle 23 air
traffic movements per hour.
King Shaka International Airport has the capacity to handle 7,5 million
passengers per annum in its first phase, expanding to 45 million by
the last phase of development.
KSIA: Infrastructure & Operations Page 50AIRPORT INFRASTRUCTURE
KING SHAKA INTERNATIONAL AIRPORT
Up to Code F aircraft
1,961 car parking spaces #1
2013 & 2015: Voted Best Airport
72 check-in counters Under 5 Million Passengers
18 self-service kiosks
3,700m runway
34 aircraft parking bays
16 jet bridges
Capacity of 7.5 mppa
KSIA: Infrastructure & Operations Page 51AIRPORT INFRASTRUCTURE
SERVICES
TOURIST INFORMATION BANK SERVICES
SHUTTLE SERVICES VAT REFUND / DUTY FREE
VIP LOUNGE;
TAXIS AIRLINE BUSINESS
CLASS LOUNGES
CAR RENTAL
KSIA: Infrastructure & Operations Page 52AIRPORT INFRASTRUCTURE SUPPLIERS HANDLING SERVICES: MENZIES AVIATION, BIDAIR, SWISSPORT FUEL: SKYTANKING AIRCRAFT MAINTENANCE: SAA TECHNICAL CATERING: LSG SKY CHEFS, AIRCHEFS KSIA: Infrastructure & Operations Page 53
AIRPORT INFRASTRUCTURE
OPERATIONS
 SERVICE                            HOURS OF DUTY
 Aerodrome                          24 Hours
 Airport Rescue & Fire Fighting     24 Hours
 Custom and Immigration             Mon-Sun 03h00-20h00 (UTC)
 Health & Sanitation                24 Hours on call out
 AIS Briefing Office                24 Hours Nil service SAT 22h00 till SUN 04h00
 ATS Reporting Office               24 Hours Nil service SAT 22h00 till SUN 04h00
 MET Briefing Office                24 Hours
 ATS                                24 Hours Nil service SAT 22h00 till SUN 04h00
 Fuelling                           Mon- Sun – 04h00 – 19h00 (UTC)
 Handling                           24 Hours Nil service SAT 22h00 till SUN 04h00
 Security                           24 Hours Nil service SAT 22h00 till SUN 04h00
 Perimeter                          24 Hours
 De-icing                           Nil

KSIA: Infrastructure & Operations                                         Page 54
AIRPORT INFRASTRUCTURE AND OPERATIONS
RUNWAY

 RUNWAY        MAGNETIC             RUNWAY           RUNWAY       RUNWAY              RUNWAY     RUNWAY
 DESIGNATION   BEARING              LENGTH           WIDTH        SURFACE TYPE        SLOPE      STRENGTH

 06            060OM                3700m            60m          ASPH                + 1,5%     85/F/C/X/T
 24            2400M                3700m            60m          ASPH                - 1,5%     85/F/C/X/T

 RUNWAY               SWY                   CWY              RUNWAY            RUNWAY           TDZ SURFACE
 DESIGNATION          LENGTH                LENGTH           STRIP LENGTH      STRIP WIDTH      TYPE

 06                   300m                  300m                               150m             ASPH
 24                   300m                  300m             3820m             150m             ASPH

 RUNWAY DESIGNATION          TORA                    TODA                   ASDA               LDA

 06                          3700m                   4000m                  3700m              3700m
 24                          3700m                   4000m                  3700m              3700m

KSIA: Infrastructure & Operations                                                                         Page 55
AIRPORT INFRASTRUCTURE AND OPERATIONS
NAVAIDS
FALE AD 2.19 Radio Navigation and Landing Aids
 Type of aid, MAG VAR,          ID    Frequency                    Hours of    Position of            Elevation of DME   Remarks
 Type of supported OP (for                                         Operation   transmitting           transmitting
 VOR/LS/MLS give declination)                                                  antenna co-ordinates   antenna

 1                              2     3                            4           5                      6                  7
 DVOR                           TGV   115.6 MHz TX                 H24         S29o36’40”.20          108                DVOR
                                                                               E031o07’29”.03
 UHF DME                                                                       S29o36’40”.20          108                Channel 103X. 1190MHz
 (TACAN)                                                                       E031o07’29”.03                            Coaxially collocated with VOR.
 ILS GP 24                      TGI   333.2 MHz                    HS          S29o36’05”.46          89.492             89.492
                                                                               E031o07’47”.28
 ILS LOC 24                           109.7 MHz                    HS          S29o37’38”.59          88.419             88.419
                                                                               E031o06’20”.57
 DME 24                         TGI   Channel 34X INT FREQ         HS          S29o36’05”.46          89.492             89.492
                                      RX 1058 MHz RE TX 995 MHz                E031o07’47”.28
 ILS GP 06                      TNI   332.3 MHz                    HS          S29o37’24”.49          88.419             88.419
                                                                               E031o06’38”.46
 ILS LOC 06                           111.3 MHz                    HS          S29o35’44”.61          89.492             89.492
                                                                               E031o07’59”.82
 DME 06                         TNI   Channel 50X INT FREQ         HS          S29o37’24”.49          88.419             88.419
                                      RX 1074 MHz RE TX 1011 MHz               E031o06’38”.46

KSIA: Infrastructure & Operations                                                                              Page 56
ADVENTURE
ROUTE DEVELOPMENT:
TEAM AND SUPPORT

               Page 59
HERITAGE
ROUTE DEVELOPMENT
YOUR SUPPORT TEAM
KwaZulu-Natal (KZN) is effectively geared to support airlines and new direct routes to King Shaka
International Airport.

Dube TradePort Corporation (DTPC) is mandated and supported by other provincial entities to co-ordinate
the introduction of new international air services from Durban.

DTPC has an attractive airline support programme together with a marketing support programme in place
to assist airlines in the startup of new international and regional routes.

The KZN Route Development Team consists of the following entities:

  •    Dube TradePort Corporation
  •    King Shaka International Airport
  •    Department of Economic Development, Tourism and Environmental Affairs, KZN
  •    Tourism KZN
  •    Trade and Investment KZN
  •    Durban Tourism and Durban Investment Promotion Authority
  •    Provincial and National Department of Transport

Route Development Team and Support                                             Page 61
DUBE TRADEPORT
DUBE TRADEPORT CORPORATION
YOUR SUPPORT TEAM

                                     A business entity of the KwaZulu-Natal Provincial Government,
                                     Dube TradePort Corporation is charged with the responsibility for
                                     facilitating the introduction of new regional and international air
                                     services. Dube TradePort is a master-planned world-class passenger
                                     and airfreight hub, and is designated a Special Economic Zone.

                                     Occupying a greenfield site in excess of 3 000 hectares (7 413 acres),
                                     this airport-related project encircles King Shaka International Airport.
                                     A highly competitive business operating environment and the
                                     heart of the Durban Aerotropolis.

                                     www.dubetradeport.co.za

Route Development Team and Support                                              Page 63
DUBE TRADEPORT
PRECINCT MAP
30 MIN TO DURBAN CENTRE
45 MIN TO DURBAN HARBOUR
95 MIN TO RICHARDS BAY HARBOURDUBE TRADEPORT
YOUR SUPPORT TEAM
Dube TradePort comprises four key zones:
1 DUBE TRADEZONE
A specialised, fully-serviced industrial estate with airside access for manufacturers,
assemblers and distributors via an airbridge directly linked to Dube Cargo Terminal
2 DUBE CARGO TERMINAL
One of the most secure and technologically advanced cargo operations in Africa,
it operates 24/7 and provides critical access to global supply chains
3 DUBE CITY
Premium business, retail and hospitality space in an urban green precinct
4 DUBE AGRIZONE
As Africa’s first integrated perishables supply chain, this high-tech agricultural
cluster hosts, 16 hectares of climate-controlled greenhouses, distribution
packhouses and a micro-propagation facility
Route Development Team and Support Page 65KING SHAKA INTERNATIONAL AIRPORT YOUR SUPPORT TEAM King Shaka International Airport is owned and operated by Airports Company South Africa (ACSA). With a global footprint spanning three continents, ACSA provides a professional, world-class service for South Africa’s nine principle airports as well as airports in Mumbai, India, and São Paulo, Brazil. www.airports.co.za Route Development Team and Support Page 66
DEPARTMENT OF ECONOMIC DEVELOPMENT,
TOURISM & ENVIRONMENTAL AFFAIRS, KZN
YOUR SUPPORT TEAM

The KwaZulu-Natal Department of Economic Development,
Tourism and Environmental Affairs is mandated to oversee the
socio-economic transformation in the province, by way of the
following:
• Leads the policy and strategic initiatives directed at
     promoting development and growth in various sectors of
     the economy;
• Co-operates with various stakeholders and social partners,
     including private sector and civil society; and
• Guided by national and provincial legislative, policy and
     strategic frameworks.

www.kzndedt.gov.za

Route Development Team and Support                             Page 67
TOURISM KWAZULU-NATAL YOUR SUPPORT TEAM The KwaZulu-Natal Tourism Authority, which operates under the name Tourism KwaZulu-Natal, is responsible for the development, promotion and marketing of tourism into and within the province. The vision of Tourism KwaZulu-Natal is to position the province of KwaZulu-Natal as Africa’s leading tourism destination, nationally and internationally. The mission of the organisation is to initiate, facilitate, co-ordinate and implement: • Strategic tourism marketing; and • Demand–driven tourism development programmes. This grows tourism and thereby serves to achieve the transformation of the tourism sector within the province, providing economic benefits to all stakeholders and the province. www.zulu.org.co.za Route Development Team and Support Page 68
TRADE AND INVESTMENT KWAZULU-NATAL
YOUR SUPPORT TEAM

Trade and Investment KwaZulu-Natal (TIKZN) is a South African trade and
inward investment promotion agency, established to promote the province of
KwaZulu-Natal (KZN) as an investment destination and to facilitate trade by
assisting local companies to access international markets. The organisation:
• Identifies, develops and packages investment opportunities in KZN;
• Provides a professional service to all clientele; brands and markets KZN
    as an investment destination; and
• Retains and expands trade and export activities and links opportunities
    to the developmental needs of the KwaZulu-Natal community.

www.tikzn.co.za

Route Development Team and Support                                             Page 69
ETHEKWINI MUNICIPALITY
YOUR SUPPORT TEAM
DURBAN TOURISM
The strategic focus of Durban Tourism is to drive tourism and make it a key
contributor to the local economy, thereby promoting economic benefit for all its
communities.
The mission of Durban Tourism is to:
• Position Durban as a preferred “must visit” tourism destination, providing a
unique Durban experience supported by world class facilities and
infrastructure; and
• Market Durban as a “must visit” destination to the domestic and international
tourism markets, and in so doing achieve economic development and
facilitate job creation for the benefit of all the people of the Metropolitan
region.
www.durbanexperience.co.za
Route Development Team and Support Page 70DEPARTMENT OF TRANSPORT YOUR SUPPORT TEAM The Department of Transport is responsible for the overall Air Transport Policy and advisory thereof. It is also mandated to negotiate on a reciprocal basis the framework of the Bilateral Air Services Agreements with respective foreign Governments or Authorities to enhance air connectivity for the promotion of trade and tourism. www.transport.gov.za www.kzntransport.gov.za Route Development Team and Support Page 71
CONTACT US
KEITH GREEN
AIR SERVICES SPECIALIST
Email:    Keith.Green@dubetradeport.co.za
Tel:      +27 32 814 0000
Web:      www.dubetradeport.co.za

Route Development Team and Support          Page 72
BUSINESS AND TOURISM
www.dubetradeport.co.za
You can also read